Financial Performance Dashboard
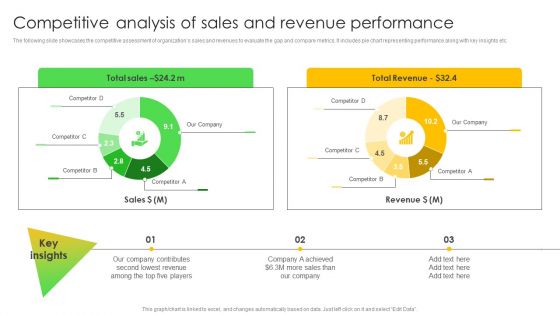
Competitive Analysis Of Sales And Revenue Performance Information PDF
The following slide showcases the competitive assessment of organizations sales and revenues to evaluate the gap and compare metrics. It includes pie chart representing performance along with key insights etc. Slidegeeks is one of the best resources for PowerPoint templates. You can download easily and regulate Competitive Analysis Of Sales And Revenue Performance Information PDF for your personal presentations from our wonderful collection. A few clicks is all it takes to discover and get the most relevant and appropriate templates. Use our Templates to add a unique zing and appeal to your presentation and meetings. All the slides are easy to edit and you can use them even for advertisement purposes.

Sales Team Performance Measurement Kpis Ppt Professional Templates PDF
This slide illustrates overview of total sales, average revenue generation, employee commission, sales target achieved by salespersons to keep track of monthly employee performance and sales target achieve by employees. Showcasing this set of slides titled Sales Team Performance Measurement Kpis Ppt Professional Templates PDF. The topics addressed in these templates are Total Sales, Average Commission, Sales Commission, Per Person. All the content presented in this PPT design is completely editable. Download it and make adjustments in color, background, font etc. as per your unique business setting.
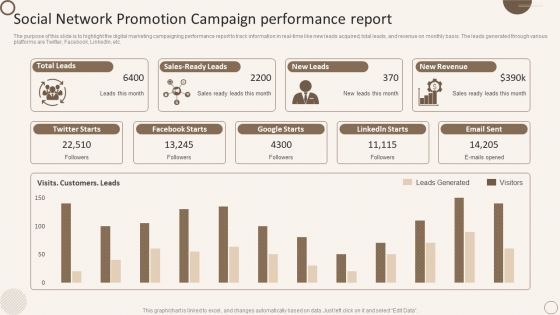
Social Network Promotion Campaign Performance Report Demonstration PDF
The purpose of this slide is to highlight the digital marketing campaigning performance report to track information in real-time like new leads acquired, total leads, and revenue on monthly basis. The leads generated through various platforms are Twitter, Facebook, LinkedIn, etc. Pitch your topic with ease and precision using this Social Network Promotion Campaign Performance Report Demonstration PDF. This layout presents information on Sales Ready Leads, New Leads, New Revenue. It is also available for immediate download and adjustment. So, changes can be made in the color, design, graphics or any other component to create a unique layout.

Monthly Company Performance Analysisp And L Kpis Brochure PDF
Deliver and pitch your topic in the best possible manner with this monthly company performance analysisp and l kpis brochure pdf. Use them to share invaluable insights on revenue, net increase in cash and impress your audience. This template can be altered and modified as per your expectations. So, grab it now.

Nestle Performance Management Report Quotes Ppt Infographic Template Gallery PDF
Make sure to capture your audiences attention in your business displays with our gratis customizable Nestle Performance Management Report Quotes Ppt Infographic Template Gallery PDF. These are great for business strategies, office conferences, capital raising or task suggestions. If you desire to acquire more customers for your tech business and ensure they stay satisfied, create your own sales presentation with these plain slides.
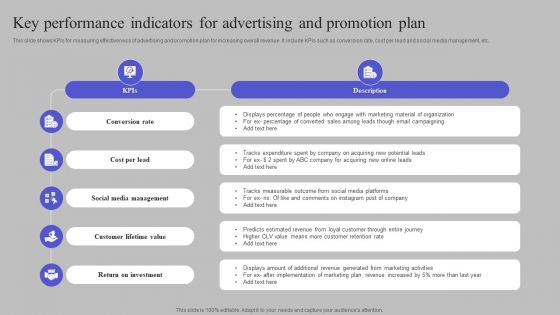
Key Performance Indicators For Advertising And Promotion Plan Background PDF
This slide shows KPIs for measuring effectiveness of advertising and promotion plan for increasing overall revenue. It include KPIs such as conversion rate, cost per lead and social media management, etc. Persuade your audience using this Key Performance Indicators For Advertising And Promotion Plan Background PDF. This PPT design covers five stages, thus making it a great tool to use. It also caters to a variety of topics including Conversion Rate, Cost Per Lead, Social Media Management. Download this PPT design now to present a convincing pitch that not only emphasizes the topic but also showcases your presentation skills.
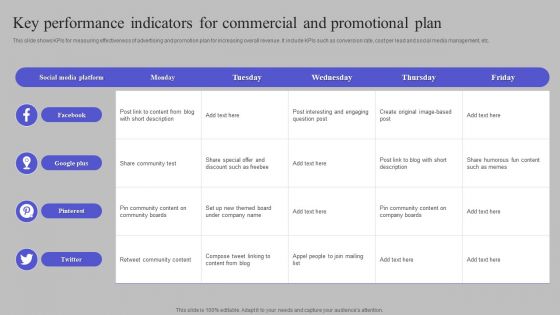
Key Performance Indicators For Commercial And Promotional Plan Information PDF
This slide shows KPIs for measuring effectiveness of advertising and promotion plan for increasing overall revenue. It include KPIs such as conversion rate, cost per lead and social media management, etc. Showcasing this set of slides titled Key Performance Indicators For Commercial And Promotional Plan Information PDF. The topics addressed in these templates are Facebook, Google Plus, Pinterest. All the content presented in this PPT design is completely editable. Download it and make adjustments in color, background, font etc. as per your unique business setting.
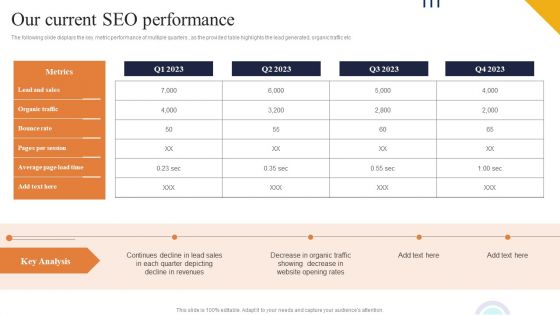
Our Current SEO Performance Ppt PowerPoint Presentation File Files PDF
The following slide displays the key metric performance of multiple quarters , as the provided table highlights the lead generated, organic traffic etc Make sure to capture your audiences attention in your business displays with our gratis customizable Our Current SEO Performance Ppt PowerPoint Presentation File Files PDF. These are great for business strategies, office conferences, capital raising or task suggestions. If you desire to acquire more customers for your tech business and ensure they stay satisfied, create your own sales presentation with these plain slides.
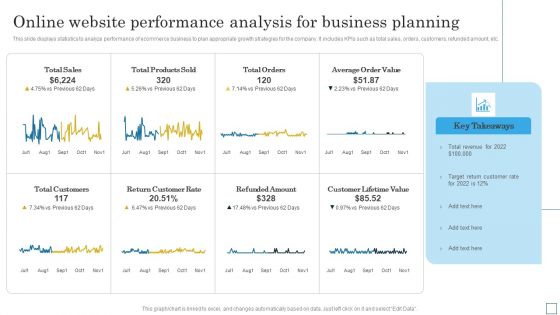
Online Website Performance Analysis For Business Planning Slides PDF
This slide displays statistics to analyze performance of ecommerce business to plan appropriate growth strategies for the company. It includes KPIs such as total sales, orders, customers, refunded amount, etc. Pitch your topic with ease and precision using this Online Website Performance Analysis For Business Planning Slides PDF. This layout presents information on Revenue, Customer Rate, Target. It is also available for immediate download and adjustment. So, changes can be made in the color, design, graphics or any other component to create a unique layout.

Web Content Performance Evaluation By Management Strategy Pictures PDF
This slide covers performance evaluation of website CMS to increase brand awareness and customer engagement. It includes elements such as goals, strategies used, software along with KPIs such as website traffic, page views, blog comments, renewal rates, blog forwards etc. Pitch your topic with ease and precision using this Web Content Performance Evaluation By Management Strategy Pictures PDF. This layout presents information on Customer Engagement, Lead Generation, Revenue Sales. It is also available for immediate download and adjustment. So, changes can be made in the color, design, graphics or any other component to create a unique layout.

Performance Analysis Of Product Diversification Strategies Summary PDF
The following slide outlines various key performance indicators KPIs that can be used to evaluate the success of product diversification strategies. The key metrics outlined in slide are product revenue, total customers acquired, return on investment ROI, product adoption rate, and customer satisfaction rate. Slidegeeks is one of the best resources for PowerPoint templates. You can download easily and regulate Performance Analysis Of Product Diversification Strategies Summary PDF for your personal presentations from our wonderful collection. A few clicks is all it takes to discover and get the most relevant and appropriate templates. Use our Templates to add a unique zing and appeal to your presentation and meetings. All the slides are easy to edit and you can use them even for advertisement purposes.
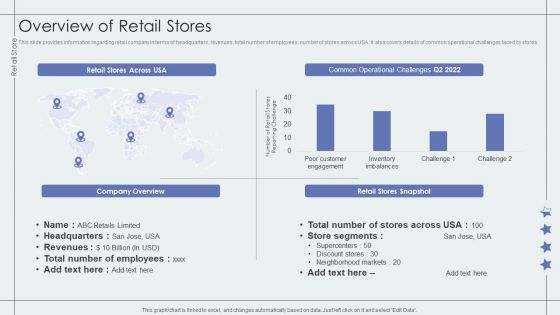
Overview Of Retail Stores Retail Outlet Performance Assessment Structure PDF
This slide provides information regarding retail company in terms of headquarters, revenues, total number of employees, number of stores across USA. It also covers details of common operational challenges faced by stores.Deliver an awe inspiring pitch with this creative Overview Of Retail Stores Retail Outlet Performance Assessment Structure PDF bundle. Topics like Common Operation, Neighborhood Markets, Stores Snapshot can be discussed with this completely editable template. It is available for immediate download depending on the needs and requirements of the user.
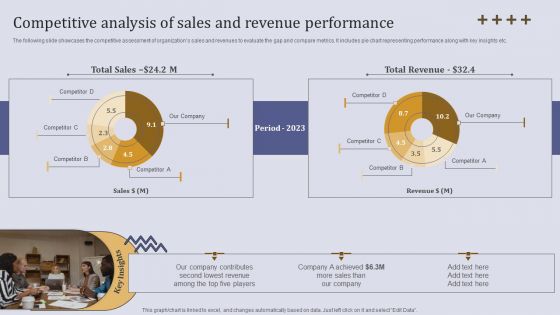
Competitive Analysis Of Sales And Revenue Performance Ppt Introduction PDF
The following slide showcases the competitive assessment of organizations sales and revenues to evaluate the gap and compare metrics. It includes pie chart representing performance along with key insights etc. This modern and well arranged Competitive Analysis Of Sales And Revenue Performance Ppt Introduction PDF provides lots of creative possibilities. It is very simple to customize and edit with the Powerpoint Software. Just drag and drop your pictures into the shapes. All facets of this template can be edited with Powerpoint no extra software is necessary. Add your own material, put your images in the places assigned for them, adjust the colors, and then you can show your slides to the world, with an animated slide included.

Human Resource Metrics For Organizational Performance Diagrams PDF
This slide showcases KPIs of human resource that can ensure employee retention and workplace productivity in organization. Its key factors are human capital output, human capital capability and health, culture and attitudes and employee lifecycle. Showcasing this set of slides titled Human Resource Metrics For Organizational Performance Diagrams PDF. The topics addressed in these templates are Human Capital Output, Human Capital Capability Health, Culture Attitudes. All the content presented in this PPT design is completely editable. Download it and make adjustments in color, background, font etc. as per your unique business setting.
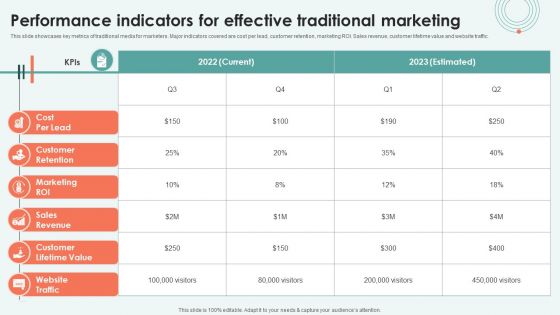
Performance Indicators For Effective Traditional Marketing Ppt Show Influencers PDF
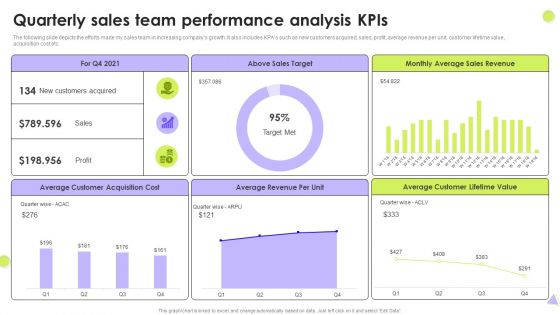
Quarterly Sales Team Performance Analysis Kpis Slides PDF
The following slide depicts the efforts made my sales team in increasing companys growth. It also includes KPAs such as new customers acquired, sales, profit, average revenue per unit, customer lifetime value, acquisition cost etc. Showcasing this set of slides titled Quarterly Sales Team Performance Analysis Kpis Slides PDF. The topics addressed in these templates are Above Sales Target, Average Sales Revenue, Average Customer. All the content presented in this PPT design is completely editable. Download it and make adjustments in color, background, font etc. as per your unique business setting.
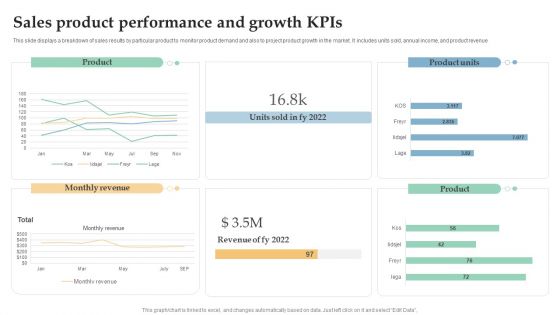
Sales Product Performance And Growth Kpis Ppt Layouts Mockup PDF
This slide displays a breakdown of sales results by particular product to monitor product demand and also to project product growth in the market. It includes units sold, annual income, and product revenue. Pitch your topic with ease and precision using this Sales Product Performance And Growth Kpis Ppt Layouts Mockup PDF. This layout presents information on Monthly Revenue, Product, Product Units. It is also available for immediate download and adjustment. So, changes can be made in the color, design, graphics or any other component to create a unique layout.

Operational Marketing Tactical Plan Kpis To Track Performance Background PDF
This slide provides KPIs to determine the overall effectiveness of the companys marketing plan. These include KPIs such as cost per lead, cost per customer acquisition, marketing rate of investment, sales qualified leads, and sales revenue. Presenting Operational Marketing Tactical Plan Kpis To Track Performance Background PDF to dispense important information. This template comprises five stages. It also presents valuable insights into the topics including Cost Per Lead, Cost Per Customer Acquisition, Sales Qualified Leads. This is a completely customizable PowerPoint theme that can be put to use immediately. So, download it and address the topic impactfully.

Sales Quarterly Performance Review System With Improvement Plan Infographics PDF
This slide shows sales division quarterly business review QBR with improvement steps. It provides information about deals closed, average sales cycle, revenue, customer buying motivation, leads onboard, gross margin, etc. Presenting Sales Quarterly Performance Review System With Improvement Plan Infographics PDF to dispense important information. This template comprises four stages. It also presents valuable insights into the topics including Deals Closed, Average Sales Cycle, Revenue. This is a completely customizable PowerPoint theme that can be put to use immediately. So, download it and address the topic impactfully.

Impact Of Performance Management System On Employees Infographics PDF
This slide impact of depicting employee productivity strategies in organization. It involves impact on revenue rate, profitability rate, retention, customer satisfaction and project completion rate. This modern and well arranged Impact Of Performance Management System On Employees Infographics PDF provides lots of creative possibilities. It is very simple to customize and edit with the Powerpoint Software. Just drag and drop your pictures into the shapes. All facets of this template can be edited with Powerpoint no extra software is necessary. Add your own material, put your images in the places assigned for them, adjust the colors, and then you can show your slides to the world, with an animated slide included.
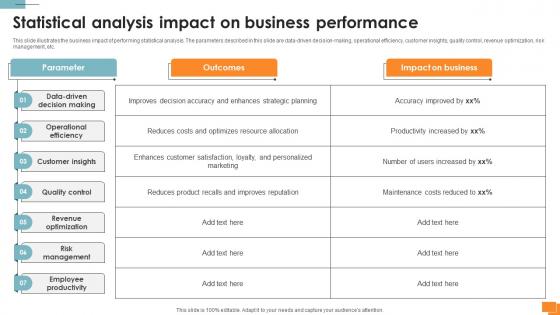
Statistical Tools For Evidence Statistical Analysis Impact On Business Performance
This slide illustrates the business impact of performing statistical analysis. The parameters described in this slide are data-driven decision-making, operational efficiency, customer insights, quality control, revenue optimization, risk management, etc. Do you know about Slidesgeeks Statistical Tools For Evidence Statistical Analysis Impact On Business Performance These are perfect for delivering any kind od presentation. Using it, create PowerPoint presentations that communicate your ideas and engage audiences. Save time and effort by using our pre-designed presentation templates that are perfect for a wide range of topic. Our vast selection of designs covers a range of styles, from creative to business, and are all highly customizable and easy to edit. Download as a PowerPoint template or use them as Google Slides themes.
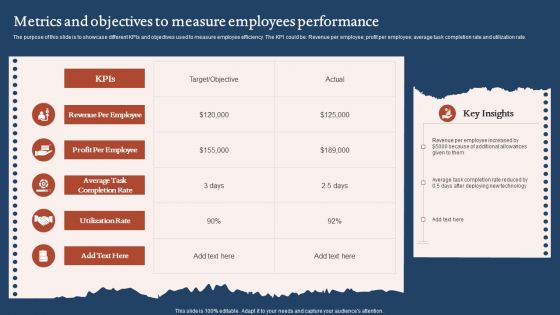
Metrics And Objectives To Measure Employees Performance Clipart PDF
The purpose of this slide is to showcase different KPIs and objectives used to measure employee efficiency. The KPI could be Revenue per employee profit per employee average task completion rate and utilization rate. Showcasing this set of slides titled Metrics And Objectives To Measure Employees Performance Clipart PDF. The topics addressed in these templates are Utilization Rate, Profit Per Employee, Revenue Per Employee. All the content presented in this PPT design is completely editable. Download it and make adjustments in color, background, font etc. as per your unique business setting.
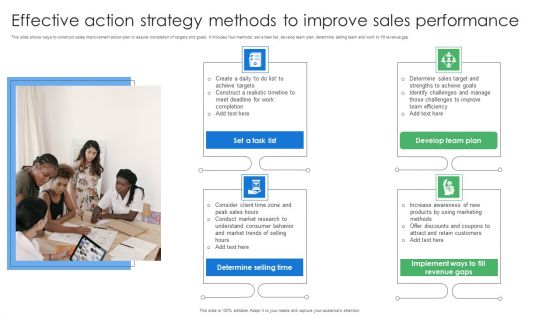
Effective Action Strategy Methods To Improve Sales Performance Sample PDF
This slide shows ways to construct sales improvement action plan to assure completion of targets and goals. It includes four methods set a task list, develop team plan, determine selling team and work to fill revenue gap. Presenting Effective Action Strategy Methods To Improve Sales Performance Sample PDF to dispense important information. This template comprises four stages. It also presents valuable insights into the topics including Sales, Conduct Market Research, Market Trends. This is a completely customizable PowerPoint theme that can be put to use immediately. So, download it and address the topic impactfully.
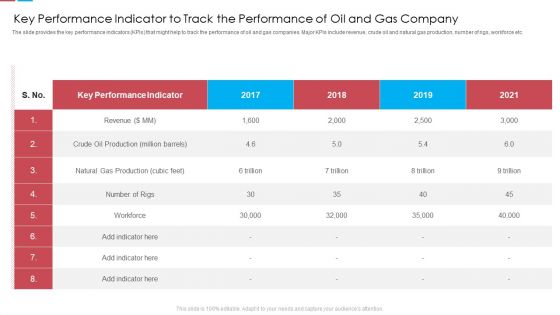
Key Performance Indicator To Track The Performance Of Oil And Gas Company Ppt Ideas Graphics Design PDF
The slide provides the key performance indicators KPIs that might help to track the performance of oil and gas companies. Major KPIs include revenue, crude oil and natural gas production, number of rigs, workforce etc. Deliver an awe inspiring pitch with this creative key performance indicator to track the performance of oil and gas company ppt ideas graphics design pdf bundle. Topics like key performance indicator to track the performance of oil and gas company can be discussed with this completely editable template. It is available for immediate download depending on the needs and requirements of the user.
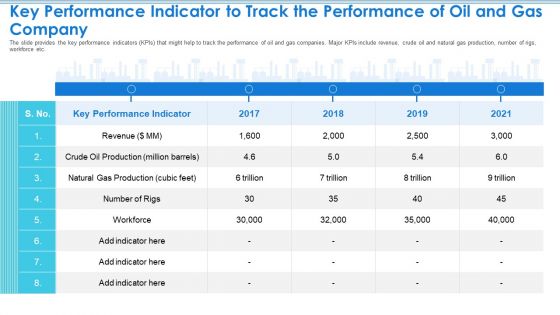
Case Competition Petroleum Sector Issues Key Performance Indicator To Track The Performance Of Oil And Gas Company Diagrams PDF
The slide provides the key performance indicators KPIs that might help to track the performance of oil and gas companies. Major KPIs include revenue, crude oil and natural gas production, number of rigs, workforce etc. Deliver and pitch your topic in the best possible manner with this case competition petroleum sector issues key performance indicator to track the performance of oil and gas company diagrams pdf. Use them to share invaluable insights on key performance indicator, revenue, 2017 to 2021 and impress your audience. This template can be altered and modified as per your expectations. So, grab it now.
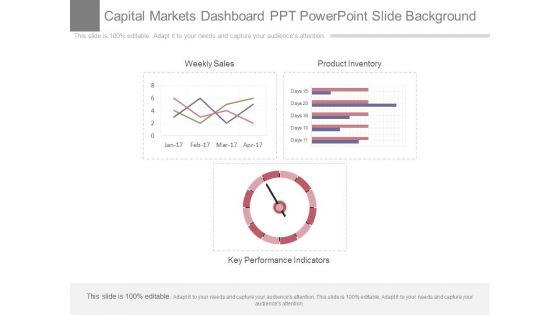
Capital Markets Dashboard Ppt Powerpoint Slide Background
This is a capital markets dashboard ppt powerpoint slide background. This is a three stage process. The stages in this process are weekly sales, product inventory, key performance indicators.

Ecommerce KPI Dashboard With Pand L Statement Download PDF
This slide showcases ecommerce key performance indicators KPI dashboard with financial statement. It provides information about total sales, orders, net profit, net profit margin, average order value, channels, etc. This Ecommerce KPI Dashboard With Pand L Statement Download PDF from Slidegeeks makes it easy to present information on your topic with precision. It provides customization options, so you can make changes to the colors, design, graphics, or any other component to create a unique layout. It is also available for immediate download, so you can begin using it right away. Slidegeeks has done good research to ensure that you have everything you need to make your presentation stand out. Make a name out there for a brilliant performance.
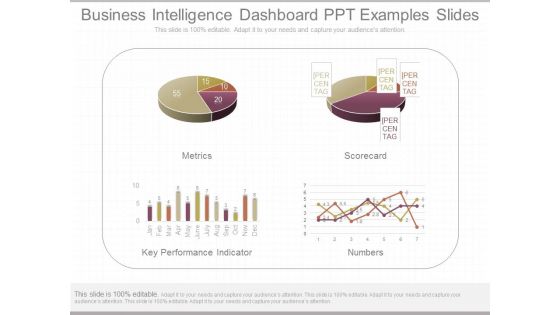
Business Intelligence Dashboard Ppt Examples Slides
This is a business intelligence dashboard ppt examples slides. This is a four stage process. The stages in this process are metrics, scorecard, key performance indicator, numbers.

Website Performance Review Template 1 Ppt PowerPoint Presentation Portfolio Master Slide
This is a website performance review template 1 ppt powerpoint presentation portfolio master slide. This is a five stage process. The stages in this process are traffic sources, site consumption trend, online transaction, average visit time, organic branded.
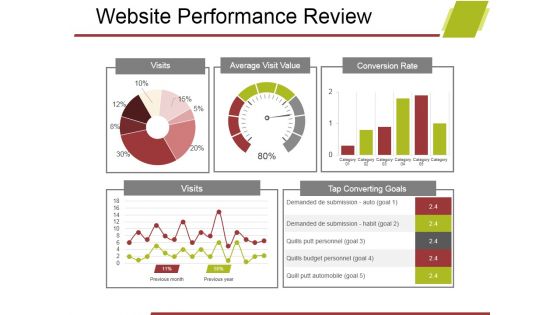
Website Performance Review Template 2 Ppt PowerPoint Presentation Model File Formats
This is a website performance review template 2 ppt powerpoint presentation model file formats. This is a five stage process. The stages in this process are visits, average visit value, conversion rate, visits, tap converting goals.
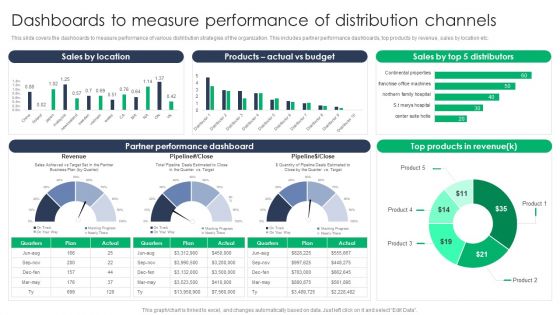
Criterion For Choosing Distribution Channel For Efficient Sales Administration Dashboards To Measure Performance Of Distribution Formats PDF
This slide covers the dashboards to measure performance of various distribution strategies of the organization. This includes partner performance dashboards, top products by revenue, sales by location etc. From laying roadmaps to briefing everything in detail, our templates are perfect for you. You can set the stage with your presentation slides. All you have to do is download these easy-to-edit and customizable templates. Criterion For Choosing Distribution Channel For Efficient Sales Administration Dashboards To Measure Performance Of Distribution Formats PDF will help you deliver an outstanding performance that everyone would remember and praise you for. Do download this presentation today.
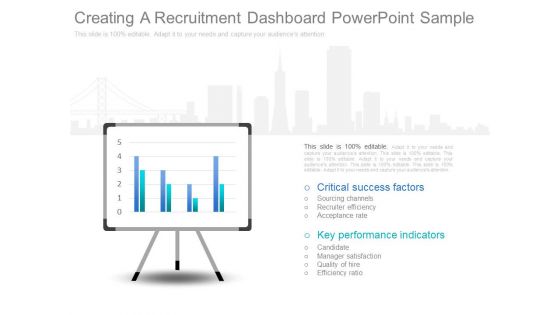
Creating A Recruitment Dashboard Powerpoint Sample
This is a creating a recruitment dashboard powerpoint sample. This is a two stage process. The stages in this process are critical success factors, sourcing channels, recruiter efficiency, acceptance rate, key performance indicators, candidate, manager satisfaction, quality of hire, efficiency ratio.

Software Implementation Strategy Key Performance Indicators Highlighting Current Problems Of Organization Professional PDF
This slide represents the key performance indicators to track the problems faced by organization and draw effective strategies to tackle the problems. It includes key performance indicators of decline in organizational sales and customer engagement rate. Make sure to capture your audiences attention in your business displays with our gratis customizable Software Implementation Strategy Key Performance Indicators Highlighting Current Problems Of Organization Professional PDF. These are great for business strategies, office conferences, capital raising or task suggestions. If you desire to acquire more customers for your tech business and ensure they stay satisfied, create your own sales presentation with these plain slides.
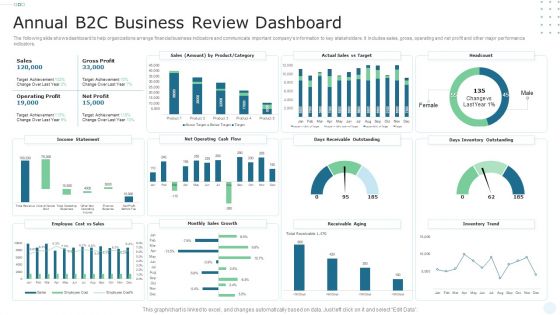
Annual B2C Business Review Dashboard Microsoft PDF
The following slide shows dashboard to help organizations arrange financial business indicators and communicate important companys information to key stakeholders. It includes sales, gross, operating and net profit and other major performance indicators. Showcasing this set of slides titled Annual B2C Business Review Dashboard Microsoft PDF. The topics addressed in these templates are Gross Profit, Sales, Operating Profit. All the content presented in this PPT design is completely editable. Download it and make adjustments in color, background, font etc. as per your unique business setting.
Project Tracking Dashboard Template Ppt Sample
This is a project tracking dashboard template ppt sample. This is a five stage process. The stages in this process are requirements, analytics, needs, performance, analysis.
Storage Logistics Warehouse Management Dashboard Icons PDF
The slide demonstrates information regarding the warehouse management dashboard in order to track key activities. Deliver an awe inspiring pitch with this creative storage logistics warehouse management dashboard icons pdf bundle. Topics like orders, kpls monthly, global financial performances can be discussed with this completely editable template. It is available for immediate download depending on the needs and requirements of the user.

Loss Of Income And Financials Decline In An Automobile Organization Case Study Key Performance Indicators Brochure PDF
The slide shows the key Performance Indicator KPI s which will help the company to track the success rate of implemented strategies. Major KPIs include number of vehicle sold and manufactured, utilization rate, number of visitors, customer satisfaction level etc.Deliver an awe inspiring pitch with this creative loss of income and financials decline in an automobile organization case study key performance indicators brochure pdf bundle. Topics like key performance indicator, utilization rate, customer satisfaction level can be discussed with this completely editable template. It is available for immediate download depending on the needs and requirements of the user
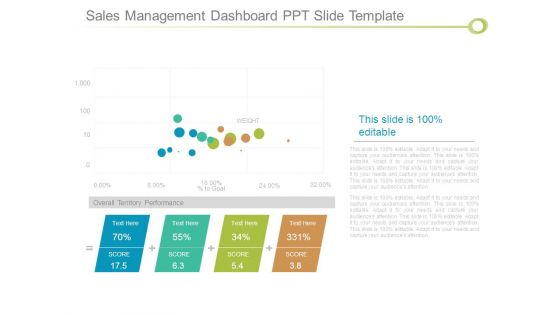
Sales Management Dashboard Ppt Slide Template
This is a sales management dashboard ppt slide template. This is a four stage process. The stages in this process are weight, goal, overall territory performance, score.
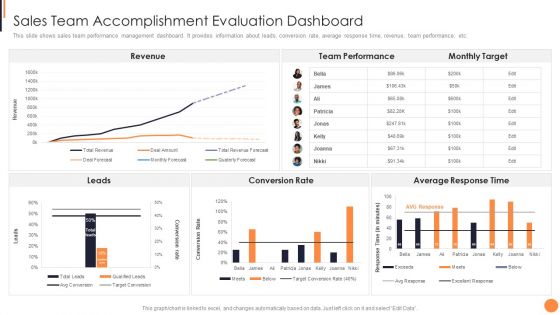
Sales Team Accomplishment Evaluation Dashboard Portrait PDF
This slide shows sales team performance management dashboard. It provides information about leads, conversion rate, average response time, revenue, team performance, etc. Pitch your topic with ease and precision using this sales team accomplishment evaluation dashboard portrait pdf This layout presents information on sales team accomplishment evaluation dashboard It is also available for immediate download and adjustment. So, changes can be made in the color, design, graphics or any other component to create a unique layout.

Attended Robotic Process Automation Dashboard Rules PDF
This slide consists of a strategic automation dashboard used to monitor attended robotic process which will assist managers to track the performance. The key performance indicators include money saved, time saved, monetary goal for the year etc. Showcasing this set of slides titled Attended Robotic Process Automation Dashboard Rules PDF. The topics addressed in these templates are Productivity, Goal, Process Automation Dashboard. All the content presented in this PPT design is completely editable. Download it and make adjustments in color, background, font etc. as per your unique business setting.
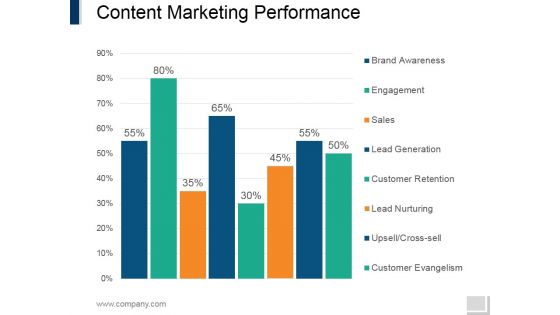
Content Marketing Performance Template 1 Ppt PowerPoint Presentation Infographics Graphics Example
This is a content marketing performance template 1 ppt powerpoint presentation infographics graphics example. This is a eight stage process. The stages in this process are brand awareness, engagement, sales, lead generation, customer retention lead nurturing, upsell.
Website Performance Review Template 2 Ppt PowerPoint Presentation Icon Design Ideas
This is a website performance review template 2 ppt powerpoint presentation icon design ideas. This is a four stage process. The stages in this process are column two, revenue trends, traffic sources.

Call Center Metrics Dashboard With Average Response Time Inspiration PDF
Mentioned slide outlines KPI dashboard which can be used by call center to measure the performance of their agents. The key metrics highlighted in the dashboard are first call resolution, daily abandonment rate, total number of calls by topic, top performing call agents etc. Showcasing this set of slides titled Call Center Metrics Dashboard With Average Response Time Inspiration PDF. The topics addressed in these templates are Efficiency, Quality, Activity, Daily Average Response, Daily Average Transfer. All the content presented in this PPT design is completely editable. Download it and make adjustments in color, background, font etc. as per your unique business setting.
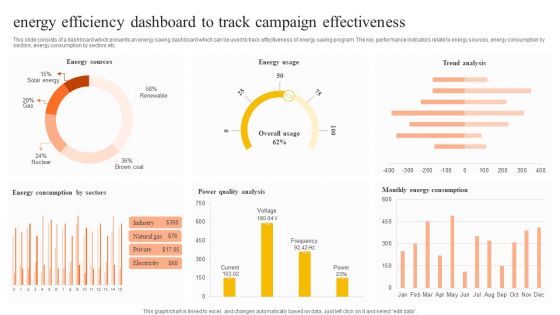
Energy Efficiency Dashboard To Track Campaign Effectiveness Pictures PDF
This slide consists of a dashboard which presents an energy saving dashboard which can be used to track effectiveness of energy saving program. The key performance indicators relate to energy sources, energy consumption by sectors, energy consumption by sectors etc. Pitch your topic with ease and precision using this Energy Efficiency Dashboard To Track Campaign Effectiveness Pictures PDF. This layout presents information on Energy Sources, Energy Usage, Trend Analysis. It is also available for immediate download and adjustment. So, changes can be made in the color, design, graphics or any other component to create a unique layout.
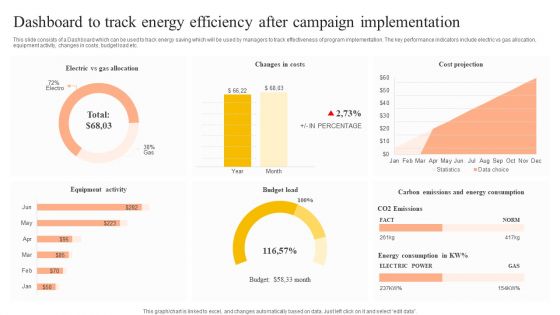
Dashboard To Track Energy Efficiency After Campaign Implementation Pictures PDF
This slide consists of a Dashboard which can be used to track energy saving which will be used by managers to track effectiveness of program implementation. The key performance indicators include electric vs gas allocation, equipment activity, changes in costs, budget load etc. Showcasing this set of slides titled Dashboard To Track Energy Efficiency After Campaign Implementation Pictures PDF. The topics addressed in these templates are Equipment Activity, Budget Load, Cost Projection. All the content presented in this PPT design is completely editable. Download it and make adjustments in color, background, font etc. as per your unique business setting.

Client Support KPI Dashboard Rules PDF
This slide shows key performance indicators of customer service delivery. It includes service level, request volume, cost of revenue, customer satisfaction, customer retention, etc. Pitch your topic with ease and precision using this Client Support KPI Dashboard Rules PDF. This layout presents information on Customer Retention, Cost Per Support, Average Issue Solving Time. It is also available for immediate download and adjustment. So, changes can be made in the color, design, graphics or any other component to create a unique layout.

Information Technology Project Analysis With Kpi Dashboard Portrait PDF
The following slide highlights various key performance indicators to ensure successful information technology IT project completion. It also includes components such as risks, status, budget, deadlines, average task handle time, overdue activities etc. Pitch your topic with ease and precision using this Information Technology Project Analysis With Kpi Dashboard Portrait PDF. This layout presents information on Planning Completed, Design Completed, Development . It is also available for immediate download and adjustment. So, changes can be made in the color, design, graphics or any other component to create a unique layout.

Dashboard For Managing Warehouse Operations Mockup PDF
This slide showcases dashboard that can help organization to manage and track the warehouse operations. Its key elements are order, volume, inventory, monthly KPIs and global financial performance. Here you can discover an assortment of the finest PowerPoint and Google Slides templates. With these templates, you can create presentations for a variety of purposes while simultaneously providing your audience with an eye catching visual experience. Download Dashboard For Managing Warehouse Operations Mockup PDF to deliver an impeccable presentation. These templates will make your job of preparing presentations much quicker, yet still, maintain a high level of quality. Slidegeeks has experienced researchers who prepare these templates and write high quality content for you. Later on, you can personalize the content by editing the Dashboard For Managing Warehouse Operations Mockup PDF.
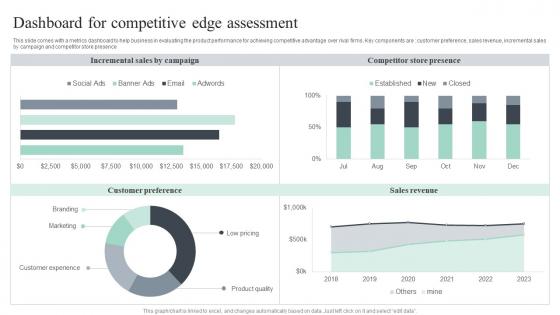
Dashboard For Competitive Edge Assessment Themes Pdf
This slide comes with a metrics dashboard to help business in evaluating the product performance for achieving competitive advantage over rival firms. Key components are customer preference, sales revenue, incremental sales by campaign and competitor store presence Pitch your topic with ease and precision using this Dashboard For Competitive Edge Assessment Themes Pdf. This layout presents information on Incremental Sales, Competitor Store Presence, Sales Revenue. It is also available for immediate download and adjustment. So, changes can be made in the color, design, graphics or any other component to create a unique layout.

Apparel Retail Management Sales Dashboard Professional Pdf
This slide depicts the sales dashboard for apparel retail management that gives a visual representation of the most recent performance metrics. It includes details on KPIs such as sales revenue, number of customers, average transaction price, etc.Pitch your topic with ease and precision using this Apparel Retail Management Sales Dashboard Professional Pdf This layout presents information on Sales Revenue, Transaction Price, Units Per Customer It is also available for immediate download and adjustment. So, changes can be made in the color, design, graphics or any other component to create a unique layout.
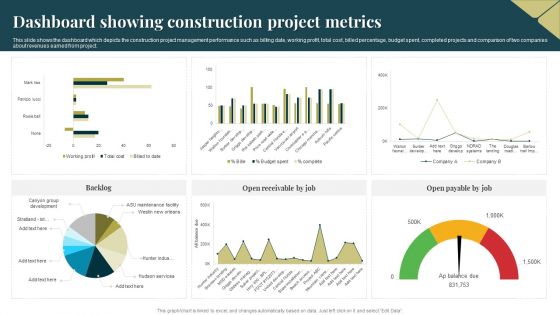
Dashboard Showing Construction Project Metrics Sample PDF
This slide shows the dashboard which depicts the construction project management performance such as billing date, working profit, total cost, billed percentage, budget spent, completed projects and comparison of two companies about revenues earned from project. Showcasing this set of slides titled Dashboard Showing Construction Project Metrics Sample PDF. The topics addressed in these templates are Dashboard, Construction Project Metrics. All the content presented in this PPT design is completely editable. Download it and make adjustments in color, background, font etc. as per your unique business setting.

Customer Support Services Analysis Dashboard Template PDF
The following slide illustrates dashboard for customer services which can be used to evaluate performance of businesses over the years. It include key elements such as request volume, customer retention, cost per support, revenue, customer satisfaction etc. Showcasing this set of slides titled Customer Support Services Analysis Dashboard Template PDF. The topics addressed in these templates are Customer Support Services, Analysis Dashboard. All the content presented in this PPT design is completely editable. Download it and make adjustments in color, background, font etc. as per your unique business setting.
Stock Inventory Acquisition Dashboard For Managing Warehouse Operations Icons PDF
This slide showcases dashboard that can help organization to manage and track the warehouse operations. Its key elements are order, volume, inventory, monthly KPIs and global financial performance. Explore a selection of the finest Stock Inventory Acquisition Dashboard For Managing Warehouse Operations Icons PDF here. With a plethora of professionally designed and pre-made slide templates, you can quickly and easily find the right one for your upcoming presentation. You can use our Stock Inventory Acquisition Dashboard For Managing Warehouse Operations Icons PDF to effectively convey your message to a wider audience. Slidegeeks has done a lot of research before preparing these presentation templates. The content can be personalized and the slides are highly editable. Grab templates today from Slidegeeks.

Weekly Marketing Investment Report Dashboard Ideas PDF
This slide illustrates the overview of advertising expenditure weekly performance metrics. It incorporate total budget spent and estimated for advertising, estimated and actual registration, revenue, conversion metrics rates etc. Showcasing this set of slides titled Weekly Marketing Investment Report Dashboard Ideas PDF. The topics addressed in these templates are Conversion Metrics, Quality Of Traffic, Quality Of Transaction. All the content presented in this PPT design is completely editable. Download it and make adjustments in color, background, font etc. as per your unique business setting.
Project Tracking Cost Tracker Dashboard Elements PDF
The following slide highlights the cost analysis of various projects to perform feasibility analysis. It includes budgeted versus actual cost, project wise cost and revenue allocation etc. Showcasing this set of slides titled Project Tracking Cost Tracker Dashboard Elements PDF. The topics addressed in these templates are Budgeted Costs, Resource Allocation, Project Costs. All the content presented in this PPT design is completely editable. Download it and make adjustments in color, background, font etc. as per your unique business setting.
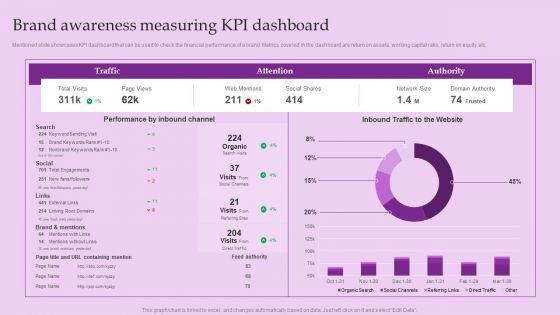
Brand Awareness Measuring Kpi Dashboard Brand And Equity Evaluation Techniques Ideas PDF
Mentioned slide showcases KPI dashboard that can be used to check the financial performance of a brand. Metrics covered in the dashboard are return on assets, working capital ratio, return on equity etc.From laying roadmaps to briefing everything in detail, our templates are perfect for you. You can set the stage with your presentation slides. All you have to do is download these easy-to-edit and customizable templates. Brand Awareness Measuring Kpi Dashboard Brand And Equity Evaluation Techniques Ideas PDF will help you deliver an outstanding performance that everyone would remember and praise you for. Do download this presentation today.
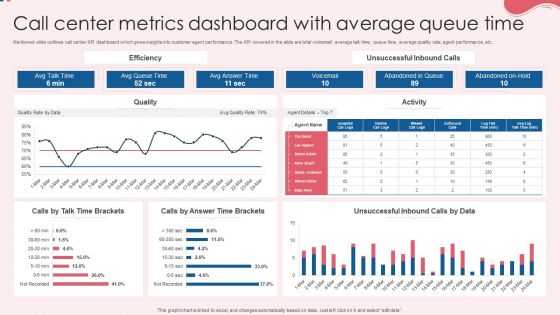
Call Center Metrics Dashboard With Average Queue Time Topics PDF
Mentioned slide outlines call center KPI dashboard which gives insights into customer agent performance. The KPI covered in the slide are total voicemail, average talk time, queue time, average quality rate, agent performance, etc. Pitch your topic with ease and precision using this Call Center Metrics Dashboard With Average Queue Time Topics PDF. This layout presents information on Efficiency, Quality, Activity. It is also available for immediate download and adjustment. So, changes can be made in the color, design, graphics or any other component to create a unique layout.
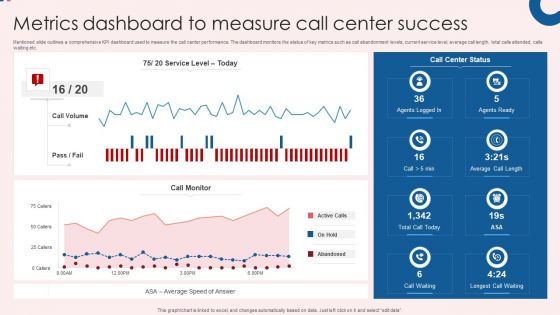
Metrics Dashboard To Measure Call Center Success Themes PDF
Mentioned slide outlines a comprehensive KPI dashboard used to measure the call center performance. The dashboard monitors the status of key metrics such as call abandonment levels, current service level, average call length, total calls attended, calls waiting etc. Showcasing this set of slides titled Metrics Dashboard To Measure Call Center Success Themes PDF. The topics addressed in these templates are Center Success, Call Center Status, Call Monitor. All the content presented in this PPT design is completely editable. Download it and make adjustments in color, background, font etc. as per your unique business setting.

Business Survey Analysis Dashboard Based On Demographics Data Microsoft PDF
The purpose of this template is to explain the analysis of business survey conduct based on demographics. The slide provides information about support team, respondents and product preference. Pitch your topic with ease and precision using this Business Survey Analysis Dashboard Based On Demographics Data Microsoft PDF. This layout presents information on Support, Team Performance, Product Preference It is also available for immediate download and adjustment. So, changes can be made in the color, design, graphics or any other component to create a unique layout.

Financial Analysis Vector Bar Graph With Magnifying Glass Ppt PowerPoint Presentation Gallery Design Ideas
This is a financial analysis vector bar graph with magnifying glass ppt powerpoint presentation gallery design ideas. This is a four stage process. The stages in this process are marketing analytics, marketing performance, marketing discovery.

 Home
Home