Financial Performance Dashboard
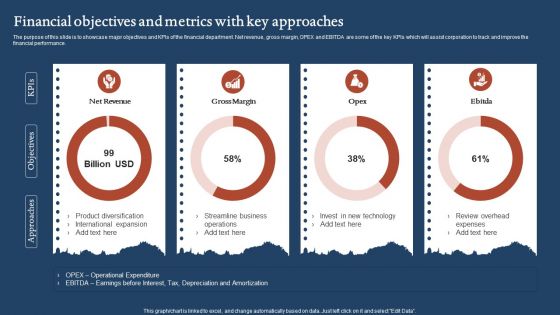
Financial Objectives And Metrics With Key Approaches Portrait PDF
The purpose of this slide is to showcase major objectives and KPIs of the financial department. Net revenue, gross margin, OPEX and EBITDA are some of the key KPIs which will assist corporation to track and improve the financial performance. Showcasing this set of slides titled Financial Objectives And Metrics With Key Approaches Portrait PDF. The topics addressed in these templates are Net Revenue, Gross Margin, Streamline Business. All the content presented in this PPT design is completely editable. Download it and make adjustments in color, background, font etc. as per your unique business setting.

Bioprocessing Company Venture Capitalist Presentation Addressing Financial Projections Infographics PDF
This slide caters details about financial projections of biotech platform in terms of total test performed, total revenues, total royalties, along with financial assumptions.Deliver and pitch your topic in the best possible manner with this bioprocessing company venture capitalist presentation addressing financial projections infographics pdf Use them to share invaluable insights on addressing financial projections of biotech platform and impress your audience. This template can be altered and modified as per your expectations. So, grab it now.

How To Digitally Transform Financial Operations Designs PDF
The following slide showcases transformation of business in financial terms which focuses on eliminating any processing errors. It presents information related to internal an external data in planning and analysis. Showcasing this set of slides titled How To Digitally Transform Financial Operations Designs PDF. The topics addressed in these templates are External Data, Social Media, Enterprise Performance. All the content presented in this PPT design is completely editable. Download it and make adjustments in color, background, font etc. as per your unique business setting.
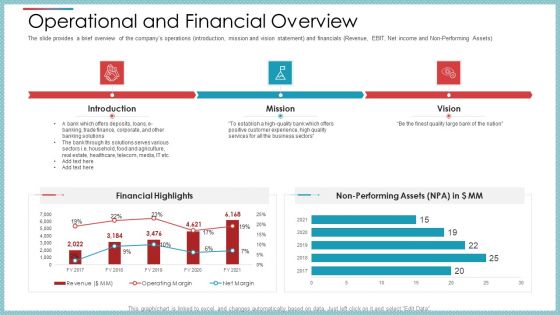
Operational And Financial Overview Ppt Infographic Template Graphics PDF
The slide provides a brief overview of the companys operations introduction, mission and vision statement and financials Revenue, EBIT, Net income and Non-Performing Assets.Deliver an awe-inspiring pitch with this creative operational and financial overview ppt infographic template graphics pdf. bundle. Topics like financial highlights, 2017 to 201 can be discussed with this completely editable template. It is available for immediate download depending on the needs and requirements of the user.
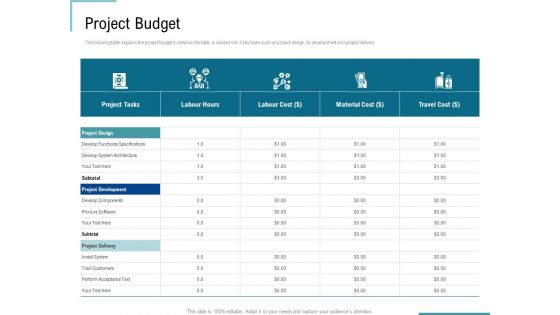
Corporate Execution And Financial Liability Report Project Budget Portrait PDF
Presenting this set of slides with name corporate execution and financial liability report project budget portrait pdf. The topics discussed in these slides are develop, cost, perform, acceptance. This is a completely editable PowerPoint presentation and is available for immediate download. Download now and impress your audience.

Financial PAR Project Budget Ppt Infographics Ideas PDF
Deliver and pitch your topic in the best possible manner with this financial par project budget ppt infographics ideas pdf. Use them to share invaluable insights on develop, cost, perform, acceptance and impress your audience. This template can be altered and modified as per your expectations. So, grab it now.
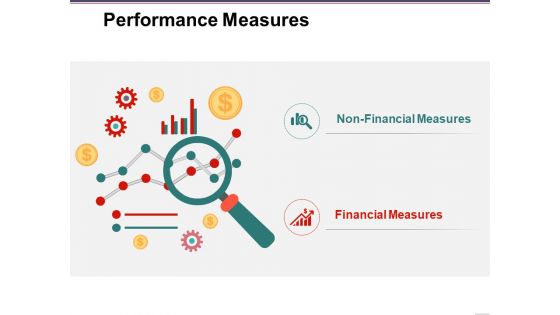
Performance Measures Ppt PowerPoint Presentation Layouts Clipart Images
This is a performance measures ppt powerpoint presentation layouts clipart images. This is a two stage process. The stages in this process are non financial measures, financial measures, business, icons, marketing.
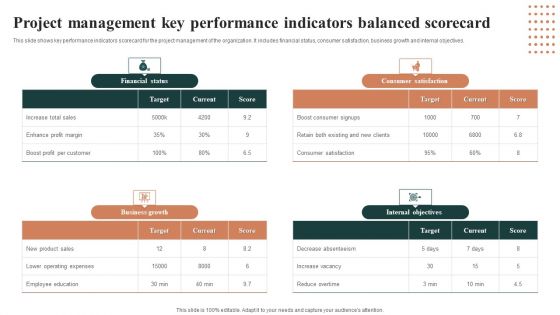
Project Management Key Performance Indicators Balanced Scorecard Introduction PDF
This slide shows key performance indicators scorecard for the project management of the organization. It includes financial status, consumer satisfaction, business growth and internal objectives. Pitch your topic with ease and precision using this Project Management Key Performance Indicators Balanced Scorecard Introduction PDF. This layout presents information on Financial Status, Business Growth, Consumer Satisfaction. It is also available for immediate download and adjustment. So, changes can be made in the color, design, graphics or any other component to create a unique layout.
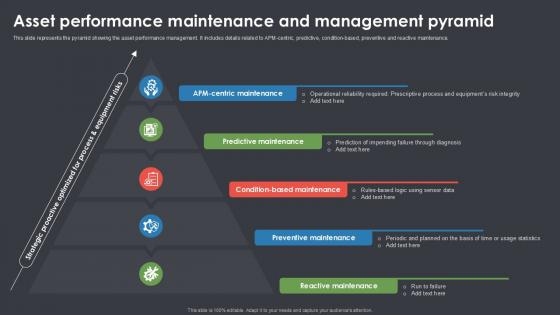
Asset Performance Maintenance And Management Pyramid Ppt Slide SS
This slide showcases dashboard for efficient cash management by power bi tool. The purpose of this slide is to maximize liquidity and minimize the cost of expenditures to ensure solvency. It provides companies with a window to analyze their financial position and improve overall profitability by scaling various problem areas. Boost your pitch with our creative Asset Performance Maintenance And Management Pyramid Ppt Slide SS. Deliver an awe-inspiring pitch that will mesmerize everyone. Using these presentation templates you will surely catch everyones attention. You can browse the ppts collection on our website. We have researchers who are experts at creating the right content for the templates. So you do not have to invest time in any additional work. Just grab the template now and use them.
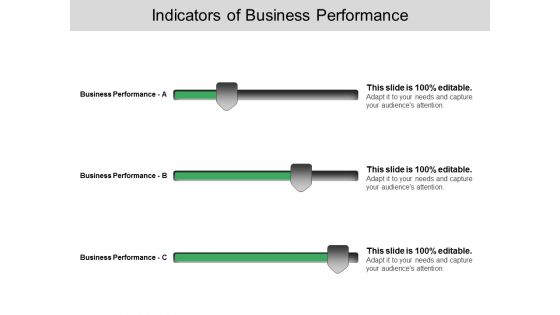
Indicators Of Busines Performance Ppt PowerPoint Presentation Infographics Influencers
This is a indicators of busines performance ppt powerpoint presentation infographics influencers. This is a three stage process. The stages in this process are cost reduction strategies.

Sales Kpi Performance Summary Ppt PowerPoint Presentation Infographic Template Elements
This is a sales kpi performance summary ppt powerpoint presentation infographic template elements. This is a seven stage process. The stages in this process are revenue comparison, quantity comparison, product sales mix, regional sales mix, budget.
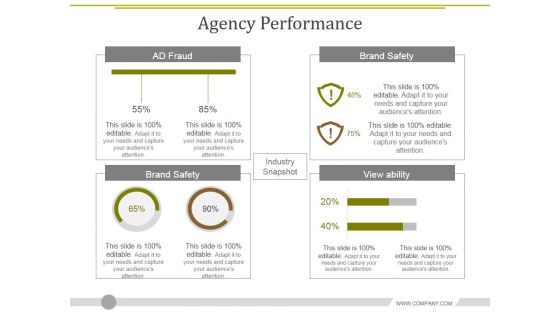
Agency Performance Template 2 Ppt PowerPoint Presentation Infographic Template Aids
This is a agency performance template 2 ppt powerpoint presentation infographic template aids. This is a four stage process. The stages in this process are brand safety, brand safety, view ability, ad fraud.

Corporate Performance Pyramid Showing Internal And External Efficiency Ppt Template SS
This slide highlights dashboard for evaluating financial performance using power bi tool. The purpose of this template is to provide managers with an efficient tool for comparing profit metrics across the quarters. It allows users to select different quarters and estimate sales of various products. Present like a pro with Corporate Performance Pyramid Showing Internal And External Efficiency Ppt Template SS Create beautiful presentations together with your team, using our easy-to-use presentation slides. Share your ideas in real-time and make changes on the fly by downloading our templates. So whether you are in the office, on the go, or in a remote location, you can stay in sync with your team and present your ideas with confidence. With Slidegeeks presentation got a whole lot easier. Grab these presentations today.
Key Financial Ratios Template 2 Ppt PowerPoint Presentation Icon Slide Download
This is a key financial ratios template 2 ppt powerpoint presentation icon slide download. This is a six stage process. The stages in this process are price to earnings, debt to equity ratio, current ratio, return on, equity, return on , assets, return on investment.
Viable Logistics Network Management Performance Measures Background PDF
This is a viable logistics network management non financial measures introduction pdf template with various stages. Focus and dispense information on two stages using this creative set, that comes with editable features. It contains large content boxes to add your information on topics like performance measures. You can also showcase facts, figures, and other relevant content using this PPT layout. Grab it now.

Online Promotion Performance And Impacts One Pager Documents
This one page covers results for website performance ,online marketing efforts and social media impacts in marketing for financial year. Presenting you an exemplary Online Promotion Performance And Impacts One Pager Documents. Our one-pager comprises all the must-have essentials of an inclusive document. You can edit it with ease, as its layout is completely editable. With such freedom, you can tweak its design and other elements to your requirements. Download this Online Promotion Performance And Impacts One Pager Documents brilliant piece now.
Impact Of Customer Churn On Organization Performance Icons PDF
Mentioned slide outlines the impact of a higher attrition rate on the companys financial performance. It contains information about major financial key performance indicators KPIs such as monthly recurring revenue MRR, customer lifetime value CLV, and customer acquisition cost CAC. If you are looking for a format to display your unique thoughts, then the professionally designed Impact Of Customer Churn On Organization Performance Icons PDF is the one for you. You can use it as a Google Slides template or a PowerPoint template. Incorporate impressive visuals, symbols, images, and other charts. Modify or reorganize the text boxes as you desire. Experiment with shade schemes and font pairings. Alter, share or cooperate with other people on your work. Download Impact Of Customer Churn On Organization Performance Icons PDF and find out how to give a successful presentation. Present a perfect display to your team and make your presentation unforgettable.
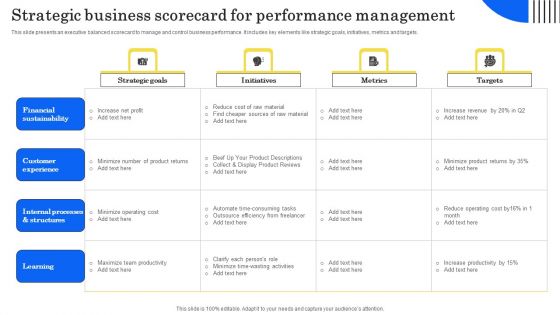
Strategic Business Scorecard For Performance Management Infographics PDF
This slide presents an executive balanced scorecard to manage and control business performance. It includes key elements like strategic goals, initiatives, metrics and targets. Showcasing this set of slides titled Strategic Business Scorecard For Performance Management Infographics PDF.Q The topics addressed in these templates are Financial Sustainability, Customer Experience, Internal Processes Structures. All the content presented in this PPT design is completely editable. Download it and make adjustments in color, background, font etc. as per your unique business setting.
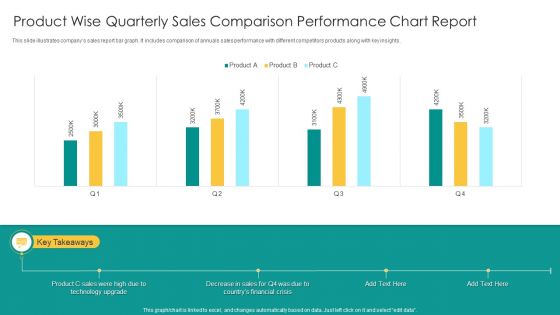
Product Wise Quarterly Sales Comparison Performance Chart Report Infographics PDF
This slide illustrates companys sales report bar graph. It includes comparison of annuals sales performance with different competitors products along with key insights. Showcasing this set of slides titled Product Wise Quarterly Sales Comparison Performance Chart Report Infographics PDF. The topics addressed in these templates are Product C Sales, Technology Upgrade, Financial Crisis. All the content presented in this PPT design is completely editable. Download it and make adjustments in color, background, font etc. as per your unique business setting.

Earned Value Management Analysis Performance Measurement Ppt Infographics Portrait PDF
This slide represents earned value management analysis performance measurement illustrating performance measure such as schedule variance and cost variance. Presenting Earned Value Management Analysis Performance Measurement Ppt Infographics Portrait PDF to dispense important information. This template comprises two stages. It also presents valuable insights into the topics including Performance Measure, Schedule Variance, Cost Variance. This is a completely customizable PowerPoint theme that can be put to use immediately. So, download it and address the topic impactfully.

Impact Of Customer Churn On Organization Performance Background PDF
Mentioned slide outlines the impact of a higher attrition rate on the companys financial performance. It contains information about major financial key performance indicators KPIs such as monthly recurring revenue MRR, customer lifetime value CLV, and customer acquisition cost CAC. Take your projects to the next level with our ultimate collection of Impact Of Customer Churn On Organization Performance Background PDF. Slidegeeks has designed a range of layouts that are perfect for representing task or activity duration, keeping track of all your deadlines at a glance. Tailor these designs to your exact needs and give them a truly corporate look with your own brand colors they will make your projects stand out from the rest.
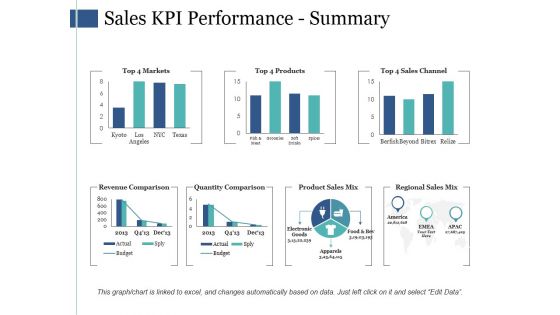
Sales Kpi Performance Summary Ppt PowerPoint Presentation Infographic Template Infographics
This is a sales kpi performance summary ppt powerpoint presentation infographic template infographics. This is a seven stage process. The stages in this process are revenue comparison, quantity comparison, product sales mix, regional sales mix.
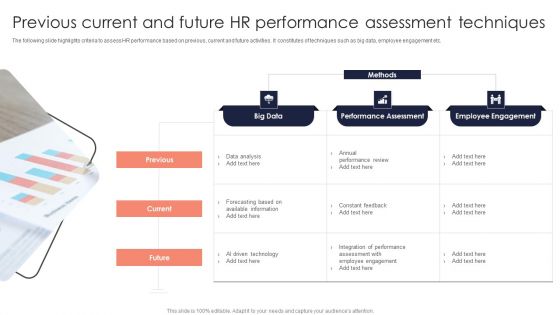
Previous Current And Future Hr Performance Assessment Techniques Brochure PDF
The following slide highlights criteria to assess HR performance based on previous, current and future activities. It constitutes of techniques such as big data, employee engagement etc. Presenting Previous Current And Future Hr Performance Assessment Techniques Brochure PDF to dispense important information. This template comprises three stages. It also presents valuable insights into the topics including Data Analysis, Information, Performance Assessment. This is a completely customizable PowerPoint theme that can be put to use immediately. So, download it and address the topic impactfully.
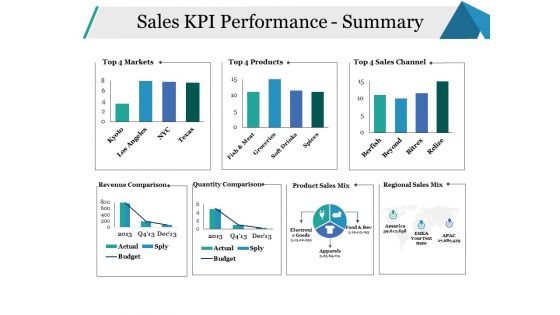
Sales KPI Performance Summary Ppt PowerPoint Presentation Infographics Model
This is a sales kpi performance summary ppt powerpoint presentation infographics model. This is a seven stage process. The stages in this process are sales channel, revenue comparison, quantity comparison, business, marketing.

Graph Showing Sales Performance Figures Ppt PowerPoint Presentation Infographics Topics
Presenting this set of slides with name graph showing sales performance figures ppt powerpoint presentation infographics topics. This is a six stage process. The stages in this process are people graph, sales performance, population data demographics. This is a completely editable PowerPoint presentation and is available for immediate download. Download now and impress your audience.

Measuring Partner Performance To Sustain Long Partner Relationship Ppt Sample
This slide presents the key performance indictors to assess the performance of partners and sustain long-term relationships. It divides KPIs into two categories strategies can d financial and also examine the solution to track and monitor and report on such KPIs. There are so many reasons you need a Measuring Partner Performance To Sustain Long Partner Relationship Ppt Sample. The first reason is you can not spend time making everything from scratch, Thus, Slidegeeks has made presentation templates for you too. You can easily download these templates from our website easily.

Ways To Assess Agency Performance Powerpoint Slide Deck Samples
This is a ways to assess agency performance powerpoint slide deck samples. This is a four stage process. The stages in this process are industry snapshot, brand safety, ad fraud, viewability, tra score.
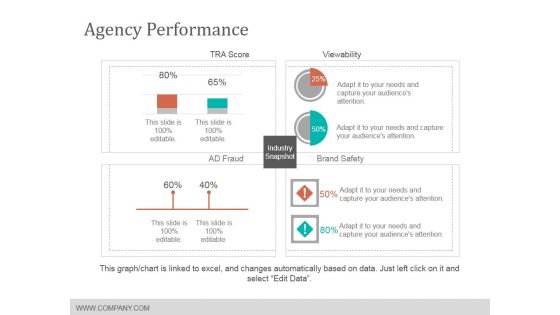
Agency Performance Template 2 Ppt Powerpoint Presentation Slides Designs
This is a agency performance template 2 ppt powerpoint presentation slides designs. This is a four stage process. The stages in this process are tra score, viewability, brand safety, industry snapshot.
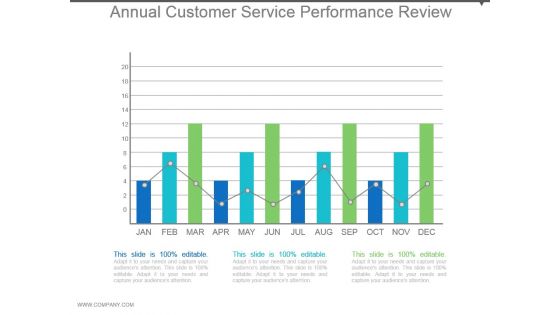
Annual Customer Service Performance Review Example Of Ppt
This is a annual customer service performance review example of ppt. This is a twelve stage process. The stages in this process are bar graph, growth, data, customer, success.
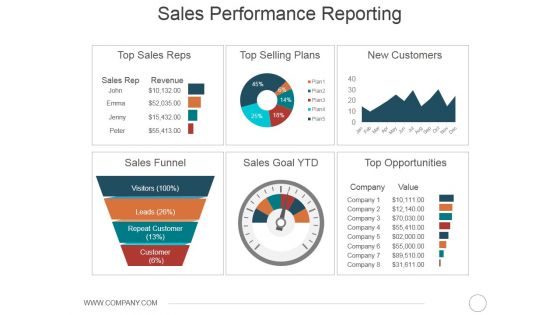
Sales Performance Reporting Ppt PowerPoint Presentation Layouts Inspiration
This is a sales performance reporting ppt powerpoint presentation layouts inspiration. This is a six stage process. The stages in this process are top sales reps, top selling plans, new customers, sales funnel, sales goal ytd, top opportunities.
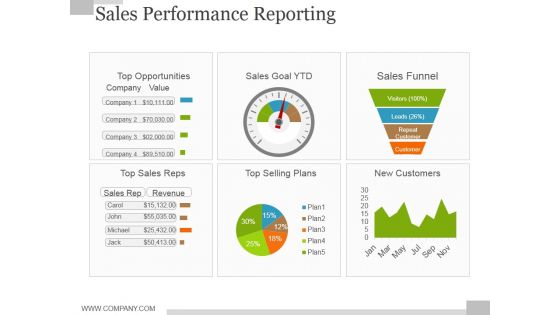
Sales Performance Reporting Ppt PowerPoint Presentation Outline Diagrams
This is a sales performance reporting ppt powerpoint presentation outline diagrams. This is a six stage process. The stages in this process are sales funnel, new customers, top selling plans, top sales reps, top opportunities.

Sales Performance Reporting Ppt PowerPoint Presentation Styles Files
This is a sales performance reporting ppt powerpoint presentation styles files. This is a six stage process. The stages in this process are top sales reps, top selling plans, new customers, sales funnel, top opportunities, sales goal ytd.

Performance Overview Ppt PowerPoint Presentation Infographic Template Slide
This is a performance overview ppt powerpoint presentation infographic template slide. This is a four stage process. The stages in this process are social engagement, website review, local mobile strategy, local reach.

Various Kpis Included In Performance Sales Report Graphics PDF
The slide covers the key performance indicators of a report to measure product sales. Various KPIs included are conversion rate, referrals and customer lifetime value. Persuade your audience using this Various Kpis Included In Performance Sales Report Graphics PDF. This PPT design covers three stages, thus making it a great tool to use. It also caters to a variety of topics including Conversion Rate, Referrals, Customer Lifetime Value. Download this PPT design now to present a convincing pitch that not only emphasizes the topic but also showcases your presentation skills.

Weekly Schedule Performance Report With Key Parameters Portrait PDF
This slide contains the information on the project with the weekly performance report schedule and the key parameters to be taken care of to tract the progress to avoid delays. Presenting Weekly Schedule Performance Report With Key Parameters Portrait PDF to dispense important information. This template comprises one stages. It also presents valuable insights into the topics including Project Status Report, Project Key Parameter, Project Schedule. This is a completely customizable PowerPoint theme that can be put to use immediately. So, download it and address the topic impactfully.
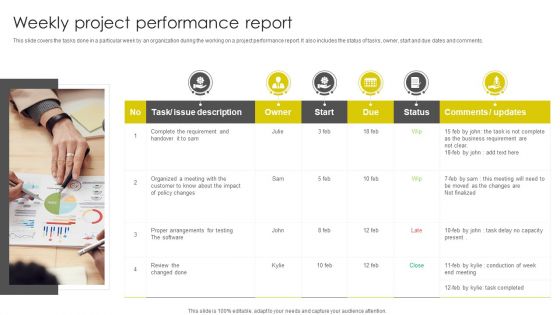
Weekly Project Performance Report Ppt Inspiration Ideas PDF
This slide covers the tasks done in a particular week by an organization during the working on a project performance report. It also includes the status of tasks, owner, start and due dates and comments. Persuade your audience using this Weekly Project Performance Report Ppt Inspiration Ideas PDF. This PPT design covers six stages, thus making it a great tool to use. It also caters to a variety of topics including Organized Meeting, Proper Arrangements, Testing Software. Download this PPT design now to present a convincing pitch that not only emphasizes the topic but also showcases your presentation skills.

Personnel Performance Kpis Scorecard To Identify Improvement Areas Diagrams PDF
Persuade your audience using this Personnel Performance Kpis Scorecard To Identify Improvement Areas Diagrams PDF. This PPT design covers five stages, thus making it a great tool to use. It also caters to a variety of topics including Employee Skills, Communication Skills, Leadership Skills. Download this PPT design now to present a convincing pitch that not only emphasizes the topic but also showcases your presentation skills.
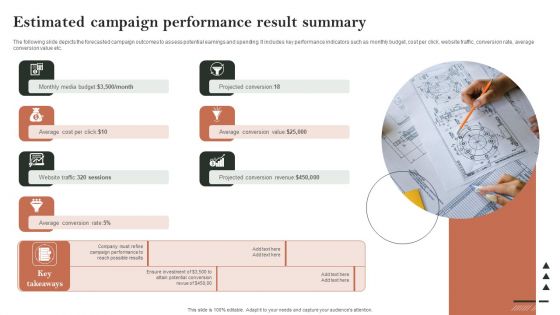
Search Engine Marketing Estimated Campaign Performance Result Summary Designs PDF
The following slide depicts the forecasted campaign outcomes to assess potential earnings and spending. It includes key performance indicators such as monthly budget, cost per click, website traffic, conversion rate, average conversion value etc. Do you know about Slidesgeeks Search Engine Marketing Estimated Campaign Performance Result Summary Designs PDF These are perfect for delivering any kind od presentation. Using it, create PowerPoint presentations that communicate your ideas and engage audiences. Save time and effort by using our pre-designed presentation templates that are perfect for a wide range of topic. Our vast selection of designs covers a range of styles, from creative to business, and are all highly customizable and easy to edit. Download as a PowerPoint template or use them as Google Slides themes.

Importance Of Wallet Share Performance Ppt Infographic Template Example File
The purpose of this slide is to provide information regarding the significance of wallet share for firms wellness. This is a importance of wallet share performance ppt infographic template example file template with various stages. Focus and dispense information on four stages using this creative set, that comes with editable features. It contains large content boxes to add your information on topics like concrete measure, customers spending, aids businesses, more profit, product and services. You can also showcase facts, figures, and other relevant content using this PPT layout. Grab it now.
Sales Order Processing Performance Tracking Indicators Graphics PDF
The following slide showcases key performance indicators for sales order fulfilment to meet customer expectations, specifications, deliver goods on time, compare order fulfilment against past orders. It includes elements such as category, key performance indicators, expected rate and actual rate. Showcasing this set of slides titled Sales Order Processing Performance Tracking Indicators Graphics PDF. The topics addressed in these templates are Customer Metrics, Inbound Metrics, Financial Metrics. All the content presented in this PPT design is completely editable. Download it and make adjustments in color, background, font etc. as per your unique business setting.

SMS Marketing Performance Analytics Report SMS Promotional Tactics Structure PDF
This slide represents the dashboard to track and monitor the overall performance of SMS marketing campaign and its impact on business sales and revenues. It includes details related to top automated flows, attributed revenue etc. From laying roadmaps to briefing everything in detail, our templates are perfect for you. You can set the stage with your presentation slides. All you have to do is download these easy-to-edit and customizable templates. SMS Marketing Performance Analytics Report SMS Promotional Tactics Structure PDF will help you deliver an outstanding performance that everyone would remember and praise you for. Do download this presentation today.
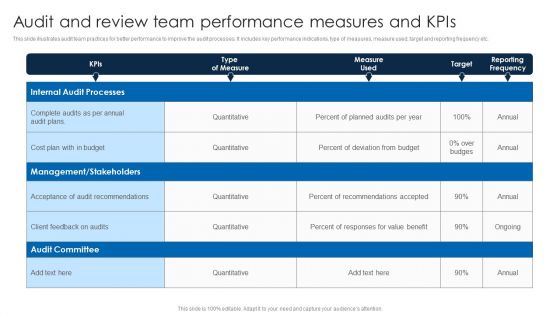
Audit And Review Team Performance Measures And Kpis Portrait PDF
This slide illustrates audit team practices for better performance to improve the audit processes. It includes key performance indications, type of measures, measure used, target and reporting frequency etc.Pitch your topic with ease and precision using this Audit And Review Team Performance Measures And Kpis Portrait PDF. This layout presents information on Business Operations, Financial Management, Environment Changes. It is also available for immediate download and adjustment. So, changes can be made in the color, design, graphics or any other component to create a unique layout.
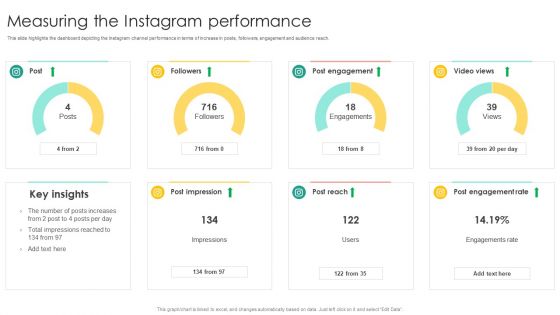
Media Advertising Measuring The Instagram Performance Brochure PDF
This slide highlights the dashboard depicting the Instagram channel performance in terms of increase in posts, followers, engagement and audience reach. Make sure to capture your audiences attention in your business displays with our gratis customizable Media Advertising Measuring The Instagram Performance Brochure PDF. These are great for business strategies, office conferences, capital raising or task suggestions. If you desire to acquire more customers for your tech business and ensure they stay satisfied, create your own sales presentation with these plain slides.
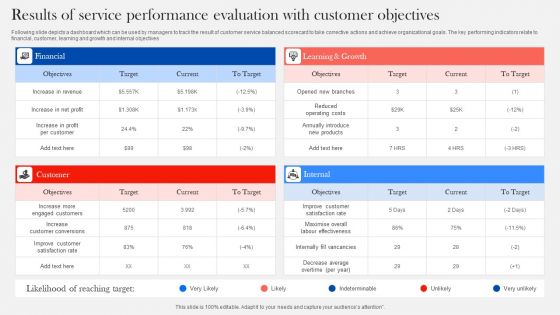
Results Of Service Performance Evaluation With Customer Objectives Diagrams PDF
Following slide depicts a dashboard which can be used by managers to track the result of customer service balanced scorecard to take corrective actions and achieve organizational goals. The key performing indicators relate to financial, customer, learning and growth and internal objectives. Showcasing this set of slides titled Results Of Service Performance Evaluation With Customer Objectives Diagrams PDF. The topics addressed in these templates are Financial, Customer, Internal. All the content presented in this PPT design is completely editable. Download it and make adjustments in color, background, font etc. as per your unique business setting.

Year Over Year Operations Performance Ppt Infographic Template Shapes PDF
Following slide compares operations performance of the company in financial years 2018 and 2019. It covers production volume, sales revenues, number of active manufacturing plant status and most common defects.Deliver and pitch your topic in the best possible manner with this year over year operations performance ppt infographic template shapes pdf. Use them to share invaluable insights on most common defects, most common defects, active manufacturing plants, production volume and impress your audience. This template can be altered and modified as per your expectations. So, grab it now.

Yearly Sales Assessment With Key Performance Indicator Matrix Introduction PDF
This slide covers quarterly product units sold through out a financial year in an organization with growth in revenue, profit and number of customer from previous years sales. It includes product sold and growth rate. Presenting Yearly Sales Assessment With Key Performance Indicator Matrix Introduction PDF to dispense important information. This template comprises four stages. It also presents valuable insights into the topics including Sold Growth Rate, Customers, Growth In Profit. This is a completely customizable PowerPoint theme that can be put to use immediately. So, download it and address the topic impactfully.
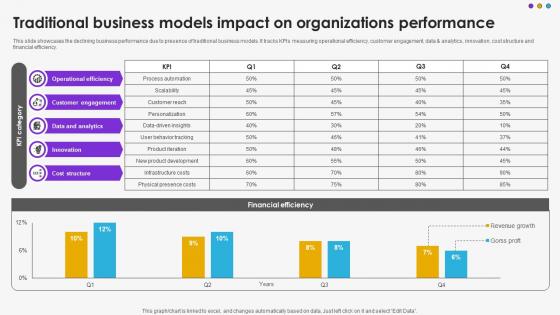
Traditional Business Models Impact On Organizations Performance DT SS V
This slide showcases the declining business performance due to presence of traditional business models. It tracks KPIs measuring operational efficiency, customer engagement, data and analytics, innovation, cost structure and financial efficiency.Do you have an important presentation coming up Are you looking for something that will make your presentation stand out from the rest Look no further than Traditional Business Models Impact On Organizations Performance DT SS V. With our professional designs, you can trust that your presentation will pop and make delivering it a smooth process. And with Slidegeeks, you can trust that your presentation will be unique and memorable. So why wait Grab Traditional Business Models Impact On Organizations Performance DT SS V today and make your presentation stand out from the rest

Cloud Cryptography Performance Cloud Data Security Using Cryptography Sample Pdf
This slide represents the dashboard which can be utilized by organization to monitor cryptographic cloud security. It includes overall progress, number of critical risks identified, initiatives, incident management, compliance, etc. Make sure to capture your audiences attention in your business displays with our gratis customizable Cloud Cryptography Performance Cloud Data Security Using Cryptography Sample Pdf. These are great for business strategies, office conferences, capital raising or task suggestions. If you desire to acquire more customers for your tech business and ensure they stay satisfied, create your own sales presentation with these plain slides.
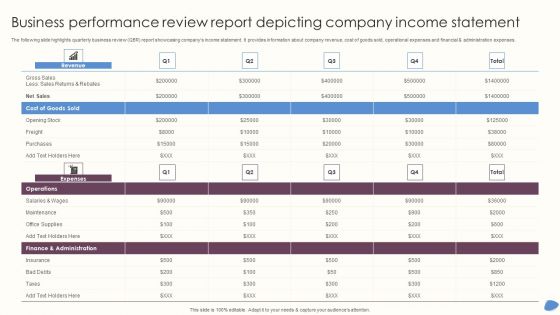
Business Performance Review Report Depicting Company Income Statement Infographics PDF
The following slide highlights quarterly business review QBR report showcasing companys income statement. It provides information about company revenue, cost of goods sold, operational expenses and financial and administration expenses. Showcasing this set of slides titled Business Performance Review Report Depicting Company Income Statement Infographics PDF. The topics addressed in these templates are Revenue, Cost Goods Sold, Operations. All the content presented in this PPT design is completely editable. Download it and make adjustments in color, background, font etc. as per your unique business setting.
Developing Significant Business Product And Customer Performance Tracking Clipart PDF
This slide provides information regarding dashboard utilized by firm to monitor performance of products offered and customer associated. The performance is tracked through revenues generated, new customer acquired, customer satisfaction, sales comparison, etc. Deliver and pitch your topic in the best possible manner with this Developing Significant Business Product And Customer Performance Tracking Clipart PDF. Use them to share invaluable insights on Revenue, New Customer, Revenue and impress your audience. This template can be altered and modified as per your expectations. So, grab it now.

Ecommerce Website Performance Evaluation And Deployment Of Enhanced Elements Pdf
This slide represents the dashboard to analyze and monitor the performance of ecommerce website. It includes key metrics such as transactions, revenue, users and sessions, ecommerce rate, revenue by channels etc. If you are looking for a format to display your unique thoughts, then the professionally designed Ecommerce Website Performance Evaluation And Deployment Of Enhanced Elements Pdf is the one for you. You can use it as a Google Slides template or a PowerPoint template. Incorporate impressive visuals, symbols, images, and other charts. Modify or reorganize the text boxes as you desire. Experiment with shade schemes and font pairings. Alter, share or cooperate with other people on your work. Download Ecommerce Website Performance Evaluation And Deployment Of Enhanced Elements Pdf and find out how to give a successful presentation. Present a perfect display to your team and make your presentation unforgettable.
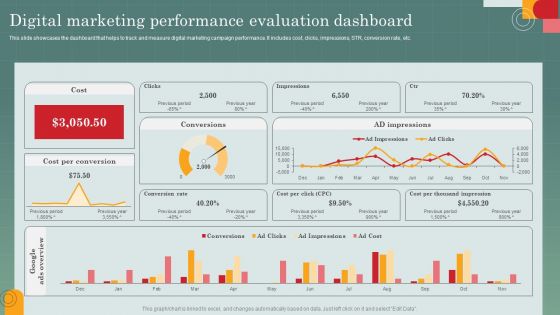
Advertising Programs Management Techniques Digital Marketing Performance Evaluation Slides PDF
This slide showcases the dashboard that helps to track and measure digital marketing campaign performance. It includes cost, clicks, impressions, STR, conversion rate, etc. Make sure to capture your audiences attention in your business displays with our gratis customizable Advertising Programs Management Techniques Digital Marketing Performance Evaluation Slides PDF. These are great for business strategies, office conferences, capital raising or task suggestions. If you desire to acquire more customers for your tech business and ensure they stay satisfied, create your own sales presentation with these plain slides.

Impact Of Workflow Automation On Overall Organization Performance Infographics PDF
This slide showcases the overall impact of workflow automation on business performance. It covers the impact of automation on production process, internal process, financial impact and impact on customer service. Do you have to make sure that everyone on your team knows about any specific topic I yes, then you should give Impact Of Workflow Automation On Overall Organization Performance Infographics PDF a try. Our experts have put a lot of knowledge and effort into creating this impeccable Impact Of Workflow Automation On Overall Organization Performance Infographics PDF. You can use this template for your upcoming presentations, as the slides are perfect to represent even the tiniest detail. You can download these templates from the Slidegeeks website and these are easy to edit. So grab these today.
Implementing Effective Strategy Product And Customer Performance Tracking Sample PDF
This slide provides information regarding dashboard utilized by firm to monitor performance of products offered and customer associated. The performance is tracked through revenues generated, new customer acquired, customer satisfaction, sales comparison, etc. This Implementing Effective Strategy Product And Customer Performance Tracking Sample PDF from Slidegeeks makes it easy to present information on your topic with precision. It provides customization options, so you can make changes to the colors, design, graphics, or any other component to create a unique layout. It is also available for immediate download, so you can begin using it right away. Slidegeeks has done good research to ensure that you have everything you need to make your presentation stand out. Make a name out there for a brilliant performance.

Commodity Line Expansion Product Line Market Performance Assessment Download PDF
This slide showcases market analysis KPI dashboard for checking performance of product line items. It provides details about product revenue, revenue breakdown, time to market, existing products, etc. Explore a selection of the finest Commodity Line Expansion Product Line Market Performance Assessment Download PDF here. With a plethora of professionally designed and pre-made slide templates, you can quickly and easily find the right one for your upcoming presentation. You can use our Commodity Line Expansion Product Line Market Performance Assessment Download PDF to effectively convey your message to a wider audience. Slidegeeks has done a lot of research before preparing these presentation templates. The content can be personalized and the slides are highly editable. Grab templates today from Slidegeeks.

sales performance by product ppt powerpoint presentation infographic template infographic template
Presenting this set of slides with name sales performance by product ppt powerpoint presentation infographic template infographic template. The topics discussed in these slides are finance, marketing, management, investment, analysis. This is a completely editable PowerPoint presentation and is available for immediate download. Download now and impress your audience.
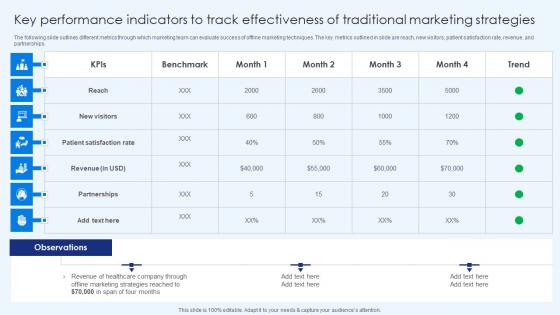
Key Performance Indicators To Track Effectivenes Healthcare Promotion Infographics Pdf
The following slide outlines different metrics through which marketing team can evaluate success of offline marketing techniques. The key metrics outlined in slide are reach, new visitors, patient satisfaction rate, revenue, and partnerships. The Key Performance Indicators To Track Effectivenes Healthcare Promotion Infographics Pdf is a compilation of the most recent design trends as a series of slides. It is suitable for any subject or industry presentation, containing attractive visuals and photo spots for businesses to clearly express their messages. This template contains a variety of slides for the user to input data, such as structures to contrast two elements, bullet points, and slides for written information. Slidegeeks is prepared to create an impression.
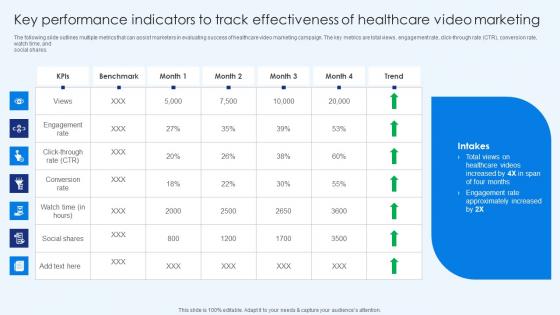
Healthcare Promotion Key Performance Indicators To Track Effectiveness Formats Pdf
The following slide outlines multiple metrics that can assist marketers in evaluating success of healthcare video marketing campaign. The key metrics are total views, engagement rate, click-through rate CTR, conversion rate, watch time, and social shares. Make sure to capture your audiences attention in your business displays with our gratis customizable Healthcare Promotion Key Performance Indicators To Track Effectiveness Formats Pdf. These are great for business strategies, office conferences, capital raising or task suggestions. If you desire to acquire more customers for your tech business and ensure they stay satisfied, create your own sales presentation with these plain slides.

HR Roles And Responsibilities Employee Performance Improvement Strategies Infographics Pdf
This slide covers roles and responsibilities of HR managers to enhance employee performance at workplace. It involves training and development, designing workplace policies, monitoring performance and rewarding and recognition. Make sure to capture your audiences attention in your business displays with our gratis customizable HR Roles And Responsibilities Employee Performance Improvement Strategies Infographics Pdf. These are great for business strategies, office conferences, capital raising or task suggestions. If you desire to acquire more customers for your tech business and ensure they stay satisfied, create your own sales presentation with these plain slides.
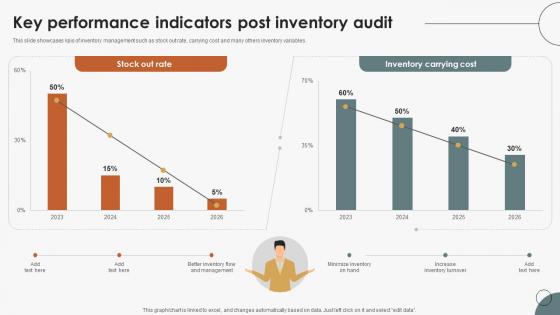
Boosting Efficiency In Inventory Key Performance Indicators Post Inventory Audit
This slide showcases kpis of inventory management such as stock out rate, carrying cost and many others inventory variables. Make sure to capture your audiences attention in your business displays with our gratis customizable Boosting Efficiency In Inventory Key Performance Indicators Post Inventory Audit. These are great for business strategies, office conferences, capital raising or task suggestions. If you desire to acquire more customers for your tech business and ensure they stay satisfied, create your own sales presentation with these plain slides.

 Home
Home