Financial Performance Dashboard

Business Review And Performance Assessment Dashboards Ppt PowerPoint Presentation Infographics Show
This is a business review and performance assessment dashboards ppt powerpoint presentation infographics show. This is a four stage process. The stages in this process are year in review, yearly highlights, countdowns.
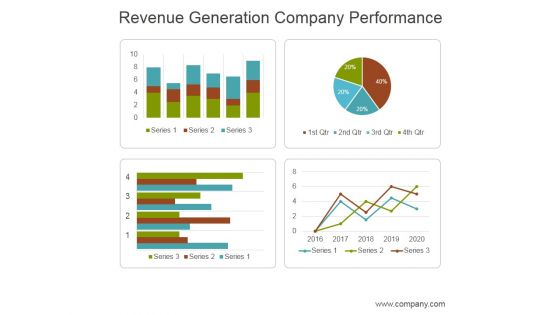
Revenue Generation Company Performance Ppt PowerPoint Presentation Layouts
This is a revenue generation company performance ppt powerpoint presentation layouts. This is a four stage process. The stages in this process are business, marketing, management, revenue, performance.
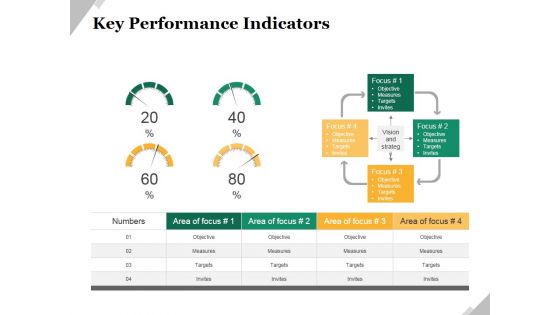
Key Performance Indicators Template 2 Ppt PowerPoint Presentation Model Example
This is a key performance indicators template 2 ppt powerpoint presentation model example. This is a four stage process. The stages in this process are objective, measures, targets, invites, indicators.

Key Performance Indicators Template 2 Ppt PowerPoint Presentation Layouts Portfolio
This is a key performance indicators template 2 ppt powerpoint presentation layouts portfolio. This is a four stage process. The stages in this process are objective, measures, targets, invites.
Website Performance Review Template 1 Ppt PowerPoint Presentation Slides Icons
This is a website performance review template 1 ppt powerpoint presentation slides icons. This is a three stage process. The stages in this process are online transaction, conversion rate, traffic source, site consumption time, organic branded.
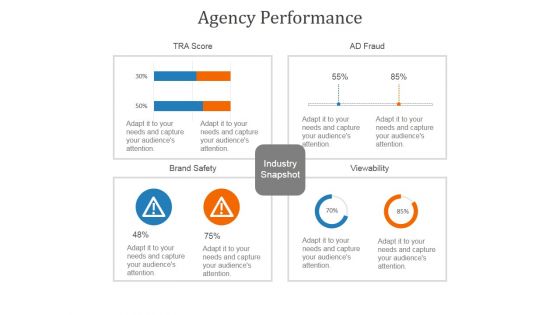
Agency Performance Template 2 Ppt PowerPoint Presentation Background Images
This is a agency performance template 2 ppt powerpoint presentation background images. This is a four stage process. The stages in this process are brand safety, viewability, industry snapshot.

Sales Performance Reporting Ppt PowerPoint Presentation Slides Background Designs
This is a sales performance reporting ppt powerpoint presentation slides background designs. This is a four stage process. The stages in this process are top selling plans, sales goal ytd, top opportunities, sales funnel.

Website Performance Review Template 2 Ppt PowerPoint Presentation Infographics Vector
This is a website performance review template 2 ppt powerpoint presentation infographics vector. This is a three stage process. The stages in this process are conversion rate, return on investment, visits, average visit value, total visits.

Email Marketing Performance Ppt PowerPoint Presentation Infographics Layout Ideas
This is a email marketing performance ppt powerpoint presentation infographics layout ideas. This is a four stage process. The stages in this process are delivery rate, open rate, click rate, conversion rate.
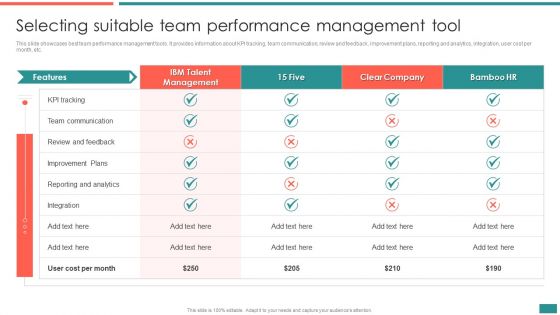
Selecting Suitable Team Performance Management Tool Building Efficient Workplace Performance Download PDF
This slide shows sales team performance management dashboard. It provides information about leads, conversion rate, average response time, revenue, team performance, etc. Make sure to capture your audiences attention in your business displays with our gratis customizable Selecting Suitable Team Performance Management Tool Building Efficient Workplace Performance Download PDF. These are great for business strategies, office conferences, capital raising or task suggestions. If you desire to acquire more customers for your tech business and ensure they stay satisfied, create your own sales presentation with these plain slides.
Tracking Performance Of Internet Marketing Using Key Performance Indicators Sample PDF
The following slide highlights key performance indicators for tracking digital advertising performance to improve website traffic and revenue. It includes KPIs such as click through rate, conversion rate, return on ad spend, clicks etc. Showcasing this set of slides titled Tracking Performance Of Internet Marketing Using Key Performance Indicators Sample PDF. The topics addressed in these templates are Key Performance Indicators, Video Completion Rate, Conversion Rate. All the content presented in this PPT design is completely editable. Download it and make adjustments in color, background, font etc. as per your unique business setting.
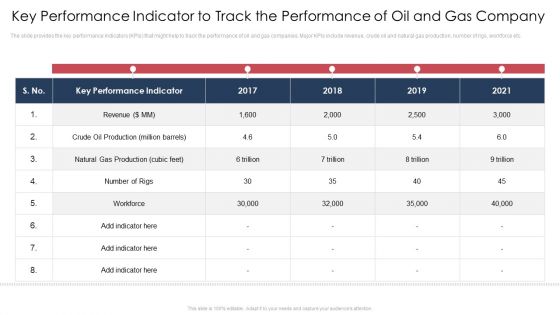
Key Performance Indicator To Track The Performance Of Oil And Gas Company Slides PDF
The slide provides the key performance indicators KPIs that might help to track the performance of oil and gas companies. Major KPIs include revenue, crude oil and natural gas production, number of rigs, workforce etc.Deliver and pitch your topic in the best possible manner with this key performance indicator to track the performance of oil and gas company slides pdf. Use them to share invaluable insights on revenue, crude oil production, natural gas production and impress your audience. This template can be altered and modified as per your expectations. So, grab it now.
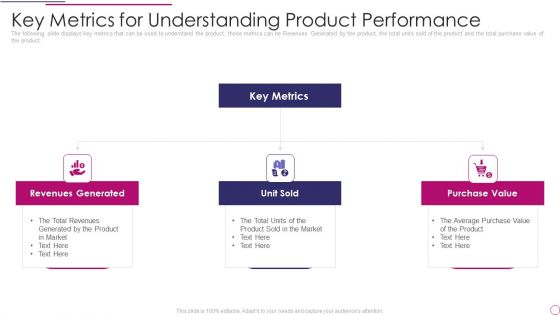
Performance Analysis Of New Product Development Key Metrics For Understanding Product Performance Themes PDF
The following slide displays key metrics that can be used to understand the product, these metrics can be Revenues Generated by the product, the total units sold of the product and the total purchase value of the product. This is a performance analysis of new product development key metrics for understanding product performance themes pdf template with various stages. Focus and dispense information on three stages using this creative set, that comes with editable features. It contains large content boxes to add your information on topics like revenues generated, unit sold, purchase value. You can also showcase facts, figures, and other relevant content using this PPT layout. Grab it now.

Business Performance Review Report To Evaluate Performance Of Sales Rep Infographics PDF
The following slide highlights quarterly business review QBR report which can be used by firm to evaluate the efficiency of sales rep. information covered in this slide is related to total sales by employees in different quarters, number of calls made. Pitch your topic with ease and precision using this Business Performance Review Report To Evaluate Performance Of Sales Rep Infographics PDF. This layout presents information on Revenue Sales, Tim Paine, Number Colds Calls. It is also available for immediate download and adjustment. So, changes can be made in the color, design, graphics or any other component to create a unique layout.

Sales Performance Reporting Ppt PowerPoint Presentation Model Summary
This is a sales performance reporting ppt powerpoint presentation model summary. This is a six stage process. The stages in this process are top selling plans, new customers, top sales reps, sales funnel, sales goal ytd, top opportunities.

Performance Overview Ppt PowerPoint Presentation Infographic Template Design Ideas
This is a Performance Overview Ppt PowerPoint Presentation Infographic Template Design Ideas. This is a four stage process. The stages in this process are Your Business, Website Review, Social Engagement, Local Mobile Strategy, Local Reach.
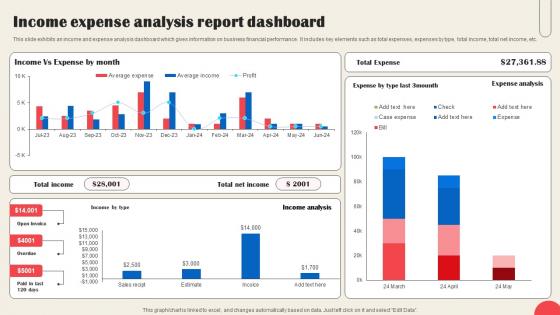
Income Expense Analysis Report Dashboard Sample Pdf
This slide exhibits an income and expense analysis dashboard which gives information on business financial performance. It includes key elements such as total expenses, expenses by type, total income, total net income, etc. Pitch your topic with ease and precision using this Income Expense Analysis Report Dashboard Sample Pdf This layout presents information on Income Expense, Analysis Report Dashboard It is also available for immediate download and adjustment. So, changes can be made in the color, design, graphics or any other component to create a unique layout.

Dashboard For Managing Warehouse Operations Diagrams PDF
This slide showcases dashboard that can help organization to manage and track the warehouse operations. Its key elements are order, volume, inventory, monthly KPIs and global financial performance. Presenting this PowerPoint presentation, titled Dashboard For Managing Warehouse Operations Diagrams PDF, with topics curated by our researchers after extensive research. This editable presentation is available for immediate download and provides attractive features when used. Download now and captivate your audience. Presenting this Dashboard For Managing Warehouse Operations Diagrams PDF. Our researchers have carefully researched and created these slides with all aspects taken into consideration. This is a completely customizable Dashboard For Managing Warehouse Operations Diagrams PDF that is available for immediate downloading. Download now and make an impact on your audience. Highlight the attractive features available with our PPTs.
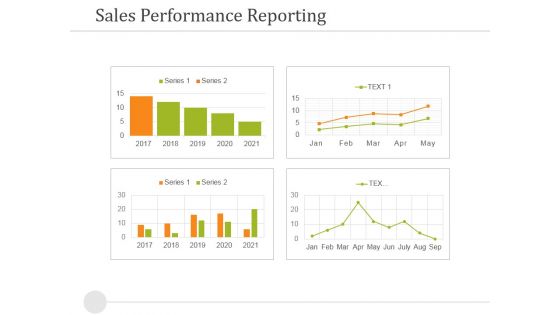
Sales Performance Reporting Ppt PowerPoint Presentation Outline Outfit
This is a sales performance reporting ppt powerpoint presentation outline outfit. This is a four stage process. The stages in this process are sales performance reporting, business, success, strategy, finance.
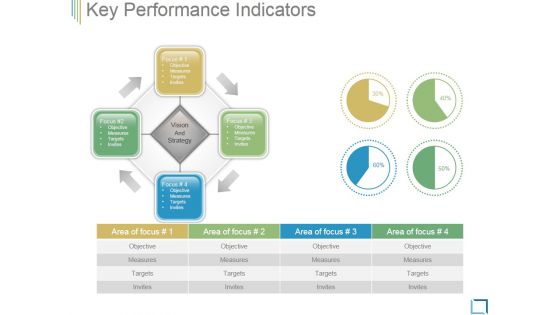
Key Performance Indicators Template 3 Ppt PowerPoint Presentation Samples
This is a key performance indicators template 3 ppt powerpoint presentation samples. This is a four stage process. The stages in this process are objective, measures, targets, invites.
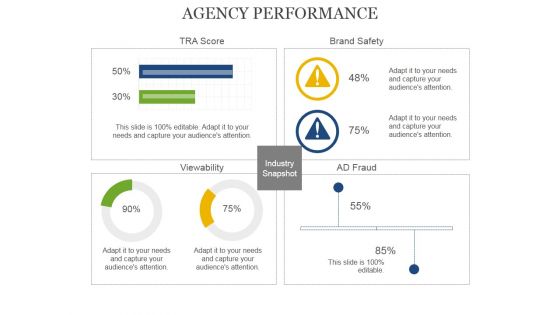
Agency Performance Template 2 Ppt PowerPoint Presentation Graphics
This is a agency performance template 2 ppt powerpoint presentation graphics. This is a four stage process. The stages in this process are view ability, ad fraud, industry snapshot, brand safety, tra score.
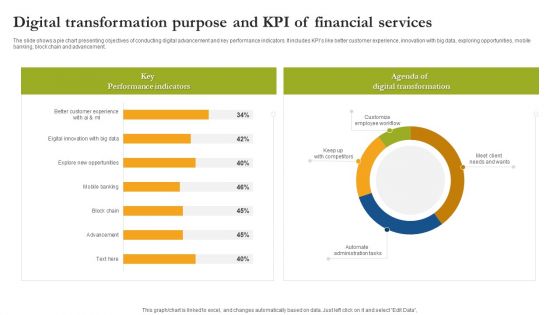
Digital Transformation Purpose And Kpi Of Financial Services Guidelines PDF
The slide shows a pie chart presenting objectives of conducting digital advancement and key performance indicators. It includes KPIs like better customer experience, innovation with big data, exploring opportunities, mobile banking, block chain and advancement. Showcasing this set of slides titled Digital Transformation Purpose And Kpi Of Financial Services Guidelines PDF. The topics addressed in these templates are Key Performance Indicators Digital Transformation, Customize Employee Workflow. All the content presented in this PPT design is completely editable. Download it and make adjustments in color, background, font etc. as per your unique business setting.

Accounting Bookkeeping Services Company Financials Dashboard Infographics PDF
Presenting this set of slides with name accounting bookkeeping services company financials dashboard infographics pdf. The topics discussed in these slides are performance, revenue, expense, profit. This is a completely editable PowerPoint presentation and is available for immediate download. Download now and impress your audience.

Magnifying Glass For Sales Performance Review Ppt PowerPoint Presentation Model
This is a magnifying glass for sales performance review ppt powerpoint presentation model. This is a four stage process. The stage in this process are magnifier glass, pie, finance, percentage, research.

Management Dashboard Templates Presentation Diagram
This is a management dashboard templates presentation diagram. This is a four stage process. The stages in this process are operational performance, business value, financial performance, infrastructure business value.

Evaluating New Commodity Impact On Market Product Performance Dashboards Template PDF
The following slide displays the dashboard which highlights the performance of the product, multiple metrics such as Revenues, New customer, gross profit, customer satisfaction and global sales breakdown Deliver and pitch your topic in the best possible manner with this Evaluating New Commodity Impact On Market Product Performance Dashboards Template PDF Use them to share invaluable insights on Brand Profitability, Customer Satisfaction, Gross Profit and impress your audience. This template can be altered and modified as per your expectations. So, grab it now.

Revenue Performance Reporting Speedometer Ppt PowerPoint Presentation Visuals
This is a revenue performance reporting speedometer ppt powerpoint presentation visuals. This is a four stage process. The stages in this process are speedometer, measurement, business, marketing, finance.
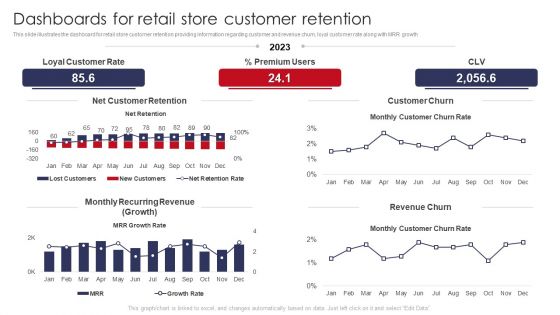
Dashboards For Retail Store Customer Retention Retail Outlet Operations Performance Evaluation Graphics PDF
This slide illustrates the dashboard for retail store customer retention providing information regarding customer and revenue churn, loyal customer rate along with MRR growth.Deliver and pitch your topic in the best possible manner with this Dashboards For Retail Store Customer Retention Retail Outlet Operations Performance Evaluation Graphics PDF. Use them to share invaluable insights on Customer Retention, Loyal Customer, Recurring Revenue and impress your audience. This template can be altered and modified as per your expectations. So, grab it now.

Dashboards For Retail Store Customer Retention Retail Outlet Performance Assessment Microsoft PDF
This slide illustrates the dashboard for retail store customer retention providing information regarding customer and revenue churn, loyal customer rate along with MRR growth. Deliver and pitch your topic in the best possible manner with this Dashboards For Retail Store Customer Retention Retail Outlet Performance Assessment Microsoft PDF. Use them to share invaluable insights on Customer Retention, Customer Churn, Recurring Revenue and impress your audience. This template can be altered and modified as per your expectations. So, grab it now.

Distribution Strategies For Increasing Dashboards To Measure Performance Of Distribution Summary PDF
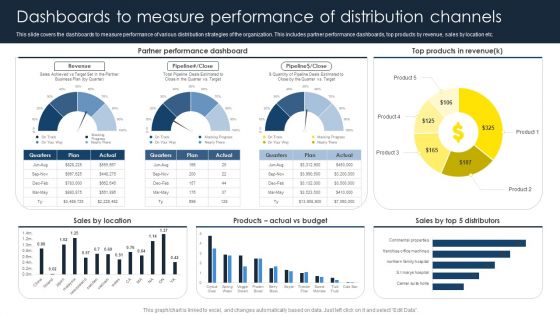
This slide covers the dashboards to measure performance of various distribution strategies of the organization. This includes partner performance dashboards, top products by revenue, sales by location etc. Want to ace your presentation in front of a live audience Our Distribution Strategies For Increasing Dashboards To Measure Performance Of Distribution Summary PDF can help you do that by engaging all the users towards you. Slidegeeks experts have put their efforts and expertise into creating these impeccable powerpoint presentations so that you can communicate your ideas clearly. Moreover, all the templates are customizable, and easy-to-edit and downloadable. Use these for both personal and commercial use.
Optimize Business Sales Dashboards To Measure Performance Of Distribution Summary PDF
This slide covers the dashboards to measure performance of various distribution strategies of the organization. This includes partner performance dashboards, top products by revenue, sales by location etc. The best PPT templates are a great way to save time, energy, and resources. Slidegeeks have 100 percent editable powerpoint slides making them incredibly versatile. With these quality presentation templates, you can create a captivating and memorable presentation by combining visually appealing slides and effectively communicating your message. Download Optimize Business Sales Dashboards To Measure Performance Of Distribution Summary PDF from Slidegeeks and deliver a wonderful presentation.

Dashboards Major KPI Key Performance Indicators Of A Railway Company Slides PDF
Deliver and pitch your topic in the best possible manner with this dashboards major kpi key performance indicators of a railway company slides pdf. Use them to share invaluable insights on revenue, employees, key performance indicators and impress your audience. This template can be altered and modified as per your expectations. So, grab it now.
Implementing Effective Distribution Dashboards To Measure Performance Of Distribution Portrait PDF
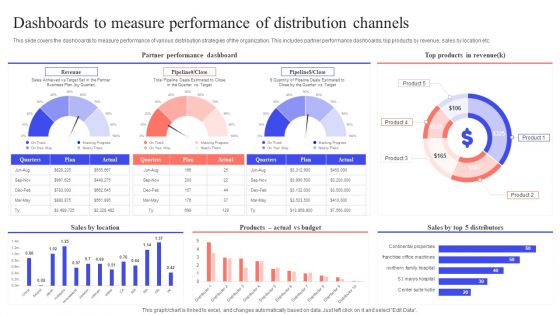
This slide covers the dashboards to measure performance of various distribution strategies of the organization. This includes partner performance dashboards, top products by revenue, sales by location etc. Crafting an eye-catching presentation has never been more straightforward. Let your presentation shine with this tasteful yet straightforward Implementing Effective Distribution Dashboards To Measure Performance Of Distribution Portrait PDF template. It offers a minimalistic and classy look that is great for making a statement. The colors have been employed intelligently to add a bit of playfulness while still remaining professional. Construct the ideal Implementing Effective Distribution Dashboards To Measure Performance Of Distribution Portrait PDF that effortlessly grabs the attention of your audience Begin now and be certain to wow your customers

Dashboards Major KPI Key Performance Indicators Of A Railway Company Formats PDF
Deliver an awe inspiring pitch with this creative dashboards major kpi key performance indicators of a railway company formats pdf bundle. Topics like revenue, employees, dashboards can be discussed with this completely editable template. It is available for immediate download depending on the needs and requirements of the user.

Maximizing Profit Returns With Right Distribution Source Dashboards To Measure Performance Of Distribution Channels Microsoft PDF
This slide covers the dashboards to measure performance of various distribution strategies of the organization. This includes partner performance dashboards, top products by revenue, sales by location etc. Slidegeeks is here to make your presentations a breeze with Maximizing Profit Returns With Right Distribution Source Dashboards To Measure Performance Of Distribution Channels Microsoft PDF With our easy-to-use and customizable templates, you can focus on delivering your ideas rather than worrying about formatting. With a variety of designs to choose from, youre sure to find one that suits your needs. And with animations and unique photos, illustrations, and fonts, you can make your presentation pop. So whether youre giving a sales pitch or presenting to the board, make sure to check out Slidegeeks first.
Omnichannel Distribution System To Satisfy Customer Needs Dashboards To Measure Performance Of Distribution Channels Brochure PDF
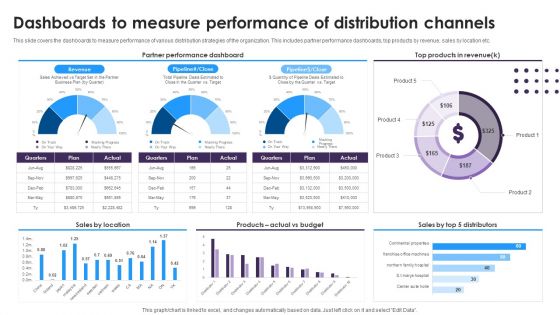
This slide covers the dashboards to measure performance of various distribution strategies of the organization. This includes partner performance dashboards, top products by revenue, sales by location etc. Present like a pro with Omnichannel Distribution System To Satisfy Customer Needs Dashboards To Measure Performance Of Distribution Channels Brochure PDF Create beautiful presentations together with your team, using our easy-to-use presentation slides. Share your ideas in real-time and make changes on the fly by downloading our templates. So whether you are in the office, on the go, or in a remote location, you can stay in sync with your team and present your ideas with confidence. With Slidegeeks presentation got a whole lot easier. Grab these presentations today.

Holistic Financial Plan For Business Ppt Powerpoint Images
This is a holistic financial plan for business ppt powerpoint images. This is a three stage process. The stages in this process are investment strategy, performance reporting and analysis, portfolio management.
Financial KPI Framework Ppt PowerPoint Presentation Gallery Show PDF
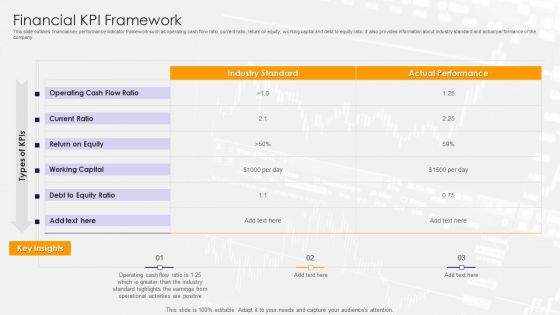
This slide outlines financial key performance indicator framework such as operating cash flow ratio, current ratio, return on equity, working capital and debt to equity ratio. It also provides information about industry standard and actual performance of the company. Showcasing this set of slides titled financial kpi framework ppt powerpoint presentation gallery show pdf. The topics addressed in these templates are current ratio, working capital, equity. All the content presented in this PPT design is completely editable. Download it and make adjustments in color, background, font etc. as per your unique business setting.

Post Implementation Other Operation And Financial Kpis Summary PDF
The slide provides five years graphs 2022F to 2026F forecasted number of major KPIs key performance indicators, that might help to track the performance of ABC Railway. Covered KPIs include Revenue, Total Passengers, operating income, customer satisfaction rate etc.Deliver and pitch your topic in the best possible manner with this post implementation other operation and financial KPIs summary pdf. Use them to share invaluable insights on total passengers, operating income, revenue, 2022 to 2026 and impress your audience. This template can be altered and modified as per your expectations. So, grab it now.
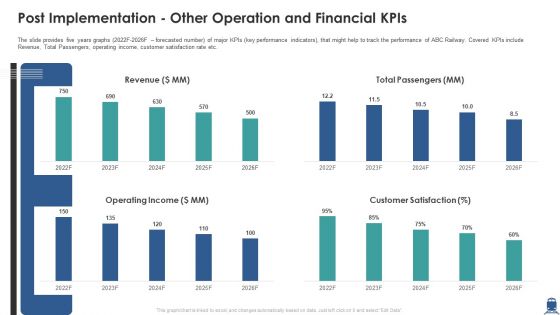
Post Implementation Other Operation And Financial Kpis Inspiration PDF
The slide provides five years graphs 2022F-2026F forecasted number of major KPIs key performance indicators, that might help to track the performance of ABC Railway. Covered KPIs include Revenue, Total Passengers, operating income, customer satisfaction rate etc. Deliver and pitch your topic in the best possible manner with this post implementation other operation and financial kpis inspiration pdf. Use them to share invaluable insights on revenue, operating income, customer satisfaction and impress your audience. This template can be altered and modified as per your expectations. So, grab it now.

Financial Projections And Key Metrics Ppt Summary Background PDF
This slide illustrates key performance indicators highlighting the financial projections of the company post product launch. KPIs covered here are revenue growth, profit margin along with customer acquisition cost. Deliver an awe inspiring pitch with this creative financial projections and key metrics ppt summary background pdf bundle. Topics like financial projections and key metrics can be discussed with this completely editable template. It is available for immediate download depending on the needs and requirements of the user.

Organisation Structure Financial Analytics Platform Investor Elevator Pitch Deck
This slide covers the organizational structure of a data intelligent company that demonstrate current expertise and operational framework. It includes roles such as founder and chief executive officer, chief people officer, head of sales, chief technology officer, etc. From laying roadmaps to briefing everything in detail, our templates are perfect for you. You can set the stage with your presentation slides. All you have to do is download these easy-to-edit and customizable templates. Organisation Structure Financial Analytics Platform Investor Elevator Pitch Deck will help you deliver an outstanding performance that everyone would remember and praise you for. Do download this presentation today.
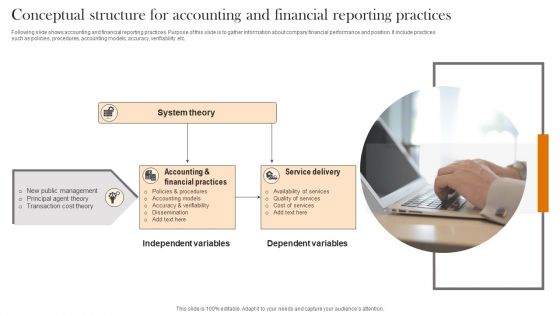
Conceptual Structure For Accounting And Financial Reporting Practices Microsoft PDF
Following slide shows accounting and financial reporting practices. Purpose of this slide is to gather information about company financial performance and position. It include practices such as policies, procedures, accounting models, accuracy, verifiability etc. Presenting Conceptual Structure For Accounting And Financial Reporting Practices Microsoft PDF to dispense important information. This template comprises one stages. It also presents valuable insights into the topics including System Theory, Accounting Financial Practices, Service Delivery . This is a completely customizable PowerPoint theme that can be put to use immediately. So, download it and address the topic impactfully.

Annual Corporate Financial Statement For Business Enterprises Designs PDF
This template consists of sample financial report to be used by business managers to report financial performance of their enterprises towards the end of accounting year. Key metrics are sales, operating expenses, operating profit, depreciation, interest, net profit etc. Showcasing this set of slides titled Annual Corporate Financial Statement For Business Enterprises Designs PDF. The topics addressed in these templates are Operating Expense, Operating Profit, Depreciation. All the content presented in this PPT design is completely editable. Download it and make adjustments in color, background, font etc. as per your unique business setting.
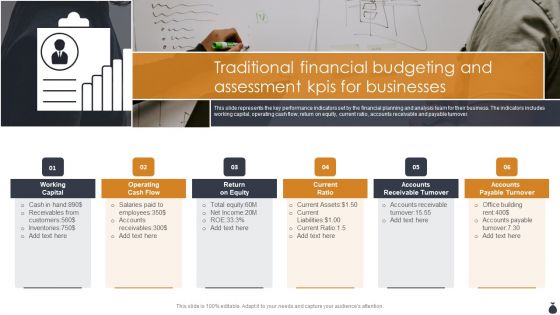
Traditional Financial Budgeting And Assessment Kpis For Businesses Infographics PDF
This slide represents the key performance indicators set by the financial planning and analysis team for their business. The indicators includes working capital, operating cash flow, return on equity, current ratio, accounts receivable and payable turnover. Presenting Traditional Financial Budgeting And Assessment Kpis For Businesses Infographics PDF to dispense important information. This template comprises six stages. It also presents valuable insights into the topics including Working Capital, Operating Cash Flow, Current Ratio. This is a completely customizable PowerPoint theme that can be put to use immediately. So, download it and address the topic impactfully.
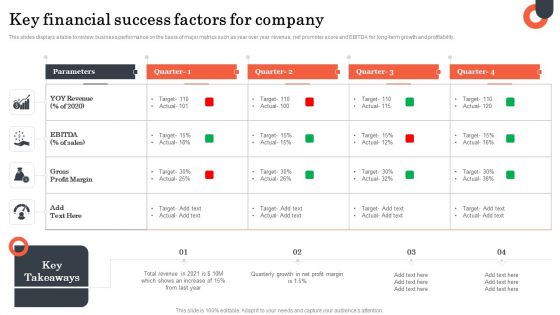
Key Financial Success Factors For Company Designs PDF
This slides displays a table to review business performance on the basis of major metrics such as year over year revenue, net promoter score and EBITDA for long-term growth and profitability. Pitch your topic with ease and precision using this Key Financial Success Factors For Company Designs PDF. This layout presents information on Key Financial Success, Factors For Company. It is also available for immediate download and adjustment. So, changes can be made in the color, design, graphics or any other component to create a unique layout.
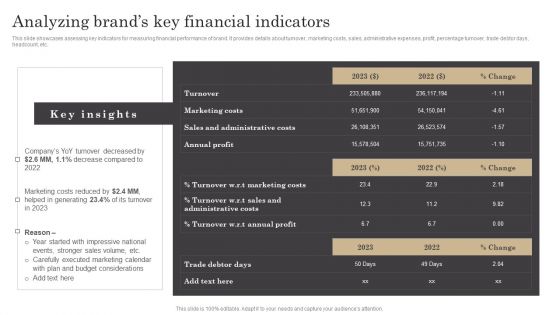
Analyzing Brands Key Financial Indicators Ppt Infographic Template Slides PDF
This slide showcases assessing key indicators for measuring financial performance of brand. It provides details about turnover, marketing costs, sales, administrative expenses, profit, percentage turnover, trade debtor days, headcount, etc. Are you in need of a template that can accommodate all of your creative concepts This one is crafted professionally and can be altered to fit any style. Use it with Google Slides or PowerPoint. Include striking photographs, symbols, depictions, and other visuals. Fill, move around, or remove text boxes as desired. Test out color palettes and font mixtures. Edit and save your work, or work with colleagues. Download Analyzing Brands Key Financial Indicators Ppt Infographic Template Slides PDF and observe how to make your presentation outstanding. Give an impeccable presentation to your group and make your presentation unforgettable.
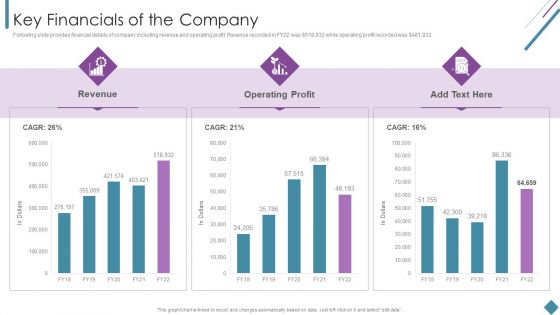
Metrics To Measure Business Performance Key Financials Of The Company Elements PDF
Following slide provides financial details of company including revenue and operating profit. Revenue recorded in FY22 was dollar 518,932 while operating profit recorded was dollar 481,932. Deliver an awe inspiring pitch with this creative Metrics To Measure Business Performance Key Financials Of The Company Elements PDF bundle. Topics like Revenue, Operating Profit can be discussed with this completely editable template. It is available for immediate download depending on the needs and requirements of the user.

Enterprise Sustainability Performance Metrics Key Financials Of The Company Rules PDF
Following slide provides financial details of company including revenue and operating profit. Revenue recorded in FY22 was dollar518,932 while operating profit recorded was dollar481,932.Deliver an awe inspiring pitch with this creative Enterprise Sustainability Performance Metrics Key Financials Of The Company Rules PDF bundle. Topics like Operating, Profit, Revenue can be discussed with this completely editable template. It is available for immediate download depending on the needs and requirements of the user.
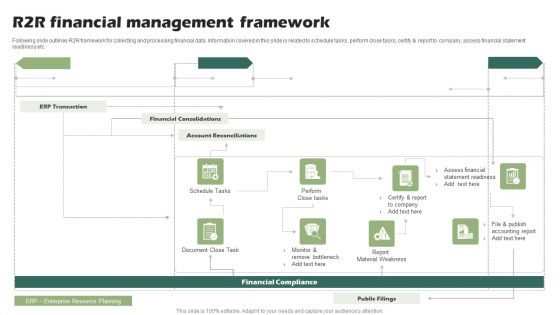
R2R Financial Management Framework Ppt PowerPoint Presentation Model Introduction PDF
Following slide outlines R2R framework for collecting and processing financial data. Information covered in this slide is related to schedule tasks, perform close tasks, certify and report to company, assess financial statement readiness etc.Pitch your topic with ease and precision using this R2R Financial Management Framework Ppt PowerPoint Presentation Model Introduction PDF. This layout presents information on Financial Consolidations, Account Reconciliations, Remove Bottleneck. It is also available for immediate download and adjustment. So, changes can be made in the color, design, graphics or any other component to create a unique layout.
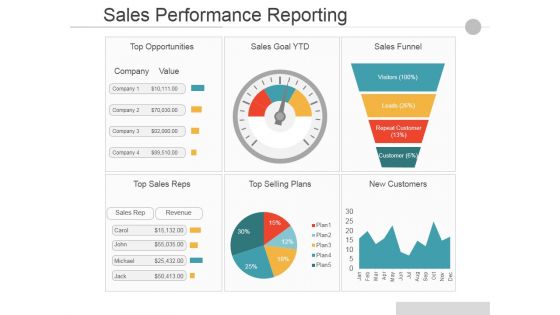
Sales Performance Reporting Ppt PowerPoint Presentation Infographics Portrait
This is a Sales Performance Reporting Ppt PowerPoint Presentation Infographics Portrait. This is a six stage process. The stages in this process are Top Opportunities, Sales Goal Ytd, Sales Funnel, Top Sales Reps, Top Selling Plans, New Customers.
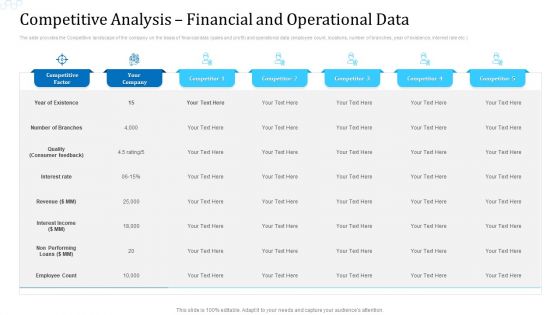
Competitive Analysis Financial And Operational Data Elements PDF
The slide provides the Competitive landscape of the company on the basis of financial data sales and profit and operational data employee count, locations, number of branches, year of existence, interest rate etc. Deliver an awe inspiring pitch with this creative competitive analysis financial and operational data elements pdf bundle. Topics like interest rate, revenue, interest income, performing can be discussed with this completely editable template. It is available for immediate download depending on the needs and requirements of the user.
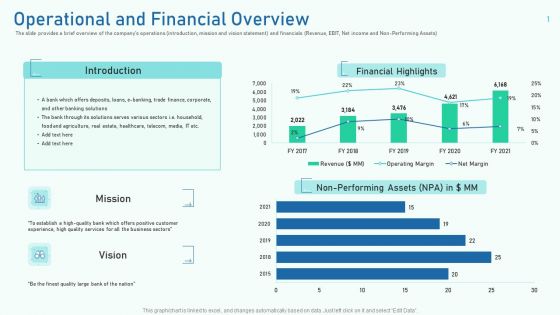
Operational And Financial Overview Ppt Infographics Designs Download PDF
The slide provides a brief overview of the companys operations introduction, mission and vision statement and financials Revenue, EBIT, Net income and Non Performing Assets.Deliver an awe-inspiring pitch with this creative operational and financial overview ppt infographics designs download pdf. bundle. Topics like financial highlights, 2017 to 2021 can be discussed with this completely editable template. It is available for immediate download depending on the needs and requirements of the user.
Competitive Analysis Financial And Operational Data Ppt Show Icons PDF
The slide provides the Competitive landscape of the company on the basis of financial data sales and profit and operational data employee count, locations, number of branches, year of existence, interest rate etc.Deliver and pitch your topic in the best possible manner with this competitive analysis financial and operational data ppt show icons pdf. Use them to share invaluable insights on revenue, interest income, non performing loans and impress your audience. This template can be altered and modified as per your expectations. So, grab it now.
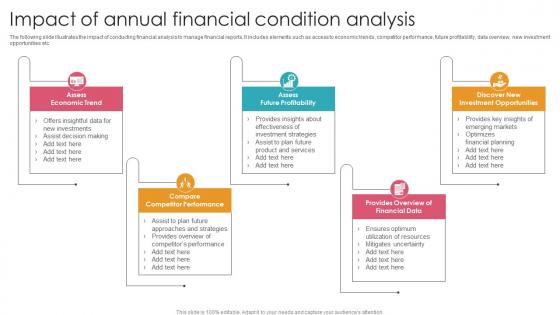
Impact Of Annual Financial Condition Analysis Template Pdf
The following slide illustrates the impact of conducting financial analysis to manage financial reports. It includes elements such as access to economic trends, competitor performance, future profitability, data overview, new investment opportunities etc. Showcasing this set of slides titled Impact Of Annual Financial Condition Analysis Template Pdf. The topics addressed in these templates are Assess Economic Trend, Assess Future Profitability, Discover Investment Opportunities. All the content presented in this PPT design is completely editable. Download it and make adjustments in color, background, font etc. as per your unique business setting.

Key Facts Financial Analytics Platform Investor Elevator Pitch Deck
This slide includes key facts about the company to monitor and assess the companys performance. It covers data related to securitization, unique page views, platforms and services added, and unique mortgage data points analyzed. There are so many reasons you need a Key Facts Financial Analytics Platform Investor Elevator Pitch Deck. The first reason is you can not spend time making everything from scratch, Thus, Slidegeeks has made presentation templates for you too. You can easily download these templates from our website easily.
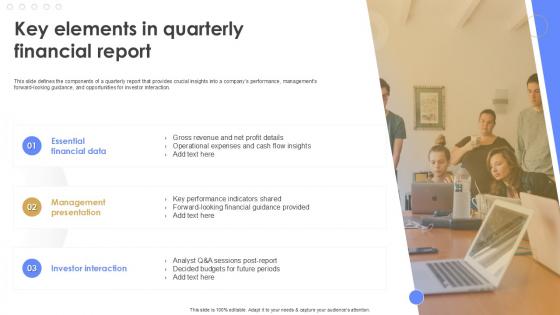
Key Elements In Quarterly Financial Report Quarterly Report Ppt Sample
This slide defines the components of a quarterly report that provides crucial insights into a companys performance, managements forward-looking guidance, and opportunities for investor interaction. Create an editable Key Elements In Quarterly Financial Report Quarterly Report Ppt Sample that communicates your idea and engages your audience. Whether you are presenting a business or an educational presentation, pre-designed presentation templates help save time. Key Elements In Quarterly Financial Report Quarterly Report Ppt Sample is highly customizable and very easy to edit, covering many different styles from creative to business presentations. Slidegeeks has creative team members who have crafted amazing templates. So, go and get them without any delay.

Stock Market Research Report Financial Ratio Analysis Ppt Layout PDF
This is a stock market research report financial ratio analysis ppt layout pdf template with various stages. Focus and dispense information on seven stages using this creative set, that comes with editable features. It contains large content boxes to add your information on topics like target company overview, income statement, balance sheet, vertical and horizontal analysis, shareholding pattern, swot analysis, historical share price performance. You can also showcase facts, figures, and other relevant content using this PPT layout. Grab it now.
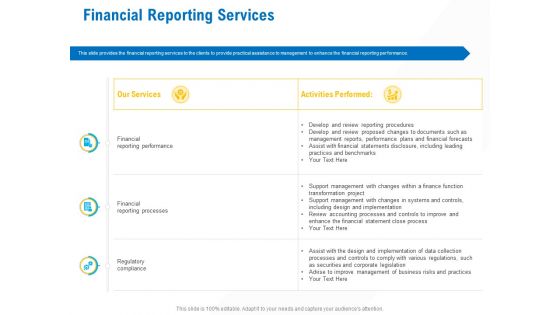
Business Service Provider Financial Reporting Services Formats PDF
Deliver an awe inspiring pitch with this creative business service provider financial reporting services formats pdf bundle. Topics like financial, performance, processes, regulatory compliance can be discussed with this completely editable template. It is available for immediate download depending on the needs and requirements of the user.
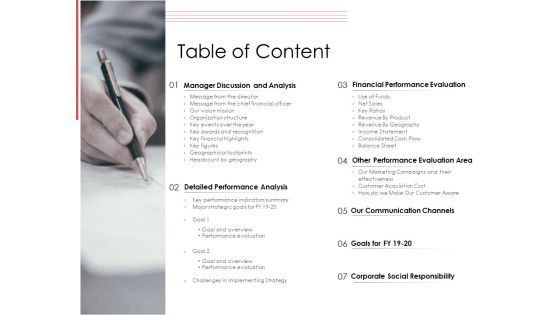
Financial PAR Table Of Content Ppt Infographic Template Show PDF
Presenting financial par table of content ppt infographic template show pdf to provide visual cues and insights. Share and navigate important information on seven stages that need your due attention. This template can be used to pitch topics like financial, performance, evaluation, social, responsibility. In addtion, this PPT design contains high resolution images, graphics, etc, that are easily editable and available for immediate download.

 Home
Home