Financial Performance Dashboard

Monitoring Business Information Protection Weekly Performance Summary PDF
This slide covers monitoring business security weekly performance dashboard which includes organizational financial saving and incident engagement. Pitch your topic with ease and precision using this Monitoring Business Information Protection Weekly Performance Summary PDF. This layout presents information on Active Phishing, Active Incidents, Recent Observations. It is also available for immediate download and adjustment. So, changes can be made in the color, design, graphics or any other component to create a unique layout.

Strategic Guide To Perform Marketing Kpis To Analyze Marketing Process Performance Brochure PDF
This slide showcases various metrics to measure performance marketing process. It provides information of KPIs related to brand awareness, preference metrics, financial metrics competitive metrics, etc. Get a simple yet stunning designed Strategic Guide To Perform Marketing Kpis To Analyze Marketing Process Performance Brochure PDF. It is the best one to establish the tone in your meetings. It is an excellent way to make your presentations highly effective. So, download this PPT today from Slidegeeks and see the positive impacts. Our easy to edit Strategic Guide To Perform Marketing Kpis To Analyze Marketing Process Performance Brochure PDF can be your go to option for all upcoming conferences and meetings. So, what are you waiting for Grab this template today.

Guide For Marketing Analytics To Improve Decisions Perform Marketing Performance Competitive Analysis Sample PDF
The following slide covers comparison of company performance with key industry leaders to gain key insights and required data. It includes elements such as market share, product price, target audience, customer satisfaction, weaknesses, marketing strategy etc. Make sure to capture your audiences attention in your business displays with our gratis customizable Guide For Marketing Analytics To Improve Decisions Perform Marketing Performance Competitive Analysis Sample PDF. These are great for business strategies, office conferences, capital raising or task suggestions. If you desire to acquire more customers for your tech business and ensure they stay satisfied, create your own sales presentation with these plain slides.
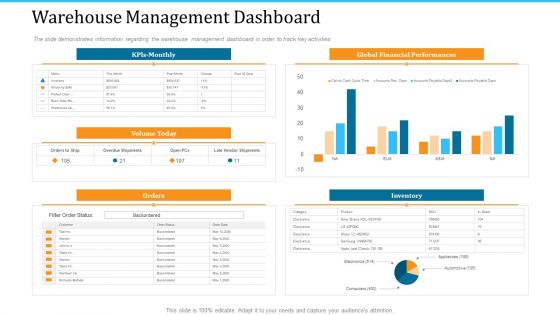
WMS Implementation Warehouse Management Dashboard Rules PDF
The slide demonstrates information regarding the warehouse management dashboard in order to track key activities. Deliver an awe-inspiring pitch with this creative wms implementation warehouse management dashboard rules pdf bundle. Topics like warehouse management dashboard, global financial performances, inventory can be discussed with this completely editable template. It is available for immediate download depending on the needs and requirements of the user.
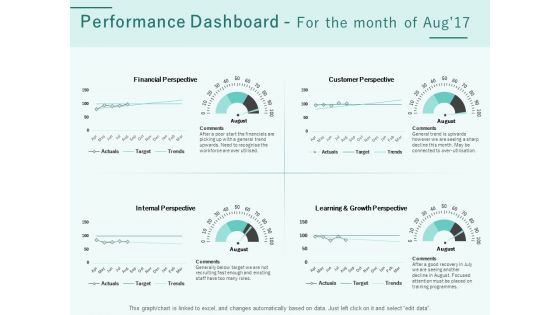
Progress Assessment Outline Performance Dashboard For The Month Of Aug 17 Ppt PowerPoint Presentation Model Clipart Images PDF
Presenting this set of slides with name progress assessment outline performance dashboard for the month of aug 17 ppt powerpoint presentation model clipart images pdf. The topics discussed in these slides are financial perspective, customer perspective, internal perspective, learning and growth perspective. This is a completely editable PowerPoint presentation and is available for immediate download. Download now and impress your audience.
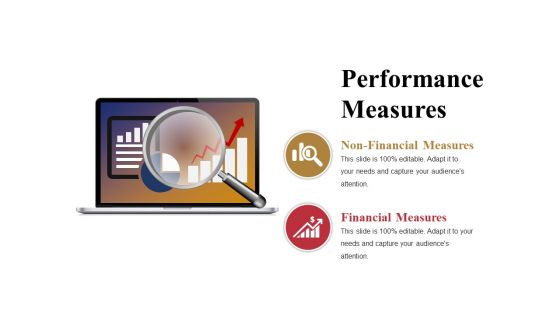
Performance Measures Ppt PowerPoint Presentation Inspiration Skills
This is a performance measures ppt powerpoint presentation inspiration skills. This is a two stage process. The stages in this process are non financial measures, financial measures, growth, business, marketing.

Key Financial Ratios Template 3 Ppt PowerPoint Presentation Summary Sample
This is a key financial ratios template 3 ppt powerpoint presentation summary sample. This is a four stage process. The stages in this process are liquidity, profitability, activity, solvency.
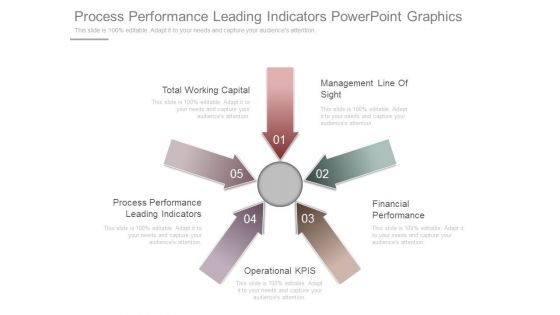
Process Performance Leading Indicators Powerpoint Graphics
This is a process performance leading indicators powerpoint graphics. This is a five stage process. The stages in this process are total working capital, management line of sight, process performance leading indicators, financial performance, operational kpis.

Improve Business Performance Template Ppt Examples Slides
This is a improve business performance template ppt examples slides. This is a seven stage process. The stages in this process are customer product analysis, customer research, activity analysis, executive report, financial performance, competitor, client consultation.
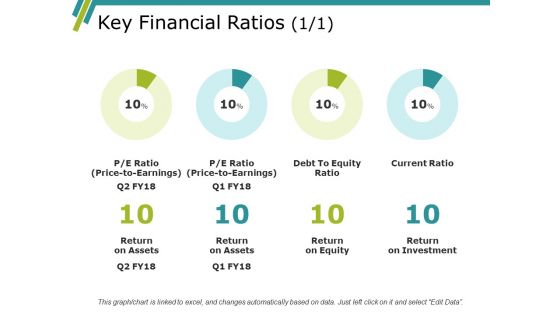
Key Financial Ratios Ppt PowerPoint Presentation Model Elements
This is a key financial ratios ppt powerpoint presentation model elements. This is a four stage process. The stages in this process are return on assets, return on equity, return on investment.
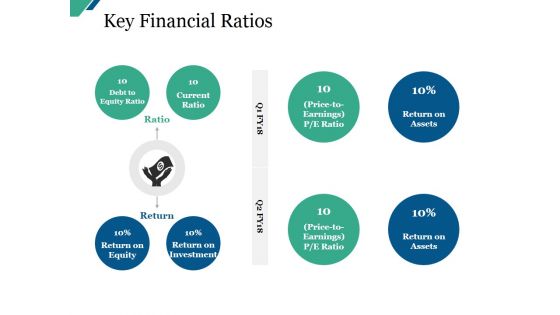
Key Financial Ratios Ppt PowerPoint Presentation Infographic Template Master Slide
This is a key financial ratios ppt powerpoint presentation infographic template master slide. This is a eight stage process. The stages in this process are debt to equity ratio, current ratio, return on equity, return on investment.

Capital Fundraising And Financial Forecast Pitch Deck Key Financial Projections For Upcoming Years Portrait PDF
This slide illustrates key performance indicators highlighting the financial projections for upcoming years. KPIs covered here are revenue breakdown, profitability and cash flow. Deliver an awe inspiring pitch with this creative capital fundraising and financial forecast pitch deck key financial projections for upcoming years portrait pdf bundle. Topics like key financial projections for upcoming years can be discussed with this completely editable template. It is available for immediate download depending on the needs and requirements of the user.

Key Financial Ratios Template Ppt PowerPoint Presentation Show Graphics Design
This is a key financial ratios template ppt powerpoint presentation show graphics design. This is a four stage process. The stages in this process are liquidity, profitability, activity, solvency.

Key Financial Ratios Ppt PowerPoint Presentation Portfolio Summary
This is a key financial ratios ppt powerpoint presentation portfolio summary. This is a eight stage process. The stages in this process are return on assets, return on equity, return on investment, debt equity ratio, current ratio.

Effective Sales Plan For New Product Introduction In Market KPI Dashboard To Monitor Sales Performance Portrait PDF
This slide shows sales performance monitoring dashboard. Metrics included in the dashboard are sales revenue, sales growth, average revenue per unit, customer lifetime value and customer acquisition cost.Deliver an awe inspiring pitch with this creative Effective Sales Plan For New Product Introduction In Market KPI Dashboard To Monitor Sales Performance Portrait PDF bundle. Topics like Average Revenue, Country Performance, Customer Lifetime can be discussed with this completely editable template. It is available for immediate download depending on the needs and requirements of the user.

Strategic Plan To Increase Sales Volume And Revenue Sales Strategy Performance Dashboard With Revenue And Target Summary PDF
This slide shows a Sales Strategy Performance Dashboard with variables such as new customers acquired, revenue generated, revenue vs target comparison etc. Deliver and pitch your topic in the best possible manner with this strategic plan to increase sales volume and revenue sales strategy performance dashboard with revenue and target summary pdf. Use them to share invaluable insights on sales, revenue, target and impress your audience. This template can be altered and modified as per your expectations. So, grab it now.
Strategies For Successful Customer Base Development In B2b M Commerce B2b Sales Performance Tracking Dashboard Demonstration PDF
This slide represents metric dashboard to track sales performance on e-commerce website. It cover performance indicators such as sales breakdown, order breakdown, recurring sales etc. Make sure to capture your audiences attention in your business displays with our gratis customizable Strategies For Successful Customer Base Development In B2b M Commerce B2b Sales Performance Tracking Dashboard Demonstration PDF. These are great for business strategies, office conferences, capital raising or task suggestions. If you desire to acquire more customers for your tech business and ensure they stay satisfied, create your own sales presentation with these plain slides.

Strategic Plan To Increase Sales Volume And Revenue Sales Strategy Performance Dashboard With Media Followers And Engaged Users Topics PDF
This slide shows a Sales Strategy Performance Dashboard with variables such as social media followers, engaged users, page impressions etc. Deliver an awe inspiring pitch with this creative strategic plan to increase sales volume and revenue sales strategy performance dashboard with media followers and engaged users topics pdf bundle. Topics like facebook daily reach, facebook key metrics, facebook engaged users and page impressions, social media followers can be discussed with this completely editable template. It is available for immediate download depending on the needs and requirements of the user.

How Make Impactful Product Marketing Message Build Product Differentiation Product Performance Dashboard With Total Revenues Information PDF
The following slide displays a brand awareness dashboard as it highlights the key metrics for measuring brand awareness such as brand search, social media searches, links, brand and mentions. Deliver and pitch your topic in the best possible manner with this how make impactful product marketing message build product differentiation product performance dashboard with total revenues information pdf. Use them to share invaluable insights on social, organic, performance, traffic and impress your audience. This template can be altered and modified as per your expectations. So, grab it now.

Dual Branding Campaign To Boost Sales Of Product Or Services Dashboard For Dual Branding Campaign Performance Infographics PDF
This slide showcases dashboard that can help organization to measure performance after launching dual branding campaign. Its key components are sales comparison, revenue by client, revenue by source and new customers by source. The best PPT templates are a great way to save time, energy, and resources. Slidegeeks have 100 percent editable powerpoint slides making them incredibly versatile. With these quality presentation templates, you can create a captivating and memorable presentation by combining visually appealing slides and effectively communicating your message. Download Dual Branding Campaign To Boost Sales Of Product Or Services Dashboard For Dual Branding Campaign Performance Infographics PDF from Slidegeeks and deliver a wonderful presentation.

Implementing Marketing Mix Strategy To Enhance Overall Performance Social Media Dashboard To Understand Marketing Efforts Guidelines PDF
The following dashboard helps the organization in analyzing the key metrics to track performance of their social media digital marketing strategy, these metrics are followers, likes and visits. Deliver and pitch your topic in the best possible manner with this Implementing Marketing Mix Strategy To Enhance Overall Performance Social Media Dashboard To Understand Marketing Efforts Guidelines PDF. Use them to share invaluable insights on Sales, New Customer, New Revenue and impress your audience. This template can be altered and modified as per your expectations. So, grab it now.

Company Performance Management Software Analysis Pictures PDF
This slide shows comparative analysis of company performance management software. It includes features, compatibility, price and ratings.Presenting Company Performance Management Software Analysis Pictures PDF to dispense important information. This template comprises one stages. It also presents valuable insights into the topics including Build dashboards, Financial forecasting, Operational planning. This is a completely customizable PowerPoint theme that can be put to use immediately. So, download it and address the topic impactfully.

Online Marketing Strategy For Lead Generation Dashboard To Track Results Of Performance Marketing Ad Campaigns Slides PDF
This slide showcases dashboard that can help marketers to track and evaluate the outcomes of performance marketing ad campaigns. Its key elements are impressions, clicks, conversions, click through rate, cost per conversion, revenue per click etc This Online Marketing Strategy For Lead Generation Dashboard To Track Results Of Performance Marketing Ad Campaigns Slides PDF from Slidegeeks makes it easy to present information on your topic with precision. It provides customization options, so you can make changes to the colors, design, graphics, or any other component to create a unique layout. It is also available for immediate download, so you can begin using it right away. Slidegeeks has done good research to ensure that you have everything you need to make your presentation stand out. Make a name out there for a brilliant performance.
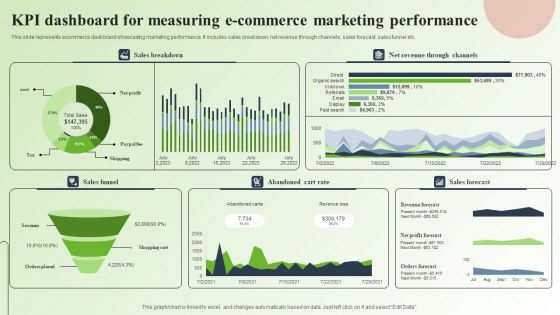
Strategic Guide For Mastering E Commerce Marketing Kpi Dashboard For Measuring E Commerce Marketing Performance Infographics PDF
This slide represents ecommerce dashboard showcasing marketing performance. It includes sales breakdown, net revenue through channels, sales forecast, sales funnel etc. Slidegeeks is here to make your presentations a breeze with Strategic Guide For Mastering E Commerce Marketing Kpi Dashboard For Measuring E Commerce Marketing Performance Infographics PDF With our easy to use and customizable templates, you can focus on delivering your ideas rather than worrying about formatting. With a variety of designs to choose from, you are sure to find one that suits your needs. And with animations and unique photos, illustrations, and fonts, you can make your presentation pop. So whether you are giving a sales pitch or presenting to the board, make sure to check out Slidegeeks first.

Acquiring Clients Through Search Engine And Native Ads Dashboard To Track Results Of Performance Marketing Information PDF
This slide showcases dashboard that can help marketers to track and evaluate the outcomes of performance marketing ad campaigns. Its key elements are impressions, clicks, conversions, click through rate, cost per conversion, revenue per click etc. Present like a pro with Acquiring Clients Through Search Engine And Native Ads Dashboard To Track Results Of Performance Marketing Information PDF Create beautiful presentations together with your team, using our easy to use presentation slides. Share your ideas in real time and make changes on the fly by downloading our templates. So whether you are in the office, on the go, or in a remote location, you can stay in sync with your team and present your ideas with confidence. With Slidegeeks presentation got a whole lot easier. Grab these presentations today.

Strategic Financial Plan Objective Of Creating Business Financial Plan Infographics PDF
This slide showcases the goal of creating a financial plan. The goals covered are investment planning, asset planning, cashflow planning, etc. From laying roadmaps to briefing everything in detail, our templates are perfect for you. You can set the stage with your presentation slides. All you have to do is download these easy-to-edit and customizable templates. Strategic Financial Plan Objective Of Creating Business Financial Plan Infographics PDF will help you deliver an outstanding performance that everyone would remember and praise you for. Do download this presentation today.
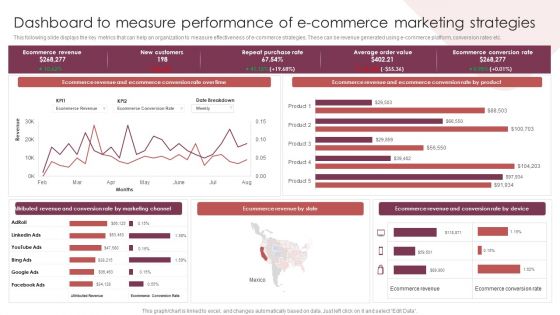
E Commerce Marketing Techniques To Boost Sales Dashboard To Measure Performance Of E Commerce Marketing Strategies Structure PDF
This following slide displays the key metrics that can help an organization to measure effectiveness of e-commerce strategies. These can be revenue generated using e-commerce platform, conversion rates etc. Slidegeeks is here to make your presentations a breeze with E Commerce Marketing Techniques To Boost Sales Dashboard To Measure Performance Of E Commerce Marketing Strategies Structure PDF With our easy-to-use and customizable templates, you can focus on delivering your ideas rather than worrying about formatting. With a variety of designs to choose from, you are sure to find one that suits your needs. And with animations and unique photos, illustrations, and fonts, you can make your presentation pop. So whether you are giving a sales pitch or presenting to the board, make sure to check out Slidegeeks first.
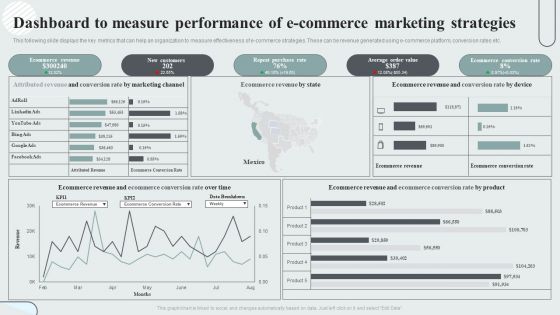
Techniques To Enhance Customer Engagement Via Digital Platforms Dashboard To Measure Performance Of E Commerce Marketing Strategies Slides PDF
This following slide displays the key metrics that can help an organization to measure effectiveness of e-commerce strategies. These can be revenue generated using e-commerce platform, conversion rates etc. Present like a pro with Techniques To Enhance Customer Engagement Via Digital Platforms Dashboard To Measure Performance Of E Commerce Marketing Strategies Slides PDF Create beautiful presentations together with your team, using our easy-to-use presentation slides. Share your ideas in real-time and make changes on the fly by downloading our templates. So whether you are in the office, on the go, or in a remote location, you can stay in sync with your team and present your ideas with confidence. With Slidegeeks presentation got a whole lot easier. Grab these presentations today.

Accounting Key Performance Indicators Ppt Powerpoint
This is a accounting key performance indicators ppt powerpoint. This is a four stage process. The stages in this process are cost per invoice, invoice processing speed, productivity per team member, variance analysis.
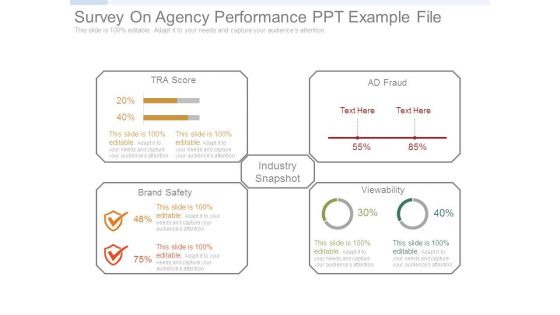
Survey On Agency Performance Ppt Example File
This is a survey on agency performance ppt example file. This is a four stage process. The stages in this process are industry snapshot, brand safety, ad fraud, viewability, tra score.
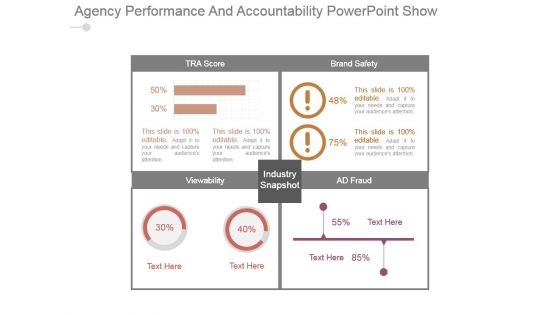
Agency Performance And Accountability Powerpoint Show
This is a agency performance and accountability powerpoint show. This is a four stage process. The stages in this process are tra score, brand safety, view ability, ad fraud, industry snapshot.
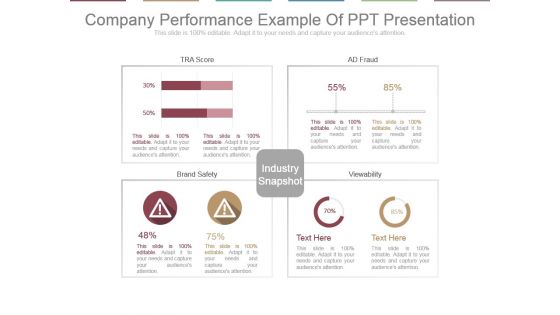
Company Performance Example Of Ppt Presentation
This is a company performance example of ppt presentation. This is a four stage process. The stages in this process are tra score, ad fraud, brand safety, view ability, industry snapshot.

Agency Performance Slide2 Ppt PowerPoint Presentation Deck
This is a agency performance slide2 ppt powerpoint presentation deck. This is a four stage process. The stages in this process are tra store, ad fraud, brand safety, industry snapshot, viewability.
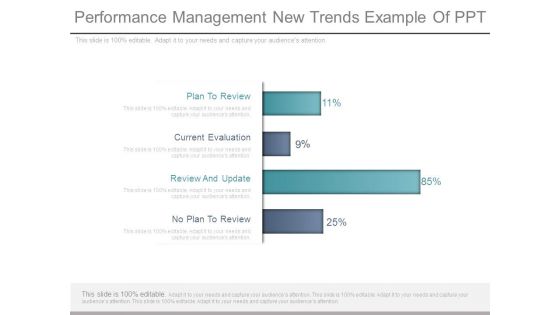
Performance Management New Trends Example Of Ppt
This is a performance management new trends example of ppt. This is a four stage process. The stages in this process are plan to review, current evaluation, review and update, no plan to review.
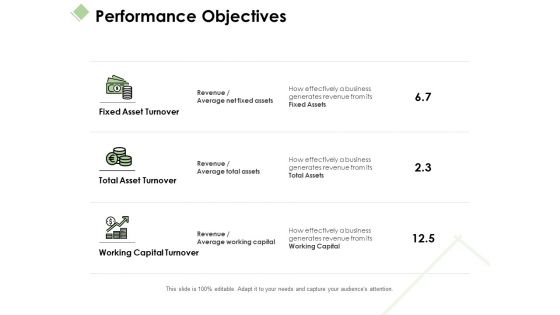
Performance Objectives Ppt PowerPoint Presentation Infographics Themes
Presenting this set of slides with name performance objectives ppt powerpoint presentation infographics themes. This is a three stage process. The stages in this process are fixed asset turnover, total asset turnover, working capital turnover. This is a completely editable PowerPoint presentation and is available for immediate download. Download now and impress your audience.

Investment Annual Performance Report Pictures PDF
This slide highlights a statistical data showing performance of investment funds for developing financial growth plan. It includes key components such as global equities, aggressive, growth, balanced, moderate, conservative and cash. Pitch your topic with ease and precision using this Investment Annual Performance Report Pictures PDF. This layout presents information on Low Interest Rates, Wage Subsidies, Returns Due Market Drop. It is also available for immediate download and adjustment. So, changes can be made in the color, design, graphics or any other component to create a unique layout.

Campaign Performance Report Sample Example Ppt Presentation
This is a campaign performance report sample example ppt presentation. This is a four stage process. The stages in this process are brand, leads, sales, loyalty.

Agency Performance Ppt PowerPoint Presentation Layout
This is a agency performance ppt powerpoint presentation layout. This is a four stage process. The stages in this process are tra score, viewability, industry snapshot, brand safety, ad fraud.
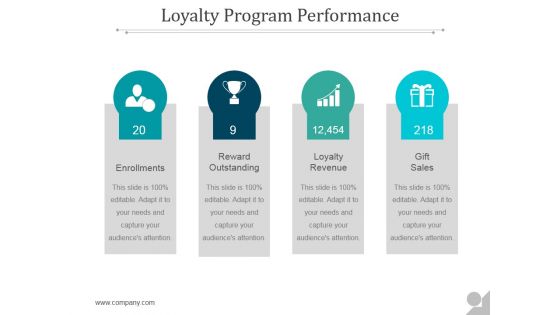
Loyalty Program Performance Ppt PowerPoint Presentation Tips
This is a loyalty program performance ppt powerpoint presentation tips. This is a four stage process. The stages in this process are enrollments, reward outstanding, loyalty revenue, gift sales.

Loyalty Program Performance Ppt PowerPoint Presentation Portfolio
This is a loyalty program performance ppt powerpoint presentation portfolio. This is a four stage process. The stages in this process are enrollments, reward outstanding, loyalty revenue, gift sales.

SMS Marketing Performance Analytics Report Summary PDF
This slide represents the dashboard to track and monitor the overall performance of SMS marketing campaign and its impact on business sales and revenues. It includes details related to top automated flows, attributed revenue etc. This SMS Marketing Performance Analytics Report Summary PDF from Slidegeeks makes it easy to present information on your topic with precision. It provides customization options, so you can make changes to the colors, design, graphics, or any other component to create a unique layout. It is also available for immediate download, so you can begin using it right away. Slidegeeks has done good research to ensure that you have everything you need to make your presentation stand out. Make a name out there for a brilliant performance.

Loyalty Program Performance Ppt PowerPoint Presentation Slides
This is a loyalty program performance ppt powerpoint presentation slides. This is a four stage process. The stages in this process are enrollments icon, reward outstanding, loyalty revenue, gift sales.
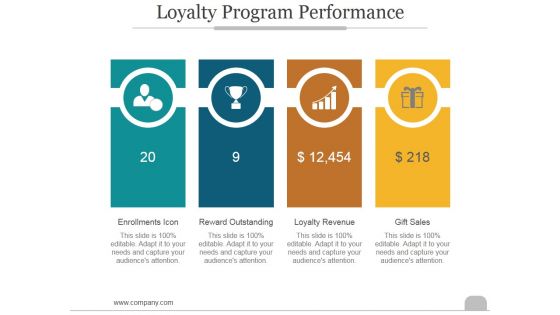
Loyalty Program Performance Ppt PowerPoint Presentation Introduction
This is a loyalty program performance ppt powerpoint presentation introduction. This is a four stage process. The stages in this process are enrollments icon, reward outstanding, loyalty revenue, gift sales.

Key Financial Challenges Faced Organization Assessing Corporate Financial Techniques Infographics Pdf
This slide provides glimpse about challenges faced by the organization regarding current financial performance. It includes revenue from operations, net worth, ROE and ROCE, etc. The Key Financial Challenges Faced Organization Assessing Corporate Financial Techniques Infographics Pdf is a compilation of the most recent design trends as a series of slides. It is suitable for any subject or industry presentation, containing attractive visuals and photo spots for businesses to clearly express their messages. This template contains a variety of slides for the user to input data, such as structures to contrast two elements, bullet points, and slides for written information. Slidegeeks is prepared to create an impression.
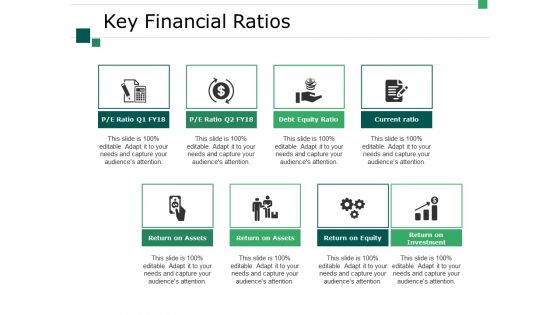
Key Financial Ratios Ppt PowerPoint Presentation Outline Slide
This is a key financial ratios ppt powerpoint presentation outline slide. This is a eight stage process. The stages in this process are return on assets, return on equity, return on investment, current ratio, debt equity ratio.

Sales Performance Ppt PowerPoint Presentation Summary Influencers
This is a sales performance ppt powerpoint presentation summary influencers. This is a six stage process. The stages in this process are sales performance dashboard, sales by region, sales revenue by product, sales kpi performance matrix, quarterly sales review.

Sales Performance Ppt PowerPoint Presentation Portfolio Show
This is a sales performance ppt powerpoint presentation portfolio show. This is a six stage process. The stages in this process are sales performance dashboard, sales by region, sales revenue by product, quarterly sales review, sales budget vs actuals.

Sales Performance Ppt PowerPoint Presentation Infographics Visuals
This is a sales performance ppt powerpoint presentation infographics visuals. This is a six stage process. The stages in this process are sales by region, sales revenue by product, sales kpi performance matrix, quarterly sales review, sales budget vs actuals.
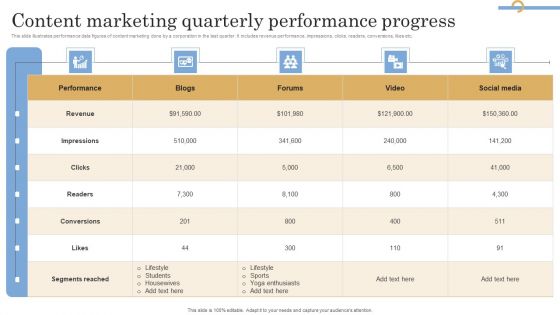
Content Marketing Quarterly Performance Progress Pictures PDF
This slide illustrates performance data figures of content marketing done by a corporation in the last quarter. It includes revenue performance, impressions, clicks, readers, conversions, likes etc. Pitch your topic with ease and precision using this Content Marketing Quarterly Performance Progress Pictures PDF. This layout presents information on Performance, Blogs, Forums. It is also available for immediate download and adjustment. So, changes can be made in the color, design, graphics or any other component to create a unique layout.
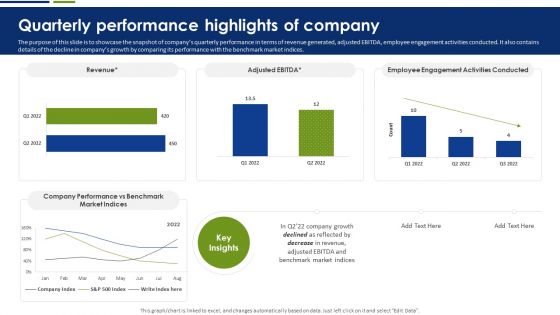
Quarterly Performance Highlights Of Company Brochure PDF
The purpose of this slide is to showcase the snapshot of companys quarterly performance in terms of revenue generated, adjusted EBITDA, employee engagement activities conducted. It also contains details of the decline in companys growth by comparing its performance with the benchmark market indices. This Quarterly Performance Highlights Of Company Brochure PDF is perfect for any presentation, be it in front of clients or colleagues. It is a versatile and stylish solution for organizing your meetings. The Quarterly Performance Highlights Of Company Brochure PDF features a modern design for your presentation meetings. The adjustable and customizable slides provide unlimited possibilities for acing up your presentation. Slidegeeks has done all the homework before launching the product for you. So, do not wait, grab the presentation templates today.

Monthly Company Performance Analysiscompetitor Analysis Pictures PDF
This graph or chart is linked to excel, and changes automatically based on data. Just left click on it and select Edit Data. Deliver and pitch your topic in the best possible manner with this monthly company performance analysiscompetitor analysis pictures pdf. Use them to share invaluable insights on revenue, competitor analysis and impress your audience. This template can be altered and modified as per your expectations. So, grab it now.
Website Performance Review Ppt PowerPoint Presentation Icon Deck
This is a website performance review ppt powerpoint presentation icon deck. This is a three stage process. The stages in this process are conversion rate, average visit value goal, visits.

Website Performance Review Template 1 Ppt PowerPoint Presentation Portfolio Guide
This is a website performance review template 1 ppt powerpoint presentation portfolio guide. This is a four stage process. The stages in this process are website performance review, dashboard, business, marketing, finance.
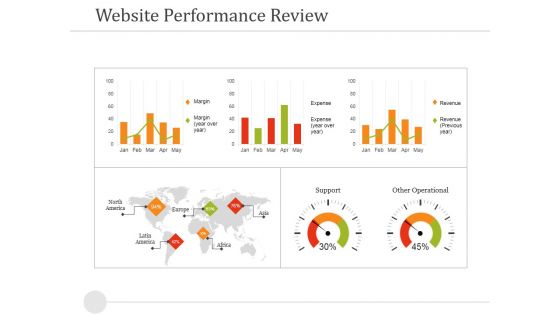
Website Performance Review Template 2 Ppt PowerPoint Presentation Gallery Objects
This is a website performance review template 2 ppt powerpoint presentation gallery objects. This is a three stage process. The stages in this process are margin, revenue, expense, support, other operational.
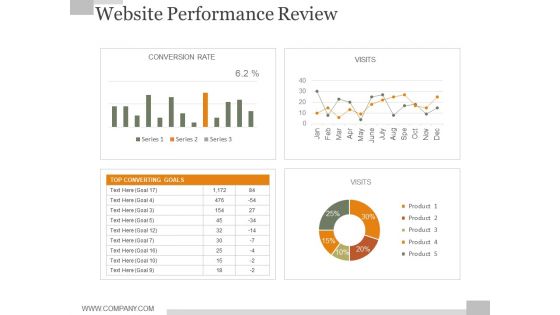
Website Performance Review Slide Ppt PowerPoint Presentation Example 2015
This is a website performance review slide ppt powerpoint presentation example 2015. This is a four stage process. The stages in this process are traffic source, online transaction, conversion rate, average visit time.

Performance Training Action Plan And Extensive Strategies Performance Coaching Planning Worksheet Infographics PDF
This slide shows the performance coaching planning worksheet with details related o Major targets, coaching topics, SMART goals and 30 days action plan Deliver an awe inspiring pitch with this creative performance training action plan and extensive strategies performance coaching planning worksheet infographics pdf bundle. Topics like career building coaching, communication training, financial planning coaching can be discussed with this completely editable template. It is available for immediate download depending on the needs and requirements of the user.
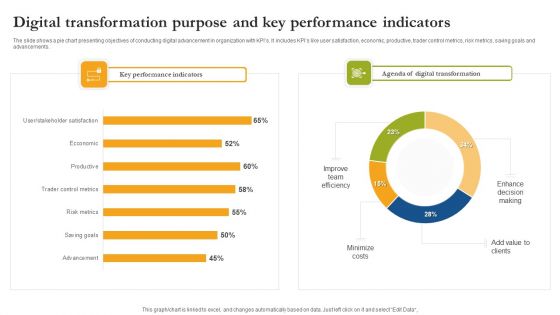
Digital Transformation Purpose And Key Performance Indicators Formats PDF
The slide shows a pie chart presenting objectives of conducting digital advancement in organization with KPIs. It includes KPIs like user satisfaction, economic, productive, trader control metrics, risk metrics, saving goals and advancements. Pitch your topic with ease and precision using this Digital Transformation Purpose And Key Performance Indicators Formats PDF. This layout presents information on Key Performance Indicators, Digital Transformation, Minimize Costs. It is also available for immediate download and adjustment. So, changes can be made in the color, design, graphics or any other component to create a unique layout.
Performance Enhancement Plan Monthly Sales Performance Tracking And Monitoring Portrait Pdf
This slide showcases a dashboard presenting various metrics to measure and analyze sales performance for revenue growth. It includes key components such as number of sales, revenue, profit, cost, sales revenue, sales increment, cost analysis and cross sell. Coming up with a presentation necessitates that the majority of the effort goes into the content and the message you intend to convey. The visuals of a PowerPoint presentation can only be effective if it supplements and supports the story that is being told. Keeping this in mind our experts created Performance Enhancement Plan Monthly Sales Performance Tracking And Monitoring Portrait Pdf to reduce the time that goes into designing the presentation. This way, you can concentrate on the message while our designers take care of providing you with the right template for the situation.

Content Marketing Performance Template 1 Ppt PowerPoint Presentation Styles Infographics
This is a content marketing performance template 1 ppt powerpoint presentation styles infographics. This is a eight stage process. The stages in this process are conversion rate, quality of leads, number of leads, sales revenue, website traffic, subscriber list growth, social media sharing, search engine ranking.

Three Semi Circular Performance Meters And Dashboards Ppt PowerPoint Presentation Slides Influencers
This is a three semi circular performance meters and dashboards ppt powerpoint presentation slides influencers. This is a three stage process. The stages in this process are fuel gauge, gas gauge, fuel containers.

 Home
Home