Financial Performance Dashboard

Sales Performance Ppt PowerPoint Presentation Pictures Format Ideas
This is a sales performance ppt powerpoint presentation pictures format ideas. This is a six stage process. The stages in this process are quarterly sales review, sales by region, sales performance dashboard, sales revenue by product.
Sales Performance Ppt PowerPoint Presentation Visual Aids Icon
This is a sales performance ppt powerpoint presentation visual aids icon. This is a six stage process. The stages in this process are quarterly sales review, sales performance dashboard, sales by region, sales revenue by product.

Comparing Overall Benchmarks Describing Business Performance Administration Goals Brochure Pdf
The following slide highlights some key performance indicators to compare business performance with industry standards to formulate strategies and fill the gap. It includes elements such as website traffic, customer acquisition cost, employee satisfaction rate, customer churn rate, sales revenue etc. The Comparing Overall Benchmarks Describing Business Performance Administration Goals Brochure Pdf is a compilation of the most recent design trends as a series of slides. It is suitable for any subject or industry presentation, containing attractive visuals and photo spots for businesses to clearly express their messages. This template contains a variety of slides for the user to input data, such as structures to contrast two elements, bullet points, and slides for written information. Slidegeeks is prepared to create an impression.
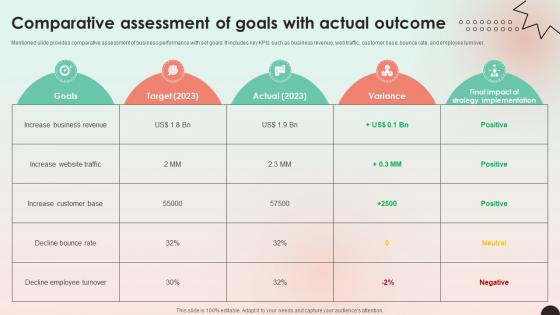
Web Consulting Business Performance Comparative Assessment Of Goals
Mentioned slide provides comparative assessment of business performance with set goals. It includes key KPIs such as business revenue, web traffic, customer base, bounce rate, and employee turnover. From laying roadmaps to briefing everything in detail, our templates are perfect for you. You can set the stage with your presentation slides. All you have to do is download these easy-to-edit and customizable templates. Web Consulting Business Performance Comparative Assessment Of Goals will help you deliver an outstanding performance that everyone would remember and praise you for. Do download this presentation today.
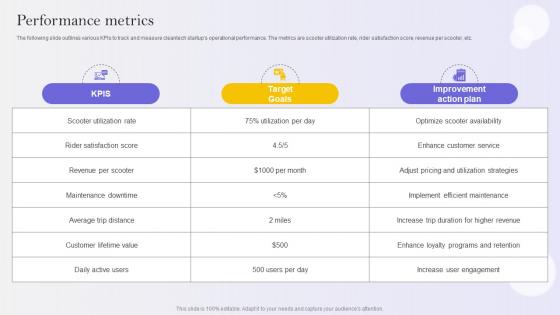
Performance Metrics E Scooter Business Market Entry Strategy
The following slide outlines various KPIs to track and measure cleantech startups operational performance. The metrics are scooter utilization rate, rider satisfaction score, revenue per scooter, etc.Crafting an eye-catching presentation has never been more straightforward. Let your presentation shine with this tasteful yet straightforward Performance Metrics E Scooter Business Market Entry Strategy template. It offers a minimalistic and classy look that is great for making a statement. The colors have been employed intelligently to add a bit of playfulness while still remaining professional. Construct the ideal Performance Metrics E Scooter Business Market Entry Strategy that effortlessly grabs the attention of your audience Begin now and be certain to wow your customers
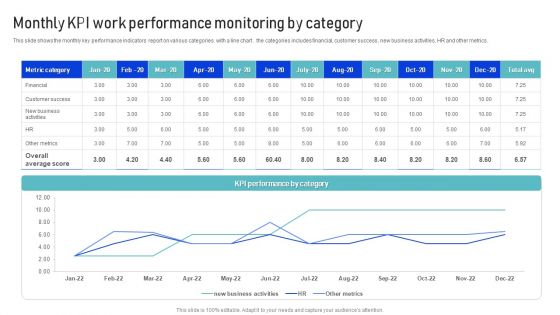
Monthly KPI Work Performance Monitoring By Category Microsoft PDF
This slide shows the monthly key performance indicators report on various categories with a line chart . the categories includes financial, customer success , new business activities, HR and other metrics. Pitch your topic with ease and precision using this Monthly KPI Work Performance Monitoring By Category Microsoft PDF. This layout presents information on Metrics, Financial, Customer Success. It is also available for immediate download and adjustment. So, changes can be made in the color, design, graphics or any other component to create a unique layout.

Stock Performance Metrics For Warehouse Management Ppt Tips PDF
This slide indicates the inventory KPIs for warehouse management which helps in improving logistics business activities. It includes parameters such as financial, productivity, utilization, etc. Showcasing this set of slides titled Stock Performance Metrics For Warehouse Management Ppt Tips PDF. The topics addressed in these templates are Receiving, Financial, Productivity. All the content presented in this PPT design is completely editable. Download it and make adjustments in color, background, font etc. as per your unique business setting.
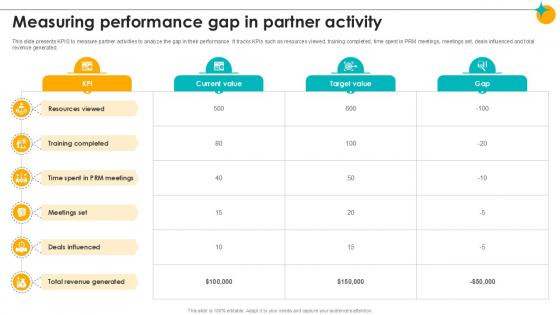
Measuring Performance Gap In Partner Activity Partner Relationship Ppt Slides
This slide presents KPIS to measure partner activities to analyze the gap in their performance. It tracks KPIs such as resources viewed, training completed, time spent in PRM meetings, meetings set, deals influenced and total revenue generated. Do you have to make sure that everyone on your team knows about any specific topic I yes, then you should give Measuring Performance Gap In Partner Activity Partner Relationship Ppt Slides a try. Our experts have put a lot of knowledge and effort into creating this impeccable Measuring Performance Gap In Partner Activity Partner Relationship Ppt Slides. You can use this template for your upcoming presentations, as the slides are perfect to represent even the tiniest detail. You can download these templates from the Slidegeeks website and these are easy to edit. So grab these today

Performance Metrics Skincare Startup GTM Strategy GTM SS V
The following slide outlines various KPIs to track and measure B2C cosmetic startup operational performance. The metrics are customer retention rate, average order value, customer satisfaction rating, positive reviews, etc.Make sure to capture your audiences attention in your business displays with our gratis customizable Performance Metrics Skincare Startup GTM Strategy GTM SS V. These are great for business strategies, office conferences, capital raising or task suggestions. If you desire to acquire more customers for your tech business and ensure they stay satisfied, create your own sales presentation with these plain slides.
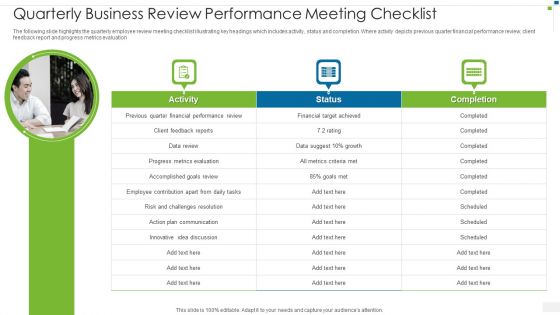
Quarterly Business Review Performance Meeting Checklist Infographics PDF
Presenting quarterly business review performance meeting checklist infographics pdfe to dispense important information. This template comprises three stages. It also presents valuable insights into the topics including financial, goals, communication. This is a completely customizable PowerPoint theme that can be put to use immediately. So, download it and address the topic impactfully.
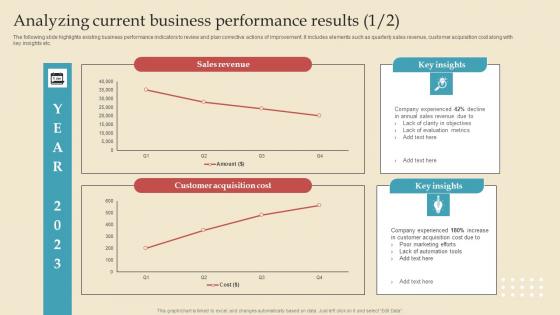
Analyzing Current Describing Business Performance Administration Goals Microsoft Pdf
The following slide highlights existing business performance indicators to review and plan corrective actions of improvement. It includes elements such as quarterly sales revenue, customer acquisition cost along with key insights etc. This modern and well arranged Analyzing Current Describing Business Performance Administration Goals Microsoft Pdf provides lots of creative possibilities. It is very simple to customize and edit with the Powerpoint Software. Just drag and drop your pictures into the shapes. All facets of this template can be edited with Powerpoint, no extra software is necessary. Add your own material, put your images in the places assigned for them, adjust the colors, and then you can show your slides to the world, with an animated slide included.
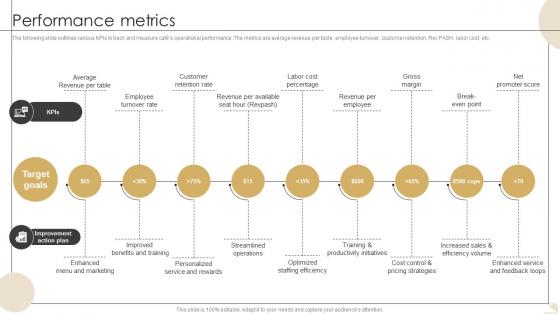
Performance Metrics Bistro Startup GTM Strategy GTM SS V
The following slide outlines various KPIs to track and measure cafes operational performance. The metrics are average revenue per table, employee turnover, customer retention, RevPASH, labor cost, etc.Formulating a presentation can take up a lot of effort and time, so the content and message should always be the primary focus. The visuals of the PowerPoint can enhance the presenters message, so our Performance Metrics Bistro Startup GTM Strategy GTM SS V was created to help save time. Instead of worrying about the design, the presenter can concentrate on the message while our designers work on creating the ideal templates for whatever situation is needed. Slidegeeks has experts for everything from amazing designs to valuable content, we have put everything into Performance Metrics Bistro Startup GTM Strategy GTM SS V.

Performance Outline Luxury Automobile Vehicles PPT Template CP SS V
The slide showcases the performance snapshot of Tata motors in year 2022. It includes statistics such as vehicles sold, revenue, investment spending, employees, domestic market share in commercial, passenger and electric vehicles. Find a pre-designed and impeccable Performance Outline Luxury Automobile Vehicles PPT Template CP SS V. The templates can ace your presentation without additional effort. You can download these easy-to-edit presentation templates to make your presentation stand out from others. So, what are you waiting for Download the template from Slidegeeks today and give a unique touch to your presentation.

Drip Email Marketing Performance Statistics PPT Example MKT SS V
This slide mentions statistics that highlight the success rate of implementing drip email marketing campaigns by businesses brands to target relevant audiences. It includes data regarding email open rates, lead generation, sales and revenue generation. Whether you have daily or monthly meetings, a brilliant presentation is necessary. Drip Email Marketing Performance Statistics PPT Example MKT SS V can be your best option for delivering a presentation. Represent everything in detail using Drip Email Marketing Performance Statistics PPT Example MKT SS V and make yourself stand out in meetings. The template is versatile and follows a structure that will cater to your requirements. All the templates prepared by Slidegeeks are easy to download and edit. Our research experts have taken care of the corporate themes as well. So, give it a try and see the results.
Managing Technical And Non Various Kpis For Tracking Business Performance
Mentioned slide provide insights into various key performance indicators to determine business performance. It includes KPIs such as business financials, website traffic, customer case, customer engagement, conversion rate, customer retention, customer bounce rate, employee turnover, etc. Make sure to capture your audiences attention in your business displays with our gratis customizable Managing Technical And Non Various Kpis For Tracking Business Performance. These are great for business strategies, office conferences, capital raising or task suggestions. If you desire to acquire more customers for your tech business and ensure they stay satisfied, create your own sales presentation with these plain slides.
Comprehensive Guide For Website Various Kpis For Tracking Business Performance
Mentioned slide provide insights into various key performance indicators to determine business performance. It includes KPIs such as business financials, website traffic, customer case, customer engagement, conversion rate, customer retention, customer bounce rate, employee turnover, etc. Make sure to capture your audiences attention in your business displays with our gratis customizable Comprehensive Guide For Website Various Kpis For Tracking Business Performance. These are great for business strategies, office conferences, capital raising or task suggestions. If you desire to acquire more customers for your tech business and ensure they stay satisfied, create your own sales presentation with these plain slides.
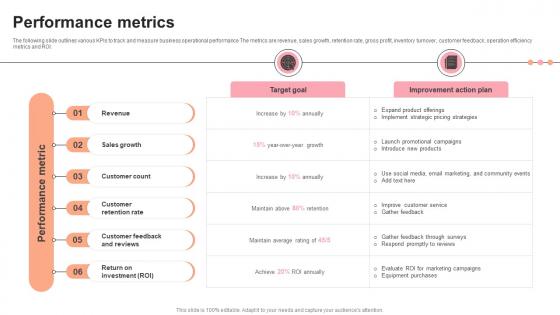
Performance Metrics Pastry Shop Market Entry Plan GTM SS V
The following slide outlines various KPIs to track and measure business operational performance The metrics are revenue, sales growth, retention rate, gross profit, inventory turnover, customer feedback, operation efficiency metrics and ROI. Crafting an eye-catching presentation has never been more straightforward. Let your presentation shine with this tasteful yet straightforward Performance Metrics Pastry Shop Market Entry Plan GTM SS V template. It offers a minimalistic and classy look that is great for making a statement. The colors have been employed intelligently to add a bit of playfulness while still remaining professional. Construct the ideal Performance Metrics Pastry Shop Market Entry Plan GTM SS V that effortlessly grabs the attention of your audience Begin now and be certain to wow your customers
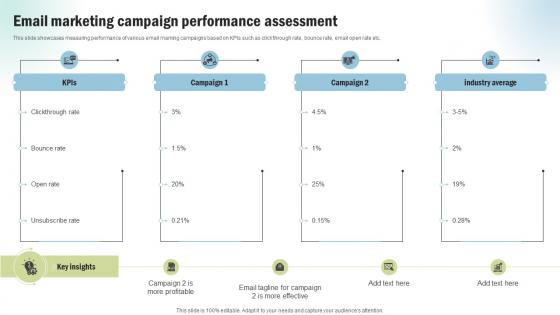
Marketing Project Performance Benchmarking Email Marketing Campaign CRP SS V
This slide showcases measuring performance of various email marking campaigns based on KPIs such as click through rate, bounce rate, email open rate etc. Make sure to capture your audiences attention in your business displays with our gratis customizable Marketing Project Performance Benchmarking Email Marketing Campaign CRP SS V. These are great for business strategies, office conferences, capital raising or task suggestions. If you desire to acquire more customers for your tech business and ensure they stay satisfied, create your own sales presentation with these plain slides.

Metrics To Improve Venture Capital Investment Performance Information PDF
This slide showcases various KPIs to measure performance of venture capital funds for analyzing business operations improvement areas. It includes key components such as key performance indicators, actual performance, benchmarked performance and strategies to improve. Pitch your topic with ease and precision using this Metrics To Improve Venture Capital Investment Performance Information PDF. This layout presents information on Actual, Strategies Improve, Benchmark. It is also available for immediate download and adjustment. So, changes can be made in the color, design, graphics or any other component to create a unique layout.
Web Consulting Business Various Kpis For Tracking Business Performance
Mentioned slide provide insights into various key performance indicators to determine business performance. It includes KPIs such as business financials, website traffic, customer case, customer engagement, conversion rate, customer retention, customer bounce rate, employee turnover, etc. This modern and well-arranged Web Consulting Business Various Kpis For Tracking Business Performance provides lots of creative possibilities. It is very simple to customize and edit with the Powerpoint Software. Just drag and drop your pictures into the shapes. All facets of this template can be edited with Powerpoint, no extra software is necessary. Add your own material, put your images in the places assigned for them, adjust the colors, and then you can show your slides to the world, with an animated slide included.
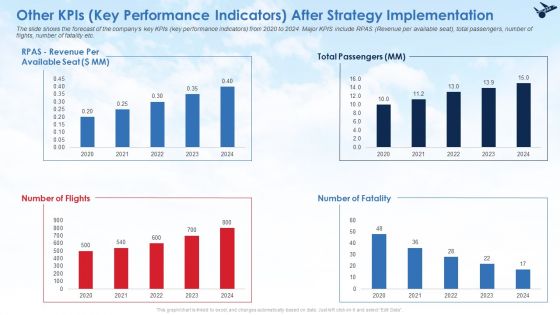
Other Kpis Key Performance Indicators After Strategy Implementation Infographics PDF
The slide shows the forecast of the companys key KPIs key performance indicators from 2020 to 2024. Major KPIS include RPAS Revenue per available seat, total passengers, number of flights, number of fatality etc. Deliver and pitch your topic in the best possible manner with this other kpis key performance indicators after strategy implementation infographics pdf. Use them to share invaluable insights on other kpis key performance indicators after strategy implementation and impress your audience. This template can be altered and modified as per your expectations. So, grab it now.

Competitive Analysis By Key Performance Indicators 2020 Elements PDF
The slide shows the comparison of major KPIs key performance indicators of the company with its competitors. Major KPIs include Revenue, net profit, number of flights, number of passengers, number of pilots etc. Deliver an awe inspiring pitch with this creative competitive analysis by key performance indicators 2020 elements pdf bundle. Topics like competitive analysis by key performance indicators can be discussed with this completely editable template. It is available for immediate download depending on the needs and requirements of the user.
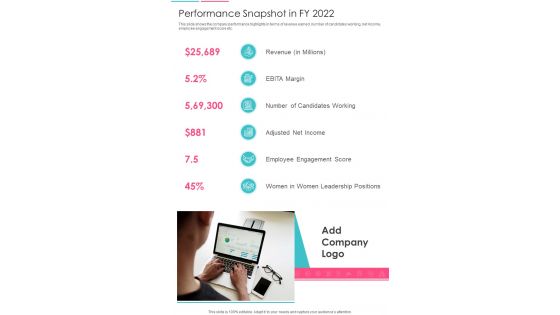
Performance Snapshot In FY 2022 One Pager Documents
This slide shows the company performance highlights in terms of revenue earned, number of candidates working, net income, employee engagement score etc. Presenting you an exemplary Performance Snapshot In FY 2022 One Pager Documents. Our one-pager comprises all the must-have essentials of an inclusive document. You can edit it with ease, as its layout is completely editable. With such freedom, you can tweak its design and other elements to your requirements. Download this Performance Snapshot In FY 2022 One Pager Documents brilliant piece now.
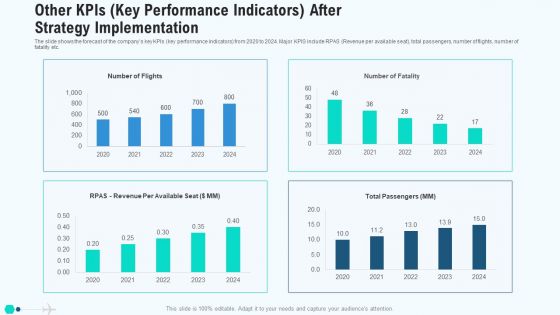
Other Kpis Key Performance Indicators After Strategy Implementation Mockup PDF
The slide shows the forecast of the companys key KPIs key performance indicators from 2020 to 2024. Major KPIS include RPAS Revenue per available seat, total passengers, number of flights, number of fatality etc. Deliver and pitch your topic in the best possible manner with this other kpis key performance indicators after strategy implementation mockup pdf. Use them to share invaluable insights on other kpis key performance indicators after strategy implementation and impress your audience. This template can be altered and modified as per your expectations. So, grab it now.
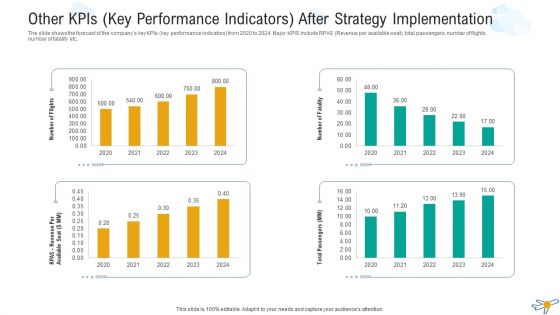
Other Kpis Key Performance Indicators After Strategy Implementation Microsoft PDF
The slide shows the forecast of the companys key KPIs key performance indicators from 2020 to 2024. Major KPIS include RPAS Revenue per available seat, total passengers, number of flights, number of fatality etc. Deliver and pitch your topic in the best possible manner with this other kpis key performance indicators after strategy implementation microsoft pdf. Use them to share invaluable insights on other kpis key performance indicators after strategy implementation and impress your audience. This template can be altered and modified as per your expectations. So, grab it now.
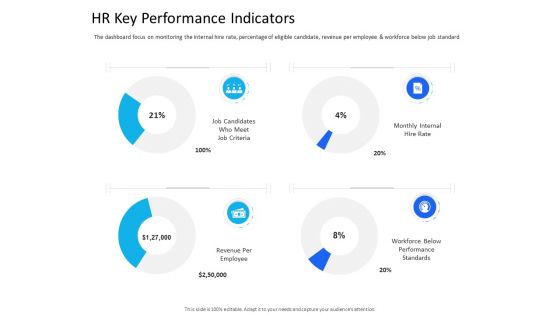
Organization Manpower Management Technology HR Key Performance Indicators Graphics PDF
Deliver an awe inspiring pitch with this creative organization manpower management technology hr key performance indicators graphics pdf bundle. Topics like criteria, workforce, performance, revenue, internal can be discussed with this completely editable template. It is available for immediate download depending on the needs and requirements of the user.

Revenue And Employee Key Performance Indicators Background PDF
The following slide highlights the revenue and staff key performance Indicators illustrating key headings which includes revenue centres, employee vs profitability, billable hours, average rate per hour and profitable employees Deliver an awe inspiring pitch with this creative Revenue And Employee Key Performance Indicators Background PDF bundle. Topics like Revenue Centres, Employee Profitability, Profitable Employee can be discussed with this completely editable template. It is available for immediate download depending on the needs and requirements of the user.

Organizations Key Performance Indicators To Measure Progress One Pager Documents
This one page covers about key performance indicators to measure progress through various KPIs that includes revenue growth, comparable sales growth and adjusted operating profit growth. Presenting you a fantastic Organizations Key Performance Indicators To Measure Progress One Pager Documents. This piece is crafted on hours of research and professional design efforts to ensure you have the best resource. It is completely editable and its design allow you to rehash its elements to suit your needs. Get this Organizations Key Performance Indicators To Measure Progress One Pager Documents A4 One-pager now.

Competitive Analysis By Key Performance Indicators 2020 Designs PDF
The slide shows the comparison of major KPIs key performance indicators of the company with its competitors. Major KPIs include Revenue, net profit, number of flights, number of passengers, number of pilots etc.Deliver an awe-inspiring pitch with this creative competitive analysis by key performance indicators 2020 designs pdf. bundle. Topics like net profits, revenue, number of passengers can be discussed with this completely editable template. It is available for immediate download depending on the needs and requirements of the user.

Competitive Analysis By Key Performance Indicators 2020 Professional PDF
The slide shows the comparison of major KPIs key performance indicators of the company with its competitors. Major KPIs include Revenue, net profit, number of flights, number of passengers, number of pilots etc. Deliver an awe inspiring pitch with this creative competitive analysis by key performance indicators 2020 professional pdf bundle. Topics like revenue, net profits can be discussed with this completely editable template. It is available for immediate download depending on the needs and requirements of the user.
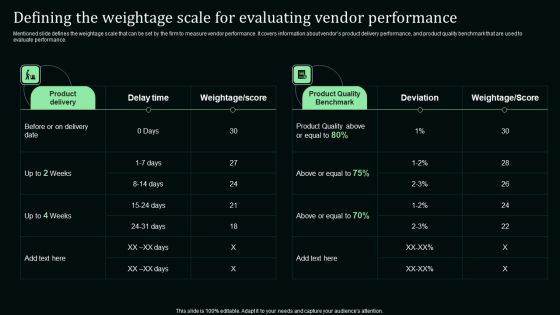
Defining The Weightage Scale For Evaluating Vendor Performance Infographics PDF
Mentioned slide defines the weightage scale that can be set by the firm to measure vendor performance. It covers information about vendors product delivery performance, and product quality benchmark that are used to evaluate performance.Make sure to capture your audiences attention in your business displays with our gratis customizable Defining The Weightage Scale For Evaluating Vendor Performance Infographics PDF. These are great for business strategies, office conferences, capital raising or task suggestions. If you desire to acquire more customers for your tech business and ensure they stay satisfied, create your own sales presentation with these plain slides.
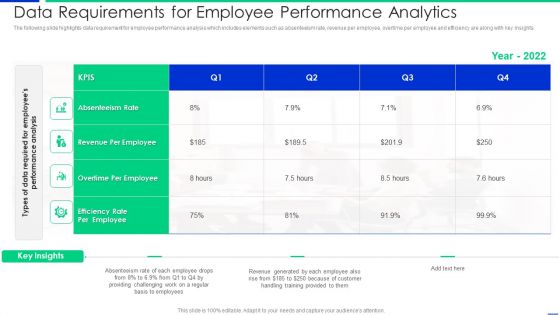
Data Requirements For Employee Performance Analytics Graphics PDF
The following slide highlights data requirement for employee performance analysis which includes elements such as absenteeism rate, revenue per employee, overtime per employee and efficiency are along with key insights. Pitch your topic with ease and precision using this data requirements for employee performance analytics graphics pdf. This layout presents information on revenue, employee, rate. It is also available for immediate download and adjustment. So, changes can be made in the color, design, graphics or any other component to create a unique layout.
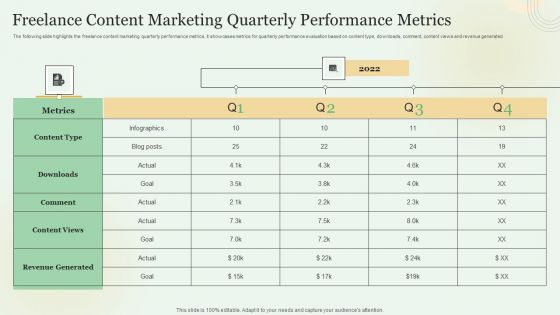
Freelance Content Marketing Quarterly Performance Metrics Sample PDF
The following slide highlights the freelance content marketing quarterly performance metrics. It showcases metrics for quarterly performance evaluation based on content type, downloads, comment, content views and revenue generated. Pitch your topic with ease and precision using this Freelance Content Marketing Quarterly Performance Metrics Sample PDF. This layout presents information on Revenue Generated, Infographics, Goal. It is also available for immediate download and adjustment. So, changes can be made in the color, design, graphics or any other component to create a unique layout.

Business Review With Kpis Purpose And Current Performance Inspiration PDF
The following slide shows key performance indicators measured by firms to review the performance of organization. It KPIs includes customer conversion rate, client retention rate, profit margin and revenue growth. Showcasing this set of slides titled Business Review With Kpis Purpose And Current Performance Inspiration PDF. The topics addressed in these templates are Customer Conversion Rate, Client Retention Rate, Profit Margin. All the content presented in this PPT design is completely editable. Download it and make adjustments in color, background, font etc. as per your unique business setting.

Ecommerce Operations Management Metrics To Measure Performance Professional PDF
This slide showcases essential metrics of e-commerce to make informed decisions. Major key performance indicators covered are website traffic, shopping cart abandonment rate, revenue per visitor and on time delivery rate. Presenting Ecommerce Operations Management Metrics To Measure Performance Professional PDF to dispense important information. This template comprises one stage. It also presents valuable insights into the topics including Abandonment Rate, Industry Benchmark, Performance. This is a completely customizable PowerPoint theme that can be put to use immediately. So, download it and address the topic impactfully.

Other Kpis Key Performance Indicators After Strategy Implementation Professional PDF
The slide shows the forecast of the companys key KPIs key performance indicators from 2020 to 2024. Major KPIS include RPAS Revenue per available seat, total passengers, number of flights, number of fatality etc.Deliver and pitch your topic in the best possible manner with this other KPIs key performance indicators after strategy implementation professional pdf. Use them to share invaluable insights on total passengers, number of flights, 2020 to 2024 and impress your audience. This template can be altered and modified as per your expectations. So, grab it now.
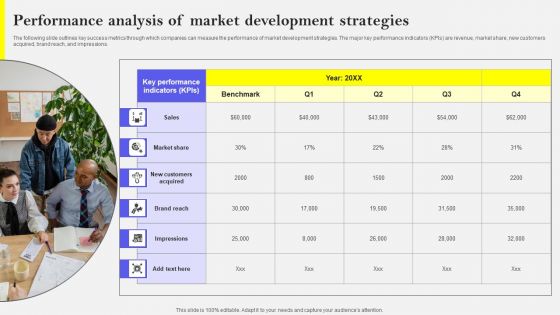
Performance Analysis Of Market Development Strategies Information PDF
The following slide outlines key success metrics through which companies can measure the performance of market development strategies. The major key performance indicators KPIs are revenue, market share, new customers acquired, brand reach, and impressions. Find a pre-designed and impeccable Performance Analysis Of Market Development Strategies Information PDF. The templates can ace your presentation without additional effort. You can download these easy-to-edit presentation templates to make your presentation stand out from others. So, what are you waiting for Download the template from Slidegeeks today and give a unique touch to your presentation.
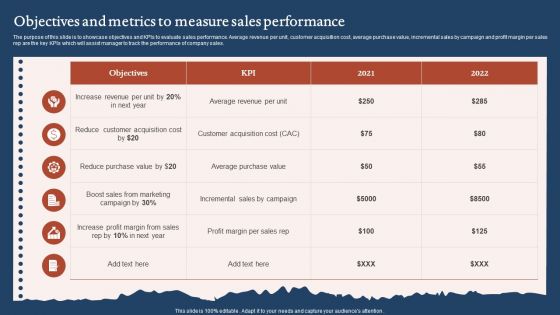
Objectives And Metrics To Measure Sales Performance Sample PDF
The purpose of this slide is to showcase objectives and KPIs to evaluate sales performance. Average revenue per unit, customer acquisition cost, average purchase value, incremental sales by campaign and profit margin per sales rep are the key KPIs which will assist manager to track the performance of company sales. Showcasing this set of slides titled Objectives And Metrics To Measure Sales Performance Sample PDF. The topics addressed in these templates are Reduce Purchase Value, Increase Profit Margin, Customer Acquisition Cost. All the content presented in this PPT design is completely editable. Download it and make adjustments in color, background, font etc. as per your unique business setting.
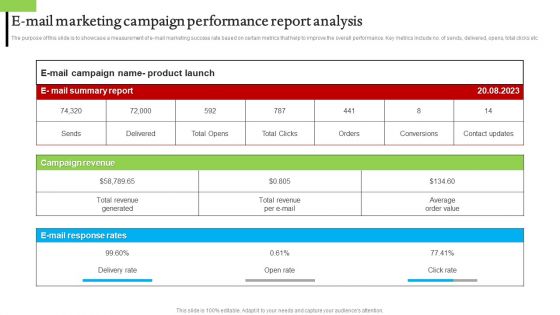
E Mail Marketing Campaign Performance Report Analysis Designs PDF
The purpose of this slide is to showcase a measurement of e-mail marketing success rate based on certain metrics that help to improve the overall performance. Key metrics include no. of sends, delivered, opens, total clicks etc. Pitch your topic with ease and precision using this E Mail Marketing Campaign Performance Report Analysis Designs PDF. This layout presents information on Campaign Revenue, Product Launch, Performance Report Analysis. It is also available for immediate download and adjustment. So, changes can be made in the color, design, graphics or any other component to create a unique layout.

Rebranding Performance Metrics Ppt PowerPoint Presentation Infographics Layout PDF
The purpose of this slide is to provide a glimpse of the rebranding performance metrics.Deliver an awe inspiring pitch with this creative rebranding performance metrics ppt powerpoint presentation infographics layout pdf bundle. Topics like league table top performing, production, sales revenue, website visitors, target can be discussed with this completely editable template. It is available for immediate download depending on the needs and requirements of the user.
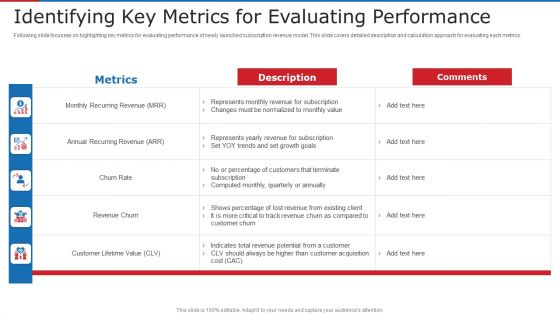
Identifying Key Metrics For Evaluating Performance Ppt Styles Files PDF
Following slide focusses on highlighting key metrics for evaluating performance of newly launched subscription revenue model. This slide covers detailed description and calculation approach for evaluating each metrics. Deliver and pitch your topic in the best possible manner with this identifying key metrics for evaluating performance ppt styles files pdf. Use them to share invaluable insights on revenue, growth, goals, potential, customer and impress your audience. This template can be altered and modified as per your expectations. So, grab it now.

Competitive Analysis By Key Performance Indicators 2020 Inspiration PDF
The slide shows the comparison of major KPIs key performance indicators of the company with its competitors. Major KPIs include Revenue, net profit, number of flights, number of passengers, number of pilots etc. Deliver and pitch your topic in the best possible manner with this competitive analysis by key performance indicators 2020 inspiration pdf. Use them to share invaluable insights on comparison, revenue, net profit, number of flights, number of passengers and impress your audience. This template can be altered and modified as per your expectations. So, grab it now.

Key Performance Indicator Tree Illustrating Online Application Revenue Download PDF
Presenting key performance indicator tree illustrating online application revenue download pdf to dispense important information. This template comprises three stages. It also presents valuable insights into the topics including daily conversion, returning users, daily revenue. This is a completely customizable PowerPoint theme that can be put to use immediately. So, download it and address the topic impactfully.
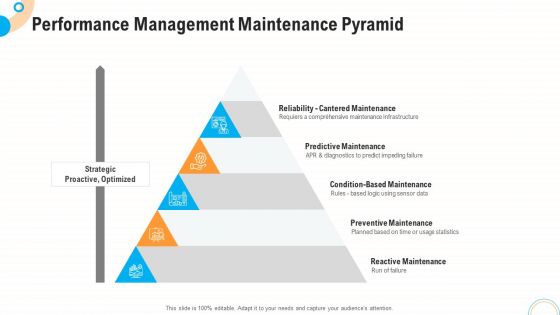
Fiscal And Operational Assessment Performance Management Maintenance Pyramid Infographics PDF
Presenting fiscal and operational assessment performance management maintenance pyramid infographics pdf to provide visual cues and insights. Share and navigate important information on five stages that need your due attention. This template can be used to pitch topics like predictive maintenance, condition based maintenance, preventive maintenance. In addtion, this PPT design contains high resolution images, graphics, etc, that are easily editable and available for immediate download.

Before And After Product Performance Analytics Infographics PDF
This slide covers product performance prior and after using LinkedIn marketing or ad campaign tool for promotion. It includes gaps analysis based on annual product sales, website visitors, revenue and lead generation rates. Presenting this PowerPoint presentation, titled Before And After Product Performance Analytics Infographics PDF, with topics curated by our researchers after extensive research. This editable presentation is available for immediate download and provides attractive features when used. Download now and captivate your audience. Presenting this Before And After Product Performance Analytics Infographics PDF. Our researchers have carefully researched and created these slides with all aspects taken into consideration. This is a completely customizable Before And After Product Performance Analytics Infographics PDF that is available for immediate downloading. Download now and make an impact on your audience. Highlight the attractive features available with our PPTs.
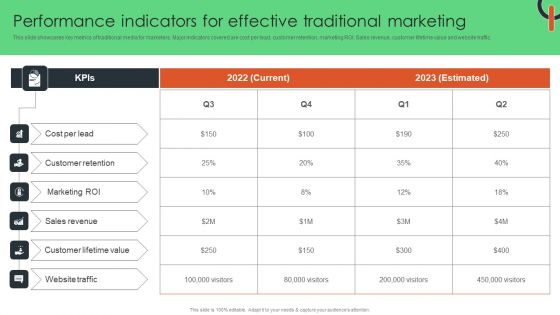
Performance Indicators For Effective Traditional Marketing Guidelines PDF
This slide showcases key metrics of traditional media for marketers. Major indicators covered are cost per lead, customer retention, marketing ROI. Sales revenue, customer lifetime value and website traffic. Create an editable Performance Indicators For Effective Traditional Marketing Guidelines PDF that communicates your idea and engages your audience. Whether you are presenting a business or an educational presentation, pre-designed presentation templates help save time. Performance Indicators For Effective Traditional Marketing Guidelines PDF is highly customizable and very easy to edit, covering many different styles from creative to business presentations. Slidegeeks has creative team members who have crafted amazing templates. So, go and get them without any delay.

Analytical Incrementalism Business Performance Measurement Metrics Sales Infographics PDF
The purpose of this slide is to provide a glimpse about the business marketing performance measurement metrics after logical incrementalism approach. Deliver an awe-inspiring pitch with this creative analytical incrementalism business performance measurement metrics sales infographics pdf bundle. Topics like gross profit margin, revenue, quick ratio can be discussed with this completely editable template. It is available for immediate download depending on the needs and requirements of the user.

Various Metrics Determining Fintech Platform Performance Infographics PDF
This slide caters details about various metrics portraying FinTech platform progress in terms of rise in active users and rise in revenue. Deliver and pitch your topic in the best possible manner with this various metrics determining fintech platform performance infographics pdf. Use them to share invaluable insights on various metrics determining fintech platform performance and impress your audience. This template can be altered and modified as per your expectations. So, grab it now.

Instagram Metrics To Measure Marketing Campaign Performance Formats PDF
The following slide outlines different key performance indicators KPIs through which managers can evaluate the success of a marketing campaign. It contains information about metrics such as total impressions, followers growth rate, cost per click CPC, revenue generated, likes, and comments. Explore a selection of the finest Instagram Metrics To Measure Marketing Campaign Performance Formats PDF here. With a plethora of professionally designed and pre made slide templates, you can quickly and easily find the right one for your upcoming presentation. You can use our Instagram Metrics To Measure Marketing Campaign Performance Formats PDF to effectively convey your message to a wider audience. Slidegeeks has done a lot of research before preparing these presentation templates. The content can be personalized and the slides are highly editable. Grab templates today from Slidegeeks.

Company Budget Analysis Quarterly Performance Highlights Of Company Ideas PDF
The purpose of this slide is to showcase the snapshot of companys quarterly performance in terms of revenue generated, adjusted EBITDA, employee engagement activities conducted. It also contains details of the decline in companys growth by comparing its performance with the benchmark market indices. Formulating a presentation can take up a lot of effort and time, so the content and message should always be the primary focus. The visuals of the PowerPoint can enhance the presenters message, so our Company Budget Analysis Quarterly Performance Highlights Of Company Ideas PDF was created to help save time. Instead of worrying about the design, the presenter can concentrate on the message while our designers work on creating the ideal templates for whatever situation is needed. Slidegeeks has experts for everything from amazing designs to valuable content, we have put everything into Company Budget Analysis Quarterly Performance Highlights Of Company Ideas PDF.

Expenses Management Plan Quarterly Performance Highlights Of Company Download PDF
The purpose of this slide is to showcase the snapshot of companys quarterly performance in terms of revenue generated, adjusted EBITDA, employee engagement activities conducted. It also contains details of the decline in companys growth by comparing its performance with the benchmark market indices. Crafting an eye-catching presentation has never been more straightforward. Let your presentation shine with this tasteful yet straightforward Expenses Management Plan Quarterly Performance Highlights Of Company Download PDF template. It offers a minimalistic and classy look that is great for making a statement. The colors have been employed intelligently to add a bit of playfulness while still remaining professional. Construct the ideal Expenses Management Plan Quarterly Performance Highlights Of Company Download PDF that effortlessly grabs the attention of your audience Begin now and be certain to wow your customers.

Key Performance Indicators For Ecommerce Diagram Ppt Design
This is a key performance indicators for ecommerce diagram ppt design. This is a eight stage process. The stages in this process are cost strategies, price strategies, market share strategies, market size strategies, conversion optimization, social sentiment, economic factors, brand awareness.

Advertising Kpis To Measure Holistic Performance Structure PDF
This slide highlights major marketing key performance indicators aimed at effectively analysing strategies to increase traffic, leads and sales. It covers revenue attribution, customer acquisition cost and lifetime value with traffic to lead ratio and lead to customer ratio. Persuade your audience using this Advertising Kpis To Measure Holistic Performance Structure PDF. This PPT design covers five stages, thus making it a great tool to use. It also caters to a variety of topics including Revenue Attribution, Customer Acquisition Cost, Customer Lifetime Value. Download this PPT design now to present a convincing pitch that not only emphasizes the topic but also showcases your presentation skills.
Software Tool Leading And Lagging Performance Tracking Indicators Diagrams PDF
This slide showcase the lagging and leading performance indicators after the implementation of a software tool. It includes customer integration data, email campaign revenue generated,session time, email deliverability, email click rates etc. Persuade your audience using this Software Tool Leading And Lagging Performance Tracking Indicators Diagrams PDF. This PPT design covers Two stages, thus making it a great tool to use. It also caters to a variety of topics including Software Tool Leading, Lagging Performance, Tracking Indicators. Download this PPT design now to present a convincing pitch that not only emphasizes the topic but also showcases your presentation skills.
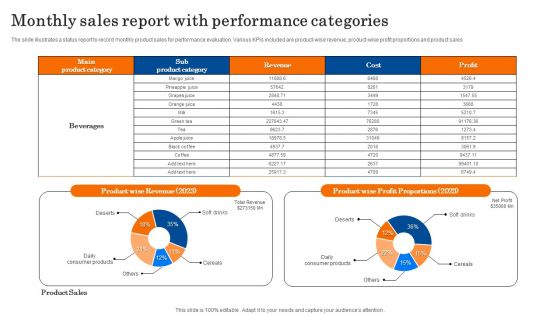
Monthly Sales Report With Performance Categories Diagrams PDF
The slide illustrates a status report to record monthly product sales for performance evaluation. Various KPIs included are product wise revenue, product-wise profit proportions and product sales. Showcasing this set of slides titled Monthly Sales Report With Performance Categories Diagrams PDF. The topics addressed in these templates are Revenue, Profit Proportions, Product Sales. All the content presented in this PPT design is completely editable. Download it and make adjustments in color, background, font etc. as per your unique business setting.
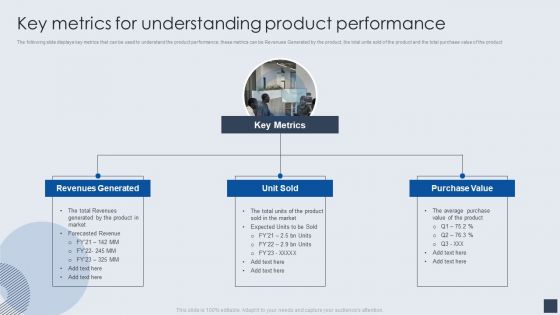
Key Metrics For Understanding Product Performance Clipart PDF
The following slide displays key metrics that can be used to understand the product performance, these metrics can be Revenues Generated by the product, the total units sold of the product and the total purchase value of the product. This is a Key Metrics For Understanding Product Performance Clipart PDF template with various stages. Focus and dispense information on three stages using this creative set, that comes with editable features. It contains large content boxes to add your information on topics like Revenues Generated, Unit Sold, Key Metrics, Purchase Value. You can also showcase facts, figures, and other relevant content using this PPT layout. Grab it now.
Key Performance Indicators For Smarketing Ppt Icon Graphic Images PDF
This slide shows various KPIs which can be used to measure marketing and sales alignment. These are overall revenue, sales cycle length, marketing qualified leads, etc. Presenting Key Performance Indicators For Smarketing Ppt Icon Graphic Images PDF to dispense important information. This template comprises one stages. It also presents valuable insights into the topics including KPIs, Overall Revenue, Sales Cycle Length. This is a completely customizable PowerPoint theme that can be put to use immediately. So, download it and address the topic impactfully.
Quarterly Sales Revenue Generation Performance Chart Icon Slides PDF
This graph or chart is linked to excel, and changes automatically based on data. Just left click on it and select edit data. Persuade your audience using this Quarterly Sales Revenue Generation Performance Chart Icon Slides PDF. This PPT design covers four stages, thus making it a great tool to use. It also caters to a variety of topics including Quarterly Sales Revenue, Generation Performance, Chart Icon. Download this PPT design now to present a convincing pitch that not only emphasizes the topic but also showcases your presentation skills.
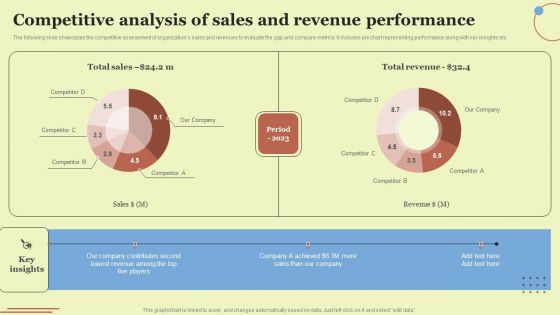
Competitive Analysis Of Sales And Revenue Performance Elements PDF
The following slide showcases the competitive assessment of organizations sales and revenues to evaluate the gap and compare metrics. It includes pie chart representing performance along with key insights etc. Take your projects to the next level with our ultimate collection of Competitive Analysis Of Sales And Revenue Performance Elements PDF. Slidegeeks has designed a range of layouts that are perfect for representing task or activity duration, keeping track of all your deadlines at a glance. Tailor these designs to your exact needs and give them a truly corporate look with your own brand colors they will make your projects stand out from the rest.
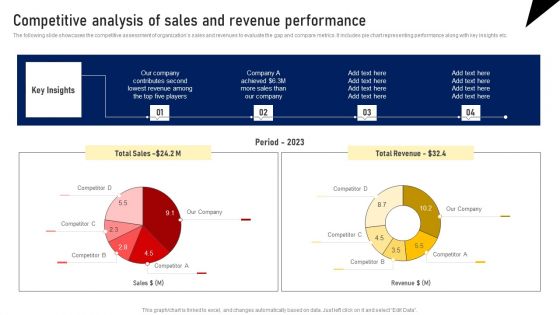
Competitive Analysis Of Sales And Revenue Performance Designs PDF
The following slide showcases the competitive assessment of organizations sales and revenues to evaluate the gap and compare metrics. It includes pie chart representing performance along with key insights etc. Take your projects to the next level with our ultimate collection of Competitive Analysis Of Sales And Revenue Performance Designs PDF. Slidegeeks has designed a range of layouts that are perfect for representing task or activity duration, keeping track of all your deadlines at a glance. Tailor these designs to your exact needs and give them a truly corporate look with your own brand colors they will make your projects stand out from the rest.

 Home
Home