Financial Performance Dashboard
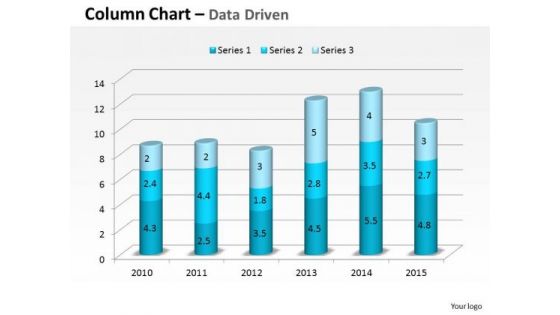
Data Analysis In Excel 3d Compare Yearly Business Performance PowerPoint Templates
Plan For All Contingencies With Our data analysis in excel 3d compare yearly business performance Powerpoint Templates . Douse The Fire Before It Catches.

Data Analysis Template Driven Line Chart For Business Performance PowerPoint Slides Templates
Do Not Allow Things To Drift. Ring In Changes With Our data analysis template driven line chart for business performance powerpoint slides Templates .
Investment Project Prioritization KPI Dashboard Icons PDF
This slide covers project management dashboard for ranking and filtering capital projects. It also include KPIs such as top projects by NPV, top projects by IRR, investor amount, return amount, etc. Showcasing this set of slides titled Investment Project Prioritization KPI Dashboard Icons PDF. The topics addressed in these templates are Project Performance, Top Project NPV, Top Project IRR. All the content presented in this PPT design is completely editable. Download it and make adjustments in color, background, font etc. as per your unique business setting.
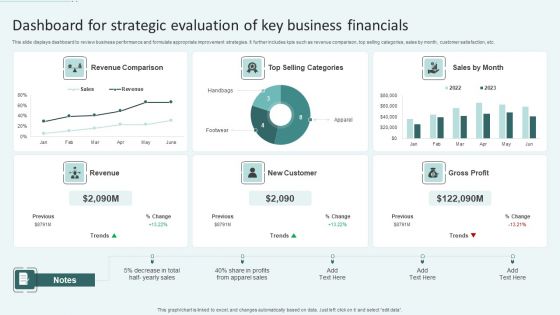
Dashboard For Strategic Evaluation Of Key Business Financials Ppt Gallery Aids PDF
This slide displays dashboard to review business performance and formulate appropriate improvement strategies. It further includes kpis such as revenue comparison, top selling categories, sales by month, customer satisfaction, etc. Showcasing this set of slides titled Dashboard For Strategic Evaluation Of Key Business Financials Ppt Gallery Aids PDF. The topics addressed in these templates are Revenue Comparison, Top Selling Categories, New Customer. All the content presented in this PPT design is completely editable. Download it and make adjustments in color, background, font etc. as per your unique business setting.
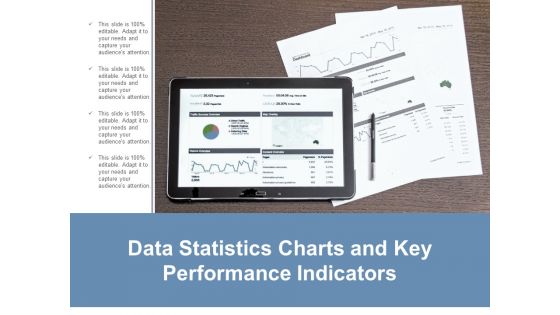
Data Statistics Charts And Key Performance Indicators Ppt Powerpoint Presentation Layouts Guide
This is a data statistics charts and key performance indicators ppt powerpoint presentation layouts guide. This is a four stage process. The stages in this process are business metrics, business kpi, business dashboard.
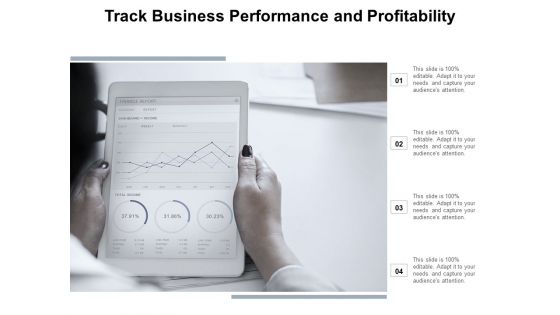
Track Business Performance And Profitability Ppt Powerpoint Presentation File Master Slide
This is a track business performance and profitability ppt powerpoint presentation file master slide. This is a four stage process. The stages in this process are business metrics, business kpi, business dashboard.
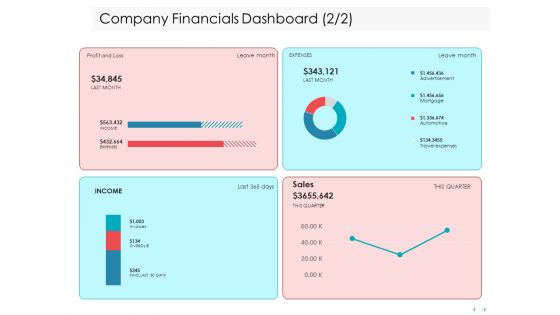
Managing CFO Services Company Financials Dashboard Profit Ppt Infographics Example File PDF
Presenting this set of slides with name managing cfo services company financials dashboard profit ppt infographics example file pdf. The topics discussed in these slides are revenue, customers, vendors, profit, expense, performance. This is a completely editable PowerPoint presentation and is available for immediate download. Download now and impress your audience.

Outsourcing Of Finance And Accounting Processes Company Financials Dashboard Microsoft PDF
Presenting this set of slides with name outsourcing of finance and accounting processes company financials dashboard microsoft pdf. The topics discussed in these slides are performance, revenue, expense, profit. This is a completely editable PowerPoint presentation and is available for immediate download. Download now and impress your audience.

Funding Pitch On Company Financial Overview For Fy22 Ppt Infographics Display PDF
This slide illustrates corporate financial performance overview for capital fund raising. It includes profitable growth, robust order book, resilient balance sheet etc. Persuade your audience using this Funding Pitch On Company Financial Overview For Fy22 Ppt Infographics Display PDF. This PPT design covers one stages, thus making it a great tool to use. It also caters to a variety of topics including Robust Order Book, Strong Performance, Resilient Balance Sheet. Download this PPT design now to present a convincing pitch that not only emphasizes the topic but also showcases your presentation skills.
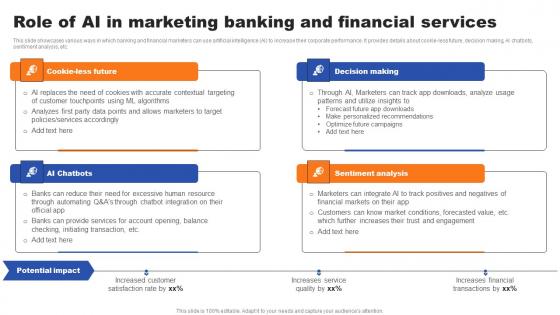
Role Of AI In Marketing Banking And Financial Services Ppt Infographic Template Ideas PDF
This slide showcases various ways in which banking and financial marketers can use artificial intelligence AI to increase their corporate performance. It provides details about cookie-less future, decision making, AI chatbots, sentiment analysis, etc. From laying roadmaps to briefing everything in detail, our templates are perfect for you. You can set the stage with your presentation slides. All you have to do is download these easy-to-edit and customizable templates. Role Of AI In Marketing Banking And Financial Services Ppt Infographic Template Ideas PDF will help you deliver an outstanding performance that everyone would remember and praise you for. Do download this presentation today.
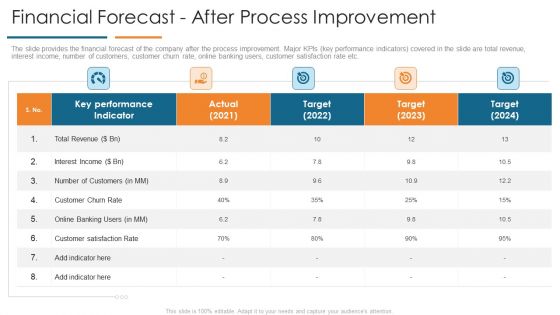
Financial Forecast After Process Improvement Develop Organizational Productivity By Enhancing Business Process Brochure PDF
The slide provides the financial forecast of the company after the process improvement. Major KPIs key performance indicators covered in the slide are total revenue, interest income, number of customers, customer churn rate, online banking users, customer satisfaction rate etc. Deliver an awe inspiring pitch with this creative financial forecast after process improvement develop organizational productivity by enhancing business process brochure pdf bundle. Topics like revenue, interest income, performance indicator, actual, target can be discussed with this completely editable template. It is available for immediate download depending on the needs and requirements of the user.

Post Implementation Other Operation And Financial Kpis Ppt Infographic Template PDF
The slide provides five years graphs 2020F-2024F forecasted number of major KPIs key performance indicators, that might help to track the performance of ABC Railway. Covered KPIs include Revenue, Total Passengers, operating income, customer satisfaction rate etc. Deliver an awe inspiring pitch with this creative post implementation other operation and financial kpis ppt infographic template pdf bundle. Topics like operating income, revenue, customer satisfaction can be discussed with this completely editable template. It is available for immediate download depending on the needs and requirements of the user.

Building Brand Image Of A Railway Firm Other Operational And Financial Kpis Structure PDF
The slide provides five years graphs of major KPIs key performance indicators, which might help the company to track its performance. Covered KPIs include revenue, total passengers, operating income, customer satisfaction rate etc. Deliver and pitch your topic in the best possible manner with this building brand image of a railway firm other operational and financial kpis structure pdf. Use them to share invaluable insights on operating income, customer satisfaction, revenue and impress your audience. This template can be altered and modified as per your expectations. So, grab it now.

Marketing Performance Statistical Analysis Customers And Revenue Report Ppt PowerPoint Presentation Outline Shapes
This is a marketing performance statistical analysis customers and revenue report ppt powerpoint presentation outline shapes. This is a four stage process. The stages in this process are marketing analytics, marketing performance, marketing discovery.

Guy Kawasaki 10 20 30 Rule Investor Financial Projections And Key Metrics Rules PDF
This slide illustrates key performance indicators highlighting the financial projections of the company post product launch. KPIs covered here are revenue growth, profit margin along with customer acquisition cost.Deliver an awe inspiring pitch with this creative guy kawasaki 10 20 30 rule investor financial projections and key metrics rules pdf bundle. Topics like financial projections and key metrics can be discussed with this completely editable template. It is available for immediate download depending on the needs and requirements of the user.

Ten Slides Guy Kawasaki Investor Deck Financial Projections And Key Metrics Structure PDF
This slide illustrates key performance indicators highlighting the financial projections of the company post product launch. KPIs covered here are revenue growth, profit margin along with customer acquisition cost. Deliver an awe-inspiring pitch with this creative ten slides guy kawasaki investor deck financial projections and key metrics structure pdf. bundle. Topics like financial projections and key metrics can be discussed with this completely editable template. It is available for immediate download depending on the needs and requirements of the user.
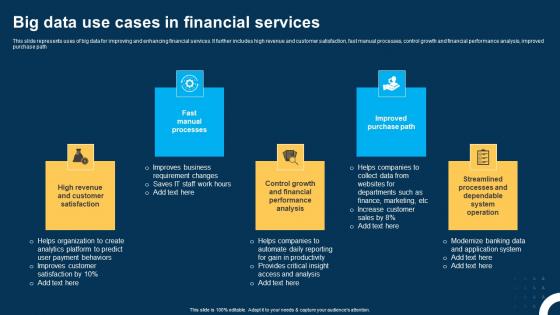
Big Data Use Cases In Financial Services Ppt Layouts Infographic Template pdf
This slide represents uses of big data for improving and enhancing financial services. It further includes high revenue and customer satisfaction, fast manual processes, control growth and financial performance analysis, improved purchase path. Showcasing this set of slides titled Big Data Use Cases In Financial Services Ppt Layouts Infographic Template pdf. The topics addressed in these templates are Fast Manual Processes, Improved Purchase Path, High Revenue. All the content presented in this PPT design is completely editable. Download it and make adjustments in color, background, font etc. as per your unique business setting.

Elevator Pitch Deck To Raise Funds Key Financial Projections For Upcoming Years Pictures PDF
This slide illustrates key performance indicators highlighting the financial projections for upcoming years. KPIs covered here are revenue breakdown, profitability and cash flow. Deliver an awe inspiring pitch with this creative elevator pitch deck to raise funds key financial projections for upcoming years pictures pdf bundle. Topics like key financial projections for upcoming years can be discussed with this completely editable template. It is available for immediate download depending on the needs and requirements of the user.

Accounting Pitch Deck Key Financial Projections For Upcoming Years Designs PDF
This slide illustrates key performance indicators highlighting the financial projections for upcoming years. KPIs covered here are revenue breakdown, profitability and cash flow.Deliver an awe inspiring pitch with this creative accounting pitch deck key financial projections for upcoming years designs pdf bundle. Topics like revenue breakdown, profitability, cumulative cash flow can be discussed with this completely editable template. It is available for immediate download depending on the needs and requirements of the user.
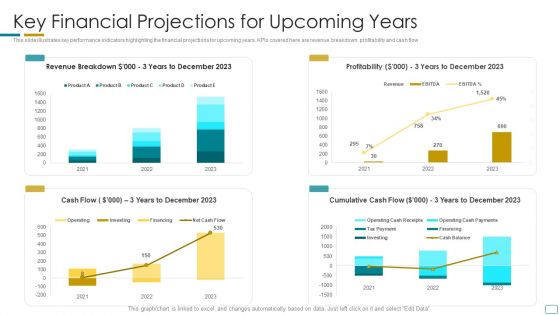
Fundraising Pitch Deck For Startup Company Key Financial Projections For Upcoming Years Brochure PDF
This slide illustrates key performance indicators highlighting the financial projections for upcoming years. KPIs covered here are revenue breakdown, profitability and cash flow Deliver an awe inspiring pitch with this creative fundraising pitch deck for startup company key financial projections for upcoming years brochure pdf bundle. Topics like profitability, revenue can be discussed with this completely editable template. It is available for immediate download depending on the needs and requirements of the user.
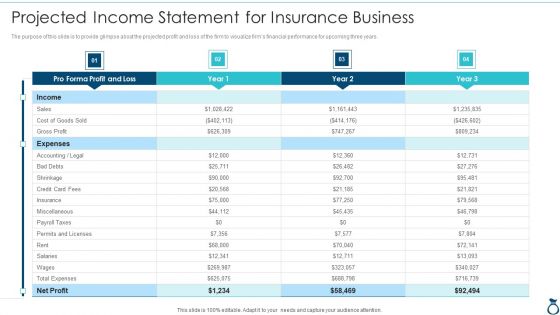
Financial Services Advisory Business Plan Projected Income Statement For Insurance Infographics PDF
The purpose of this slide is to provide glimpse about the projected profit and loss of the firm to visualize firms financial performance for upcoming three years. Deliver an awe inspiring pitch with this creative Financial Services Advisory Business Plan Projected Income Statement For Insurance Infographics PDF bundle. Topics like Profit And Loss, Insurance, Rent, Cost, Gross Profit can be discussed with this completely editable template. It is available for immediate download depending on the needs and requirements of the user.
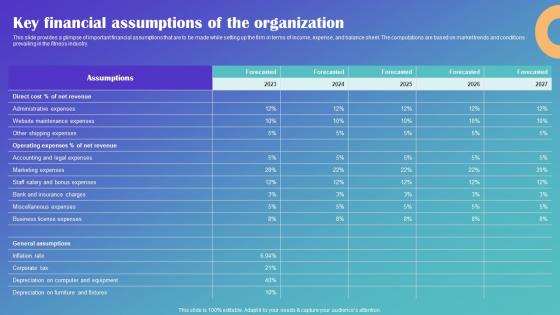
Key Financial Assumptions Of The Organization Drop Shipping Business Plan Pictures Pdf
This slide provides a glimpse of important financial assumptions that are to be made while setting up the firm in terms of income, expense, and balance sheet. The computations are based on market trends and conditions prevailing in the fitness industry. From laying roadmaps to briefing everything in detail, our templates are perfect for you. You can set the stage with your presentation slides. All you have to do is download these easy-to-edit and customizable templates. Key Financial Assumptions Of The Organization Drop Shipping Business Plan Pictures Pdf will help you deliver an outstanding performance that everyone would remember and praise you for. Do download this presentation today.
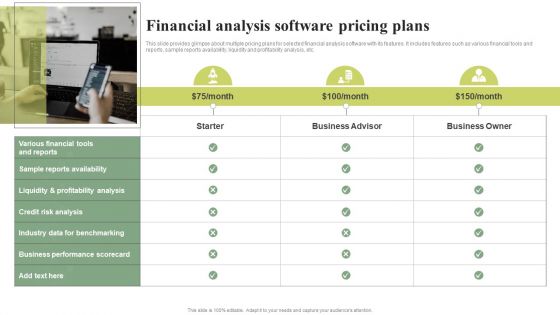
Financial Analysis Software Pricing Plans Effective Planning For Monetary Strategy Mockup PDF
This slide provides glimpse about multiple pricing plans for selected financial analysis software with its features. It includes features such as various financial tools and reports, sample reports availability, liquidity and profitability analysis, etc.From laying roadmaps to briefing everything in detail, our templates are perfect for you. You can set the stage with your presentation slides. All you have to do is download these easy-to-edit and customizable templates. Financial Analysis Software Pricing Plans Effective Planning For Monetary Strategy Mockup PDF will help you deliver an outstanding performance that everyone would remember and praise you for. Do download this presentation today.
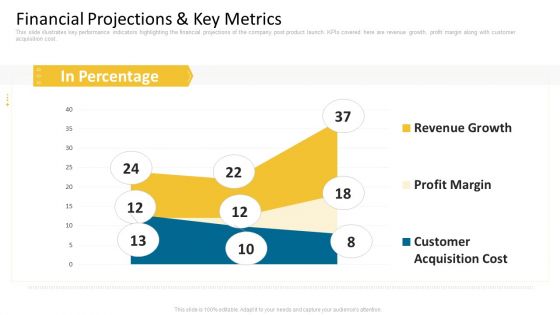
Guy Kawasaki New Venture Pitch PPT Financial Projections And Key Metrics Summary PDF
This slide illustrates key performance indicators highlighting the financial projections of the company post product launch. KPIs covered here are revenue growth, profit margin along with customer acquisition cost. Deliver and pitch your topic in the best possible manner with this guy kawasaki new venture pitch ppt financial projections and key metrics summary pdf. Use them to share invaluable insights on revenue growth, profit margin, customer acquisition cost and impress your audience. This template can be altered and modified as per your expectations. So, grab it now.

Analyzing Brands Key Financial Indicators Improving Customer Interaction Through Microsoft Pdf
This slide showcases assessing key indicators for measuring financial performance of brand. It provides details about turnover, marketing costs, sales, administrative expenses, profit, percentage turnover, trade debtor days, headcount, etc.Find highly impressive Analyzing Brands Key Financial Indicators Improving Customer Interaction Through Microsoft Pdf on Slidegeeks to deliver a meaningful presentation. You can save an ample amount of time using these presentation templates. No need to worry to prepare everything from scratch because Slidegeeks experts have already done a huge research and work for you. You need to download Analyzing Brands Key Financial Indicators Improving Customer Interaction Through Microsoft Pdf for your upcoming presentation. All the presentation templates are 100Precent editable and you can change the color and personalize the content accordingly. Download now.
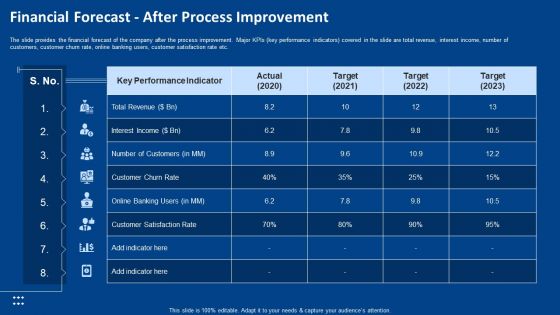
Procedure Advancements Banking Department Financial Forecast After Process Improvement Template PDF
The slide provides the financial forecast of the company after the process improvement. Major KPIs key performance indicators covered in the slide are total revenue, interest income, number of customers, customer churn rate, online banking users, customer satisfaction rate etc. Deliver and pitch your topic in the best possible manner with this procedure advancements banking department financial forecast after process improvement template pdf. Use them to share invaluable insights on total revenue, interest income, customer satisfaction rate, customer churn rate, online banking users and impress your audience. This template can be altered and modified as per your expectations. So, grab it now.
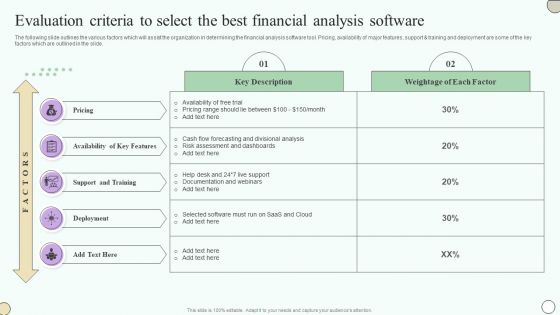
Estimating Business Overall Evaluation Criteria To Select The Best Financial Analysis Software Infographics PDF
The following slide outlines the various factors which will assist the organization in determining the financial analysis software tool. Pricing, availability of major features, support and training and deployment are some of the key factors which are outlined in the slide. From laying roadmaps to briefing everything in detail, our templates are perfect for you. You can set the stage with your presentation slides. All you have to do is download these easy-to-edit and customizable templates. Estimating Business Overall Evaluation Criteria To Select The Best Financial Analysis Software Infographics PDF will help you deliver an outstanding performance that everyone would remember and praise you for. Do download this presentation today.

Customer Goods Production Company Financial Summary With Operating Cash Flow Infographics PDF
This slide highlights company financial summary in tabular format which includes net sales, operating income, net earning attributable, diluted net earning, operating cash flow and dividends per share. From laying roadmaps to briefing everything in detail, our templates are perfect for you. You can set the stage with your presentation slides. All you have to do is download these easy-to-edit and customizable templates. Customer Goods Production Company Financial Summary With Operating Cash Flow Infographics PDF will help you deliver an outstanding performance that everyone would remember and praise you for. Do download this presentation today.

Company Financial Forecast And Essential Metrics Ppt Model Design Templates PDF
This slide shows the projections of the financials of a company with the key performance indicators to know exactly where the business stands and what needs to be enhanced or reduced to make the business profitable. Showcasing this set of slides titled Company Financial Forecast And Essential Metrics Ppt Model Design Templates PDF. The topics addressed in these templates are Budget, Income, Expense, 2018 To 2022. All the content presented in this PPT design is completely editable. Download it and make adjustments in color, background, font etc. as per your unique business setting.
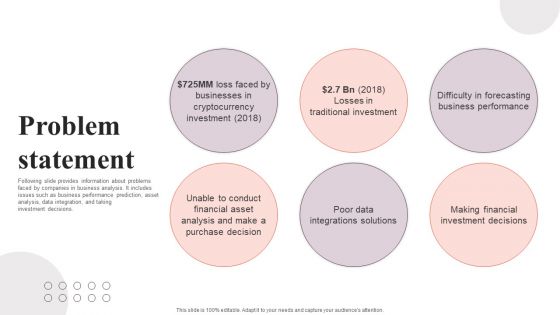
Financial Analytics Solution Investor Funding Elevator Pitch Deck Problem Statement Formats PDF
Following slide provides information about problems faced by companies in business analysis. It includes issues such as business performance prediction, asset analysis, data integration, and taking investment decisions. Make sure to capture your audiences attention in your business displays with our gratis customizable Financial Analytics Solution Investor Funding Elevator Pitch Deck Problem Statement Formats PDF. These are great for business strategies, office conferences, capital raising or task suggestions. If you desire to acquire more customers for your tech business and ensure they stay satisfied, create your own sales presentation with these plain slides.

Roadmap For Financial Accounting Transformation Finance Transformation Program Checklist Related Themes PDF
The slide provides program checklist related to forecasting and strategy under finance transformation. The slide provides the key performance indicators revenue, operating profit, net profit, return on investment, data accuracy etc. and requirement of forecasting and strategy implementation for each KPI. Deliver and pitch your topic in the best possible manner with this roadmap for financial accounting transformation finance transformation program checklist related themes pdf. Use them to share invaluable insights on revenue, operating profit, net profit, return on investment, data accuracy and impress your audience. This template can be altered and modified as per your expectations. So, grab it now.
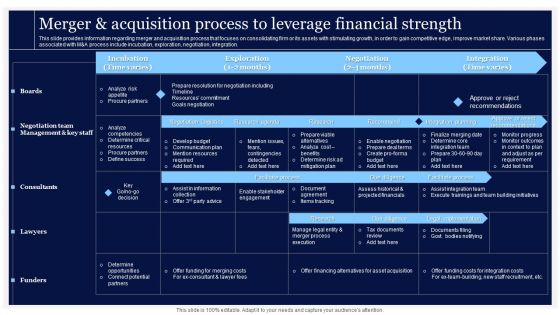
Critical Initiatives To Deploy Merger And Acquisition Process To Leverage Financial Infographics PDF
This slide provides information regarding merger and acquisition process that focuses on consolidating firm or its assets with stimulating growth, in order to gain competitive edge, improve market share. Various phases associated with MandA process include incubation, exploration, negotiation, integration. From laying roadmaps to briefing everything in detail, our templates are perfect for you. You can set the stage with your presentation slides. All you have to do is download these easy-to-edit and customizable templates. Critical Initiatives To Deploy Merger And Acquisition Process To Leverage Financial Infographics PDF will help you deliver an outstanding performance that everyone would remember and praise you for. Do download this presentation today.
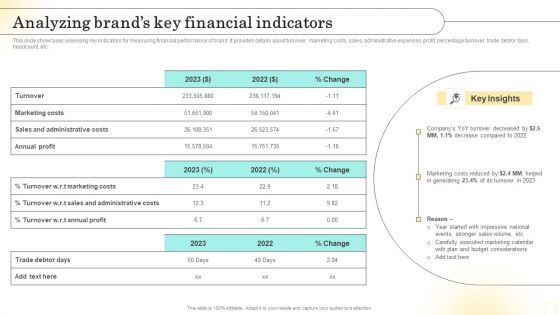
Emotional Marketing Strategy To Nurture Analyzing Brands Key Financial Indicators Demonstration PDF
This slide showcases assessing key indicators for measuring financial performance of brand. It provides details about turnover, marketing costs, sales, administrative expenses, profit, percentage turnover, trade debtor days, headcount, etc. Create an editable Emotional Marketing Strategy To Nurture Analyzing Brands Key Financial Indicators Demonstration PDF that communicates your idea and engages your audience. Whether youre presenting a business or an educational presentation, pre-designed presentation templates help save time. Emotional Marketing Strategy To Nurture Analyzing Brands Key Financial Indicators Demonstration PDF is highly customizable and very easy to edit, covering many different styles from creative to business presentations. Slidegeeks has creative team members who have crafted amazing templates. So, go and get them without any delay.

Apple Emotional Marketing Strategy Analyzing Brands Key Financial Indicators Rules PDF
This slide showcases assessing key indicators for measuring financial performance of brand. It provides details about turnover, marketing costs, sales, administrative expenses, profit, percentage turnover, trade debtor days, headcount, etc. Here you can discover an assortment of the finest PowerPoint and Google Slides templates. With these templates, you can create presentations for a variety of purposes while simultaneously providing your audience with an eye catching visual experience. Download Apple Emotional Marketing Strategy Analyzing Brands Key Financial Indicators Rules PDF to deliver an impeccable presentation. These templates will make your job of preparing presentations much quicker, yet still, maintain a high level of quality. Slidegeeks has experienced researchers who prepare these templates and write high quality content for you. Later on, you can personalize the content by editing the Apple Emotional Marketing Strategy Analyzing Brands Key Financial Indicators Rules PDF.

Marketing Commodities And Offerings Analyzing Brands Key Financial Indicators Demonstration PDF
This slide showcases assessing key indicators for measuring financial performance of brand. It provides details about turnover, marketing costs, sales, administrative expenses, profit, percentage turnover, trade debtor days, headcount, etc. Here you can discover an assortment of the finest PowerPoint and Google Slides templates. With these templates, you can create presentations for a variety of purposes while simultaneously providing your audience with an eye catching visual experience. Download Marketing Commodities And Offerings Analyzing Brands Key Financial Indicators Demonstration PDF to deliver an impeccable presentation. These templates will make your job of preparing presentations much quicker, yet still, maintain a high level of quality. Slidegeeks has experienced researchers who prepare these templates and write high quality content for you. Later on, you can personalize the content by editing the Marketing Commodities And Offerings Analyzing Brands Key Financial Indicators Demonstration PDF.
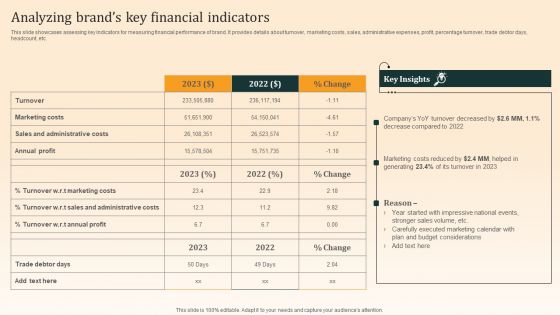
Nike Emotional Branding Strategy Analyzing Brands Key Financial Indicators Summary PDF
This slide showcases assessing key indicators for measuring financial performance of brand. It provides details about turnover, marketing costs, sales, administrative expenses, profit, percentage turnover, trade debtor days, headcount, etc. Create an editable Nike Emotional Branding Strategy Analyzing Brands Key Financial Indicators Summary PDF that communicates your idea and engages your audience. Whether youre presenting a business or an educational presentation, pre designed presentation templates help save time. Nike Emotional Branding Strategy Analyzing Brands Key Financial Indicators Summary PDF is highly customizable and very easy to edit, covering many different styles from creative to business presentations. Slidegeeks has creative team members who have crafted amazing templates. So, go and get them without any delay.
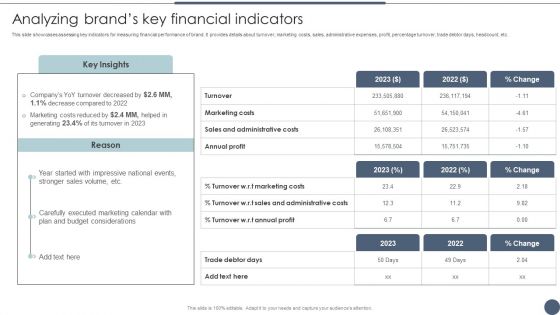
Analyzing Brands Key Financial Indicators Utilizing Emotional And Rational Branding For Improved Consumer Outreach Template PDF
This slide showcases assessing key indicators for measuring financial performance of brand. It provides details about turnover, marketing costs, sales, administrative expenses, profit, percentage turnover, trade debtor days, headcount, etc. Slidegeeks is one of the best resources for PowerPoint templates. You can download easily and regulate Analyzing Brands Key Financial Indicators Utilizing Emotional And Rational Branding For Improved Consumer Outreach Template PDF for your personal presentations from our wonderful collection. A few clicks is all it takes to discover and get the most relevant and appropriate templates. Use our Templates to add a unique zing and appeal to your presentation and meetings. All the slides are easy to edit and you can use them even for advertisement purposes.

Companys Financial Comparison Before And After Implementation Of Promotional Strategies Infographics PDF
This slide shows the comparison of companys performance before and after the product marketing strategy implementation. It shows the comparison based on parameters such as product demand, number of product sold, total sale, lead conversion rate, customer retention rate, per customer acquisition cost etc. If you are looking for a format to display your unique thoughts, then the professionally designed Companys Financial Comparison Before And After Implementation Of Promotional Strategies Infographics PDF is the one for you. You can use it as a Google Slides template or a PowerPoint template. Incorporate impressive visuals, symbols, images, and other charts. Modify or reorganize the text boxes as you desire. Experiment with shade schemes and font pairings. Alter, share or cooperate with other people on your work. Download Companys Financial Comparison Before And After Implementation Of Promotional Strategies Infographics PDF and find out how to give a successful presentation. Present a perfect display to your team and make your presentation unforgettable.

Four Phases Of Business Turnabout Strategy And Execution For Financial Restructuring Clipart PDF
This slide covers turnaround plan to avoid insolvency. It includes cash management, providing rapid diagnostic, perform clear data analysis, prioritise opportunities and benefit from cash achievements.Presenting Four Phases Of Business Turnabout Strategy And Execution For Financial Restructuring Clipart PDF to dispense important information. This template comprises four stages. It also presents valuable insights into the topics including Analysis The Business, Develop Restructuring, Implementation. This is a completely customizable PowerPoint theme that can be put to use immediately. So, download it and address the topic impactfully.

Strategic Financial Planning And Administration Ppt Powerpoint Presentation Complete Deck With Slides
This is another content ready PowerPoint Template to help you assess your business progress. This Strategic Financial Planning And Administration Ppt Powerpoint Presentation Complete Deck With Slides comprises visuals to evaluate key metrices you may wish to track. You can incorporate this ready made PowerPoint Diagram to view the performing and non performing areas of your business domain. In sixty nine slides,this complete deck is also a design marvel with its well researched color theme. The presentation template is also equipped to do this with its 100 percent editable and customizable capability. Download now.

Pitch Presentation Raise Money Spot Market Operational And Financial Overview Ppt Infographics Guide PDF
The slide provides a brief overview of the companys operations introduction, mission and vision statement and financials Revenue, EBIT, Net income and Non Performing Assets. Deliver an awe-inspiring pitch with this creative pitch presentation raise money spot market operational and financial overview ppt infographics guide pdf bundle. Topics like performing assets, mission, vision can be discussed with this completely editable template. It is available for immediate download depending on the needs and requirements of the user.

Investment Pitch For Aftermarket Competitive Analysis Financial And Operational Data Ppt PowerPoint Presentation File Structure PDF
Presenting this set of slides with name investment pitch for aftermarket competitive analysis financial and operational data ppt powerpoint presentation file structure pdf. The topics discussed in these slides are competitive factor, competitor, existence, quality consumer feedback, interest rate, revenue, interest income, non performing loans, employee count. This is a completely editable PowerPoint presentation and is available for immediate download. Download now and impress your audience.
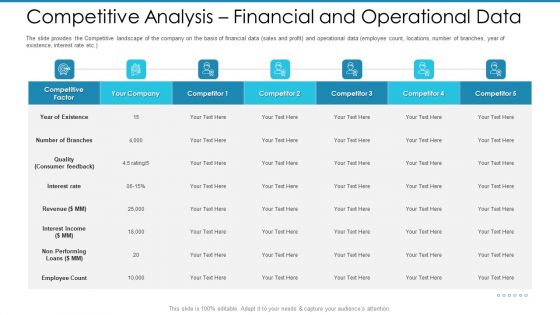
Post Initial Pubic Offering Market Pitch Deck Competitive Analysis Financial And Operational Data Diagrams PDF
The slide provides the Competitive landscape of the company on the basis of financial data sales and profit and operational data employee count, locations, number of branches, year of existence, interest rate etc.Deliver an awe-inspiring pitch with this creative post initial pubic offering market pitch deck competitive analysis financial and operational data diagrams pdf. bundle. Topics like interest rate, revenue interest income, non performing can be discussed with this completely editable template. It is available for immediate download depending on the needs and requirements of the user.
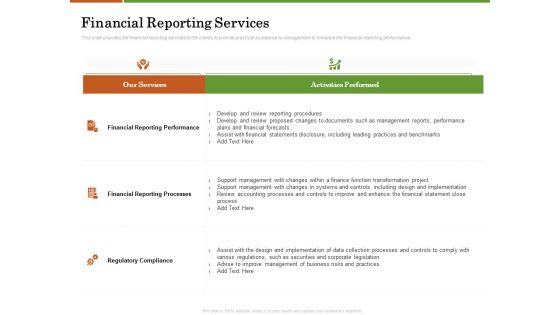
Accounting Advisory Services For Organization Financial Reporting Services Ppt PowerPoint Presentation Outline Portrait PDF
Presenting this set of slides with name accounting advisory services for organization financial reporting services ppt powerpoint presentation outline portrait pdf. The topics discussed in these slides are our services, activities performed, financial reporting performance, financial reporting processes, regulatory compliance. This is a completely editable PowerPoint presentation and is available for immediate download. Download now and impress your audience.

Financial Management Strategic Plan For Startup Success Ppt Infographics Model Pdf
This slide presents financial management action plan for startup company, helpful in achieving finance goals. It includes actions such as revising startup goals, creating budget, forecasting cash flow and monitoring performance. Showcasing this set of slides titled Financial Management Strategic Plan For Startup Success Ppt Infographics Model Pdf. The topics addressed in these templates are Revising Startup Goals, Creating Budget, Forecasting Cash Flow. All the content presented in this PPT design is completely editable. Download it and make adjustments in color, background, font etc. as per your unique business setting.

Corporate Execution And Financial Liability Report Table Of Contents Diagrams PDF
Presenting this set of slides with name corporate execution and financial liability report table of contents diagrams pdf. This is a seven stage process. The stages in this process are financial, performance, evaluation, social, responsibility. This is a completely editable PowerPoint presentation and is available for immediate download. Download now and impress your audience.

Key Financial Assumptions For House Flipping Start Up Real Estate Renovation Information Pdf
This slide depicts the important financial assumptions that are to be made while setting house flipping business in terms of income, expense, and balance sheet. The computations are based on market trends and conditions prevailing in the real estate industry. This Key Financial Assumptions For House Flipping Start Up Real Estate Renovation Information Pdf from Slidegeeks makes it easy to present information on your topic with precision. It provides customization options, so you can make changes to the colors, design, graphics, or any other component to create a unique layout. It is also available for immediate download, so you can begin using it right away. Slidegeeks has done good research to ensure that you have everything you need to make your presentation stand out. Make a name out there for a brilliant performance.
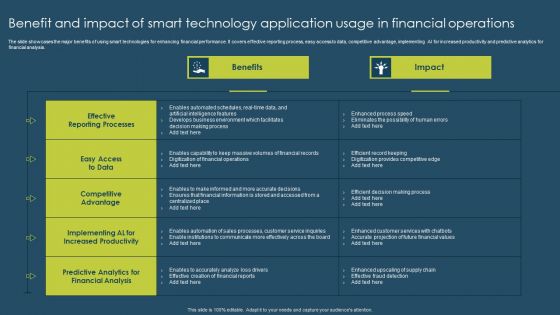
Benefit And Impact Of Smart Technology Application Usage In Financial Operations Summary PDF
The slide showcases the major benefits of using smart technologies for enhancing financial performance. It covers effective reporting process, easy access to data, competitive advantage, implementing AI for increased productivity and predictive analytics for financial analysis. Showcasing this set of slides titled Benefit And Impact Of Smart Technology Application Usage In Financial Operations Summary PDF. The topics addressed in these templates are Benefits, Impact. All the content presented in this PPT design is completely editable. Download it and make adjustments in color, background, font etc. as per your unique business setting.
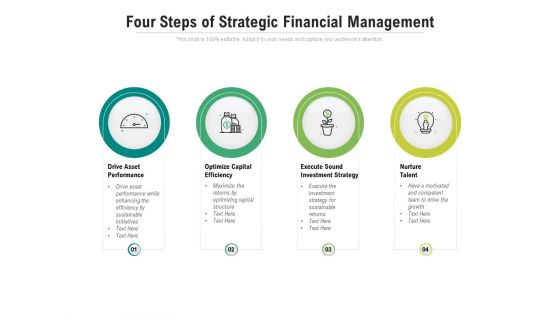
Four Steps Of Strategic Financial Management Ppt PowerPoint Presentation Infographic Template Graphic Images
Presenting this set of slides with name four steps of strategic financial management ppt powerpoint presentation infographic template graphic images. This is a four stage process. The stages in this process are drive asset performance, optimize capital efficiency, execute sound investment strategy, nurture talen. This is a completely editable PowerPoint presentation and is available for immediate download. Download now and impress your audience.

Redis Cache Data Structure IT Performance Memory And Activity Metrics Introduction PDF
This slide depicts performance memory and activity metrics dashboard for Redis cache, including cache hit ratio, slow log, latency, used memory, etc. This is a redis cache data structure it performance memory and activity metrics introduction pdf template with various stages. Focus and dispense information on one stages using this creative set, that comes with editable features. It contains large content boxes to add your information on topics like performance memory and activity metrics dashboard for redis cache. You can also showcase facts, figures, and other relevant content using this PPT layout. Grab it now.
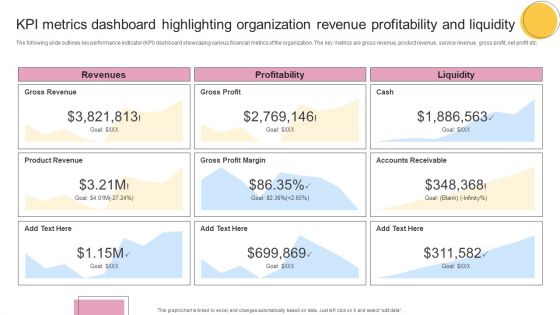
KPI Metrics Dashboard Highlighting Organization Revenue Profitability And Liquidity Formats PDF
The following slide outlines key performance indicator KPI dashboard showcasing various financial metrics of the organization. The key metrics are gross revenue, product revenue, service revenue, gross profit, net profit etc. From laying roadmaps to briefing everything in detail, our templates are perfect for you. You can set the stage with your presentation slides. All you have to do is download these easy to edit and customizable templates. KPI Metrics Dashboard Highlighting Organization Revenue Profitability And Liquidity Formats PDF will help you deliver an outstanding performance that everyone would remember and praise you for. Do download this presentation today.
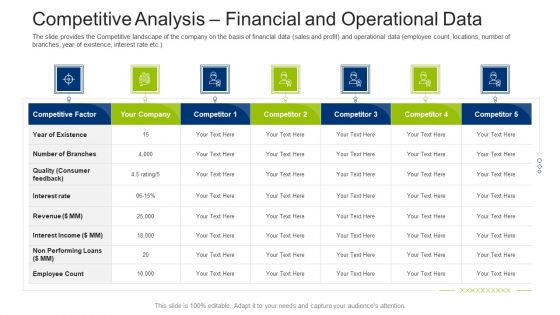
Investment Fundraising Pitch Deck From Stock Market Competitive Analysis Financial And Operational Data Template PDF
The slide provides the Competitive landscape of the company on the basis of financial data sales and profit and operational data employee count, locations, number of branches, year of existence, interest rate etc. Deliver and pitch your topic in the best possible manner with this investment fundraising pitch deck from stock market competitive analysis financial and operational data template pdf. Use them to share invaluable insights on competitive factor, performing, revenue, interest rate, employee count and impress your audience. This template can be altered and modified as per your expectations. So, grab it now.
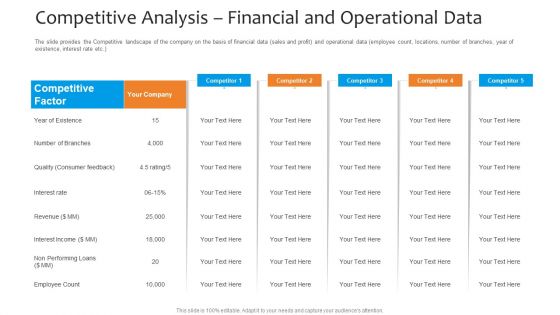
Funding Pitch To Raise Funds From PE Competitive Analysis Financial And Operational Data Background PDF
The slide provides the Competitive landscape of the company on the basis of financial data sales and profit and operational data employee count, locations, number of branches, year of existence, interest rate etc. Deliver and pitch your topic in the best possible manner with this funding pitch to raise funds from pe competitive analysis financial and operational data background pdf. Use them to share invaluable insights on competitive factor, performing, revenue, interest rate, employee count and impress your audience. This template can be altered and modified as per your expectations. So, grab it now.

Regulatory Compliance For Finance Business Startup Strategy For Launching A Financial Strategy SS V
This slide showcases legal and regulatory considerations to ensure compliance with standards. It includes elements such as legal structure and licensing, AML, financial reporting, compliance officers, customer disclosures and data protection and privacy. This Regulatory Compliance For Finance Business Startup Strategy For Launching A Financial Strategy SS V from Slidegeeks makes it easy to present information on your topic with precision. It provides customization options, so you can make changes to the colors, design, graphics, or any other component to create a unique layout. It is also available for immediate download, so you can begin using it right away. Slidegeeks has done good research to ensure that you have everything you need to make your presentation stand out. Make a name out there for a brilliant performance.

Revenue Contribution From Top Engineering Products Engineering Company Financial Analysis Report Infographics PDF
The following slide highlights the revenue contribution of engineering products, It shows sales amount form the top five products in millions along with key insights. This Revenue Contribution From Top Engineering Products Engineering Company Financial Analysis Report Infographics PDF from Slidegeeks makes it easy to present information on your topic with precision. It provides customization options, so you can make changes to the colors, design, graphics, or any other component to create a unique layout. It is also available for immediate download, so you can begin using it right away. Slidegeeks has done good research to ensure that you have everything you need to make your presentation stand out. Make a name out there for a brilliant performance.

Financial Information Pie Donut Diagram 6 Stages How To Business Plan PowerPoint Slides
We present our financial information pie donut diagram 6 stages how to business plan PowerPoint Slides.Download and present our Competition PowerPoint Templates because Our PowerPoint Templates and Slides will definately Enhance the stature of your presentation. Adorn the beauty of your thoughts with their colourful backgrounds. Present our Marketing PowerPoint Templates because Our PowerPoint Templates and Slides are conceived by a dedicated team. Use them and give form to your wondrous ideas. Download our Process and Flows PowerPoint Templates because Our PowerPoint Templates and Slides will effectively help you save your valuable time. They are readymade to fit into any presentation structure. Present our Circle Charts PowerPoint Templates because Our PowerPoint Templates and Slides will let you meet your Deadlines. Present our Business PowerPoint Templates because They will bring a lot to the table. Their alluring flavours will make your audience salivate.Use these PowerPoint slides for presentations relating to chart, graph, pie, 3d, diagram, graphic, icon, control, business, data, profit, market, sales, display, corporate, concept, render, success, presentation, finance, report, marketing, accounting, management, piece, strategy, money, growth, company, competition, progress, account, sheet, part, information, investment, improvement, banking, index, financial, reflect, results, performance, exchange. The prominent colors used in the PowerPoint template are Blue, Black, Gray.

Structre 7 Staged For Independent Process Ppt Financial Advisor Business Plan PowerPoint Slides
We present our structre 7 staged for independent process ppt financial advisor business plan PowerPoint Slides.Download our Pyramids PowerPoint Templates because Our PowerPoint Templates and Slides will embellish your thoughts. See them provide the desired motivation to your team. Download and present our Process and Flows PowerPoint Templates because Our PowerPoint Templates and Slides are the chords of your song. String them along and provide the lilt to your views. Present our Signs PowerPoint Templates because You should Press the right buttons with our PowerPoint Templates and Slides. They will take your ideas down the perfect channel. Download and present our Layers PowerPoint Templates because Our PowerPoint Templates and Slides offer you the widest possible range of options. Download our Business PowerPoint Templates because you can Break through with our PowerPoint Templates and Slides. Bring down the mental barriers of your audience.Use these PowerPoint slides for presentations relating to pyramidal, pyramid, chart, 3d, vector, leadership, statistics, green, triangle, red, business, hierarchy, ranking, presentation, symbol, template, diagram, data, multilevel, marketing, level, top, abstract, management, graph, illustration, icon, stage, object, strategy, seven, group, growth, text, organization, progress, construction, structure, results, performance. The prominent colors used in the PowerPoint template are Blue, Black, Gray.
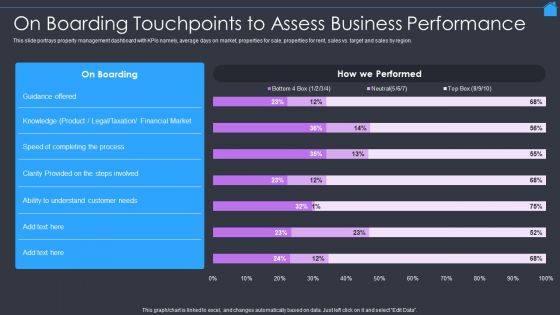
Marketing Strategy To Enhance Real Estate Sales On Boarding Touchpoints To Assess Business Performance Guidelines PDF
This slide portrays property management dashboard with KPIs namely, average days on market, properties for sale, properties for rent, sales vs. target and sales by region. Deliver an awe inspiring pitch with this creative Marketing Strategy To Enhance Real Estate Sales On Boarding Touchpoints To Assess Business Performance Guidelines PDF bundle. Topics like Financial Market, Taxation, Product can be discussed with this completely editable template. It is available for immediate download depending on the needs and requirements of the user.

Overview Of Organizational Kpi Metrics Dashboard Highlighting Organization Revenue Brochure PDF
The following slide outlines key performance indicator KPI dashboard showcasing various financial metrics of the organization. The key metrics are gross revenue, product revenue, service revenue, gross profit, net profit etc. If your project calls for a presentation, then Slidegeeks is your go-to partner because we have professionally designed, easy-to-edit templates that are perfect for any presentation. After downloading, you can easily edit Overview Of Organizational Kpi Metrics Dashboard Highlighting Organization Revenue Brochure PDF and make the changes accordingly. You can rearrange slides or fill them with different images. Check out all the handy templates.

Strategy For Managing Ecommerce Returns Reverse Logistics Dashboard Days Template PDF
Deliver an awe inspiring pitch with this creative strategy for managing ecommerce returns reverse logistics dashboard days template pdf bundle. Topics like global, financial, performance, metric, inventory can be discussed with this completely editable template. It is available for immediate download depending on the needs and requirements of the user.

 Home
Home