Chart analysis PowerPoint Presentation Templates and Google Slides
-
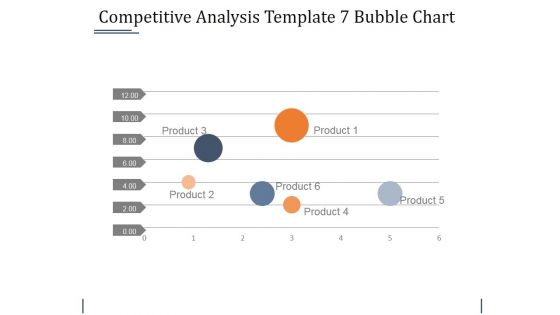
Competitive Analysis Template 7 Bubble Chart Ppt PowerPoint Presentation Deck
This is a competitive analysis template 7 bubble chart ppt powerpoint presentation deck. This is a six stage process. The stages in this process are users interface, data import, example, pricing, support, update, tutorials, easy to use, table.
-
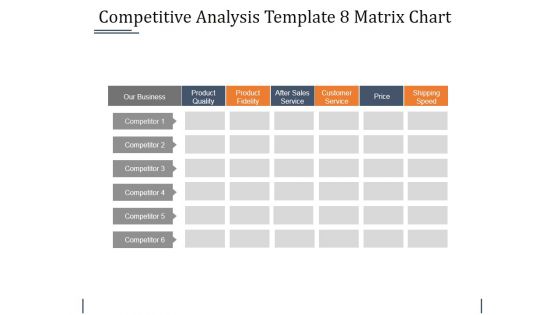
Competitive Analysis Template 8 Matrix Chart Ppt PowerPoint Presentation Designs Download
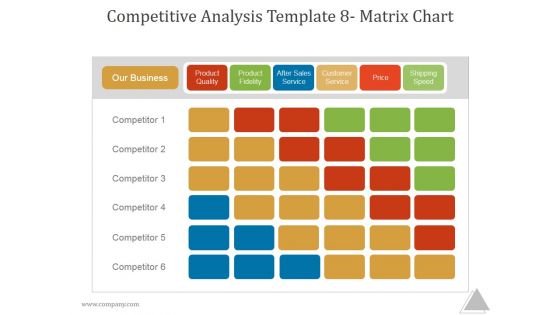
This is a competitive analysis template 8 matrix chart ppt powerpoint presentation designs download. This is a six stage process. The stages in this process are product quality, product fidelity, after sales service, customer service, price, shipping speed.
-
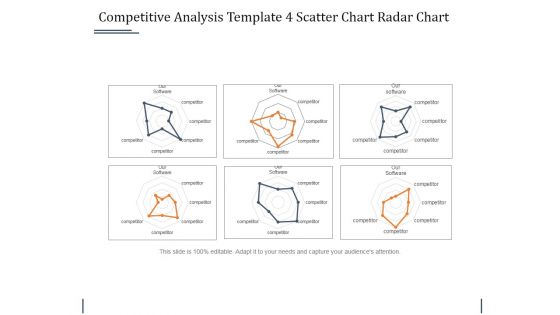
Competitive Analysis Template 4 Scatter Chart Radar Chart Ppt PowerPoint Presentation Background Image
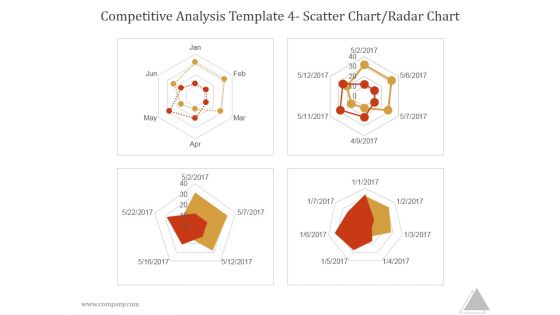
This is a competitive analysis template 4 scatter chart radar chart ppt powerpoint presentation background image. This is a four stage process. The stages in this process are jan, feb ,mar, apr, may.
-
Competitive Analysis Template 6 Scatter Chart Ppt PowerPoint Presentation Shapes
This is a competitive analysis template 6 scatter chart ppt powerpoint presentation shapes. This is a one stage process. The stages in this process are users interface, data import, example, pricing, support update, tutorials, easy to use.
-
Competitive Analysis Template 8 Matrix Chart Ppt PowerPoint Presentation Templates
This is a competitive analysis template 8 matrix chart ppt powerpoint presentation templates. This is a six stage process. The stages in this process are our business, product quality, product fidelity, after sales service, customer service, price, shipping speed, competitor.
-
Portative Analysis Template 7 Bubble Chart Ppt PowerPoint Presentation Picture
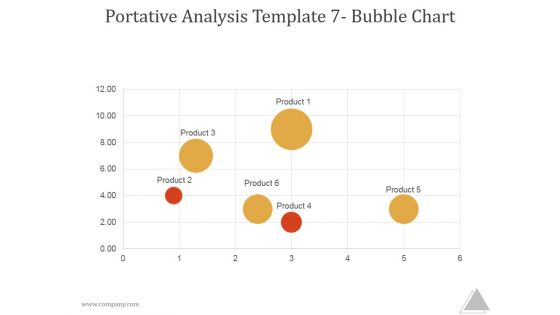
This is a portative analysis template 7 bubble chart ppt powerpoint presentation picture. This is a six stage process. The stages in this process are product, business, marketing, management.
-
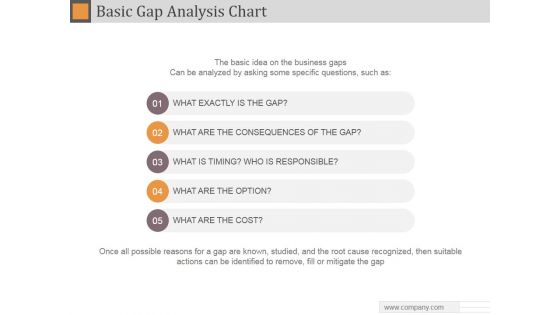
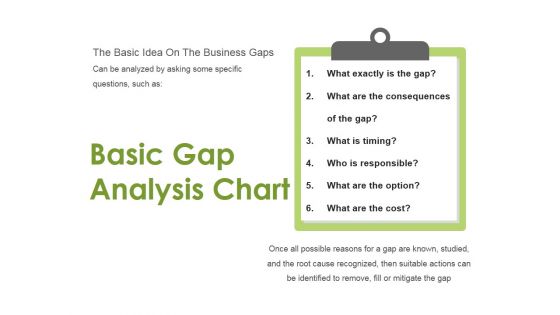
Basic Gap Analysis Chart Ppt PowerPoint Presentation Microsoft
This is a basic gap analysis chart ppt powerpoint presentation microsoft. This is a five stage process. The stages in this process are what exactly is the gap, what are the consequences of the gap, what is timing who is responsible, what are the option, what are the cost.
-
Competitive Analysis Matrix Chart Ppt PowerPoint Presentation Inspiration
This is a competitive analysis matrix chart ppt powerpoint presentation inspiration. This is a six stage process. The stages in this process are product quality, product fidelity, after sales service, customer service, price, shipping speed.
-
Competitive Analysis Scatter Chart Radar Chart Ppt PowerPoint Presentation Model
This is a competitive analysis scatter chart radar chart ppt powerpoint presentation model. This is a eight stage process. The stages in this process are users interface, data import, example, pricing, support, update, tutorials, easy to use.
-
Competitive Analysis Scatter Chart Ppt PowerPoint Presentation Samples
This is a competitive analysis scatter chart ppt powerpoint presentation samples. This is a six stage process. The stages in this process are competitive, analysis, business, marketing, management.
-
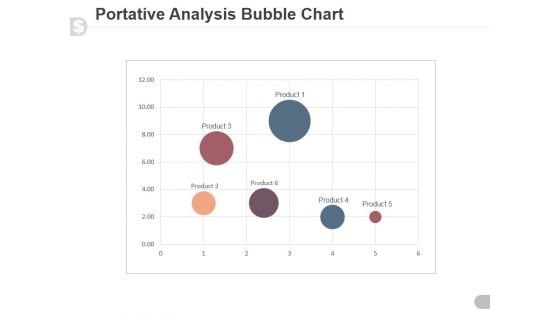
Portative Analysis Bubble Chart Ppt PowerPoint Presentation Slide
This is a portative analysis bubble chart ppt powerpoint presentation slide. This is a six stage process. The stages in this process are portative, analysis, business, graph, bubble chart.
-
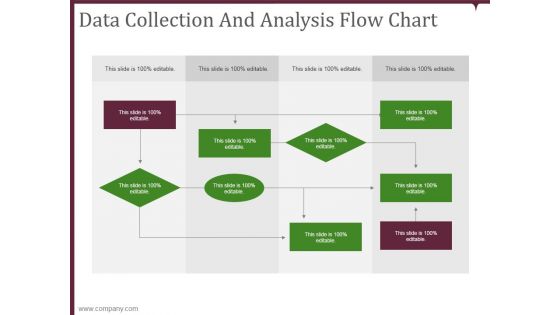
Data Collection And Analysis Flow Chart Template 1 Ppt PowerPoint Presentation Ideas Gridlines
This is a data collection and analysis flow chart template 1 ppt powerpoint presentation ideas gridlines. This is a nine stage process. The stages in this process are business, chart, organization, process, structure.
-
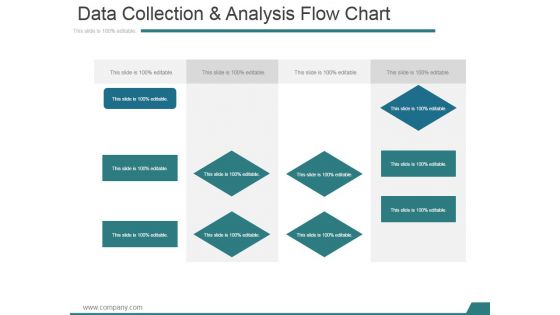
Data Collection And Analysis Flow Chart Template 2 Ppt PowerPoint Presentation Inspiration Layout Ideas
This is a data collection and analysis flow chart template 2 ppt powerpoint presentation inspiration layout ideas. This is a four stage process. The stages in this process are business, chart, organization, process, structure.
-
Basic Gap Analysis Chart Ppt Powerpoint Presentation Ideas File Formats
This is a basic gap analysis chart ppt powerpoint presentation ideas file formats. This is a six stage process. The stages in this process are what exactly is the gap, what are the consequences of the gap, what is timing, who is responsible.
-
Basic Gap Analysis Chart Ppt PowerPoint Presentation Professional Portfolio
This is a basic gap analysis chart ppt powerpoint presentation professional portfolio. This is a six stage process. The stages in this process are business, step, marketing, management.
-
Competitive Analysis Template 4 Scatter Chart Radar Chart Ppt PowerPoint Presentation Portfolio Deck
This is a competitive analysis template 4 scatter chart radar chart ppt powerpoint presentation portfolio deck. This is a six stage process. The stages in this process are business, management, strategy, analysis, success.
-
Competitive Analysis Template 6 Scatter Chart Ppt PowerPoint Presentation Icon Example Topics
This is a competitive analysis template 6 scatter chart ppt powerpoint presentation icon example topics. This is a eight stage process. The stages in this process are users interface, data import, example, pricing, support, update, tutorials, easy to use.
-
Competitive Analysis Template 7 Bubble Chart Ppt PowerPoint Presentation Summary Guidelines
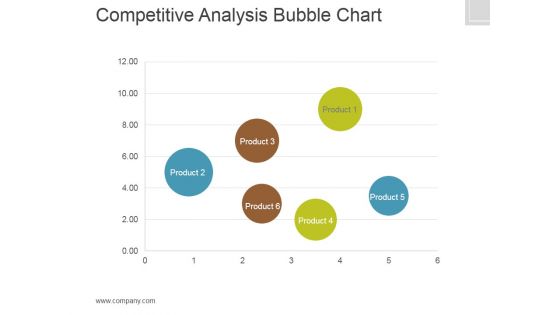
This is a competitive analysis template 7 bubble chart ppt powerpoint presentation summary guidelines. This is a six stage process. The stages in this process are business, bubble, management, strategy, marketing.
-
Competitive Analysis Template 8 Matrix Chart Ppt PowerPoint Presentation Show Outfit
This is a competitive analysis template 8 matrix chart ppt powerpoint presentation show outfit. This is a six stage process. The stages in this process are product quality, product fidelity, after sales service, customer service, price, shipping speed.
-
Financial Charts Data Analysis Vector Icon Ppt PowerPoint Presentation Visual Aids Summary Cpb
This is a financial charts data analysis vector icon ppt powerpoint presentation visual aids summary cpb. This is a three stage process. The stages in this process are data analysis, analytics architecture, analytics framework.
-
Pert Chart For System Planning And Analysis Installation Test And Conversion Ppt Powerpoint Presentation Pictures Graphics Tutorials
This is a pert chart for system planning and analysis installation test and conversion ppt powerpoint presentation pictures graphics tutorials. This is a eleven stage process. The stages in this process are pert chart, program evaluation and review technique, pert graph.
-
Business Analysis Chart Vector Icon Ppt PowerPoint Presentation Professional Display
This is a business analysis chart vector icon ppt powerpoint presentation professional display. This is a four stage process. The stages in this process are business marketing plan, business marketing strategies, business marketing approach.
-
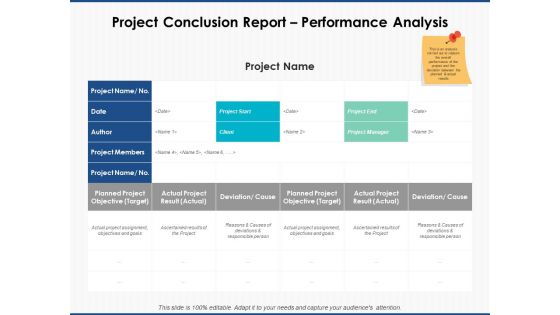
Project Conclusion Report Performance Analysis Ppt PowerPoint Presentation Diagram Graph Charts
This is a project conclusion report performance analysis ppt powerpoint presentation diagram graph charts. The topics discussed in this diagram are marketing, business, management, planning, strategy This is a completely editable PowerPoint presentation, and is available for immediate download.
-
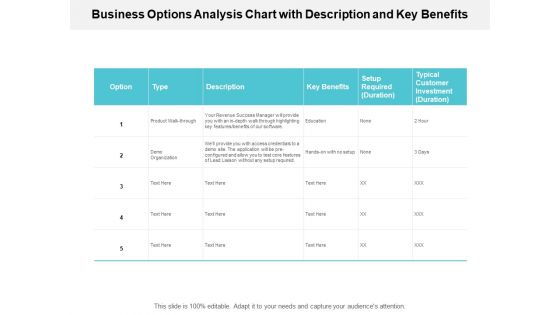
Business Options Analysis Chart With Description And Key Benefits Ppt PowerPoint Presentation Outline Elements
Presenting this set of slides with name business options analysis chart with description and key benefits ppt powerpoint presentation outline elements. The topics discussed in these slides are evaluation of option, business, checklist. This is a completely editable PowerPoint presentation and is available for immediate download. Download now and impress your audience.
-
Strategic Analysis Chart Suitability Feasibility And Acceptability Ppt PowerPoint Presentation Pictures Microsoft
Presenting this set of slides with name strategic analysis chart suitability feasibility and acceptability ppt powerpoint presentation pictures microsoft. The topics discussed in these slides are evaluation of option, business, checklist. This is a completely editable PowerPoint presentation and is available for immediate download. Download now and impress your audience.
-
Financial Chart Analysis Ppt PowerPoint Presentation Icon Vector Cpb
This is a financial chart analysis ppt powerpoint presentation icon vector cpb. This is a four stage process. The stages in this process are financial chart analysis.
-
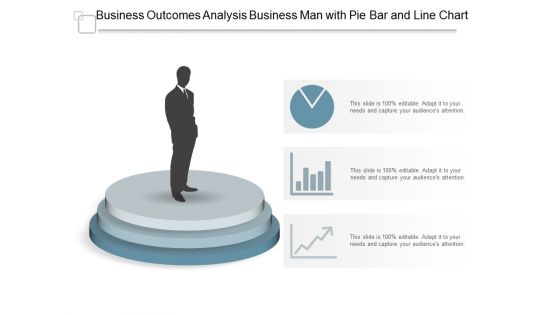
Business Outcomes Analysis Business Man With Pie Bar And Line Chart Ppt PowerPoint Presentation Professional Graphics Download
Presenting this set of slides with name business outcomes analysis business man with pie bar and line chart ppt powerpoint presentation professional graphics download. This is a three stage process. The stages in this process are business outcomes, business results, business output. This is a completely editable PowerPoint presentation and is available for immediate download. Download now and impress your audience.
-
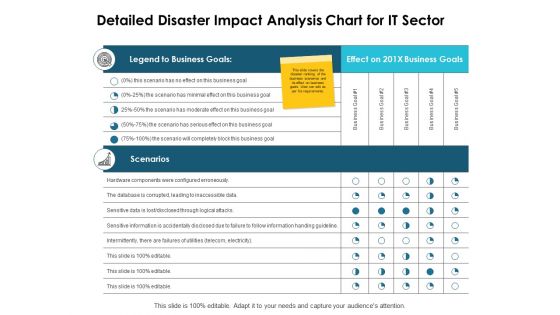
Detailed Disaster Impact Analysis Chart For It Sector Ppt PowerPoint Presentation Layouts Microsoft
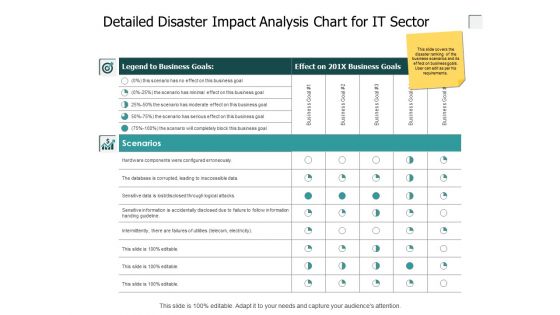
Presenting this set of slides with name detailed disaster impact analysis chart for it sector ppt powerpoint presentation layouts microsoft. The topics discussed in these slides are business goals, scenarios, business, management, marketing. This is a completely editable PowerPoint presentation and is available for immediate download. Download now and impress your audience.
-
Charts Vector For Statistical Analysis Ppt PowerPoint Presentation Layouts Professional
Presenting this set of slides with name charts vector for statistical analysis ppt powerpoint presentation layouts professional. The topics discussed in these slides are data icon, status icon, status symbol icon. This is a completely editable PowerPoint presentation and is available for immediate download. Download now and impress your audience.
-
Bar Chart For Facts Stats Growth And Percentage Analysis Ppt PowerPoint Presentation Styles Infographic Template
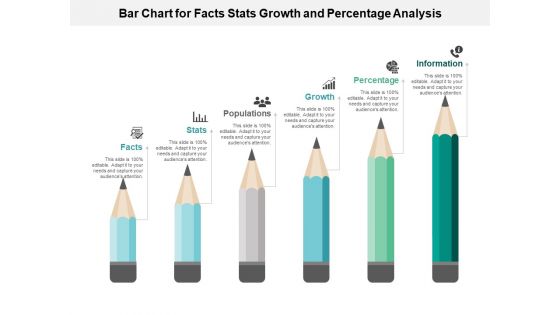
Presenting this set of slides with name bar chart for facts stats growth and percentage analysis ppt powerpoint presentation styles infographic template. This is a six stage process. The stages in this process are education, growth, pencil bar graph. This is a completely editable PowerPoint presentation and is available for immediate download. Download now and impress your audience.
-
Detailed Disaster Impact Analysis Chart For It Sector Ppt PowerPoint Presentation Slides Download
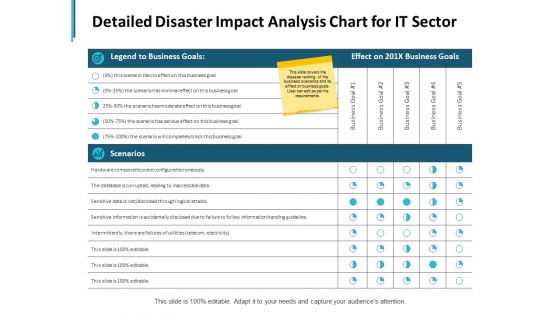
Presenting this set of slides with name detailed disaster impact analysis chart for it sector ppt powerpoint presentation slides download. The topics discussed in these slides are business, planning, strategy, marketing, management. This is a completely editable PowerPoint presentation and is available for immediate download. Download now and impress your audience.
-
Detailed Disaster Impact Analysis Chart For It Sector Ppt PowerPoint Presentation Infographics Portrait
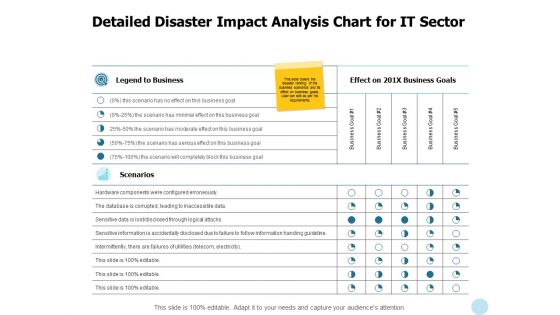
Presenting this set of slides with name detailed disaster impact analysis chart for it sector ppt powerpoint presentation infographics portrait. The topics discussed in these slides are strength, marketing, business, management, planning. This is a completely editable PowerPoint presentation and is available for immediate download. Download now and impress your audience.
-
Detailed Disaster Impact Analysis Chart For It Sector Ppt PowerPoint Presentation Gallery Elements
Presenting this set of slides with name detailed disaster impact analysis chart for it sector ppt powerpoint presentation gallery elements. The topics discussed in these slides are marketing, business, management, planning, strategy. This is a completely editable PowerPoint presentation and is available for immediate download. Download now and impress your audience.
-
Detailed Disaster Impact Analysis Chart For It Sector Ppt PowerPoint Presentation File Examples
Presenting this set of slides with name detailed disaster impact analysis chart for it sector ppt powerpoint presentation file examples. The topics discussed in these slides are business, management, planning, strategy, marketing. This is a completely editable PowerPoint presentation and is available for immediate download. Download now and impress your audience.
-
Dashboard Performance Analysis Chart Powerpoint Slides
This PowerPoint template graphics of meter chart. Download this PPT chart for business performance analysis. This PowerPoint slide is of great help in the business sector to make realistic presentations and provides effective way of presenting your newer thoughts.
-
Pie Chart Dashboard Style For Percentage Analysis Powerpoint Slides
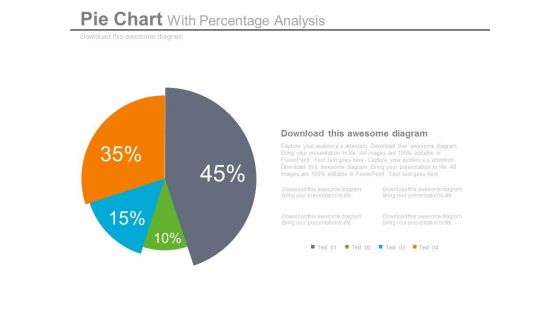
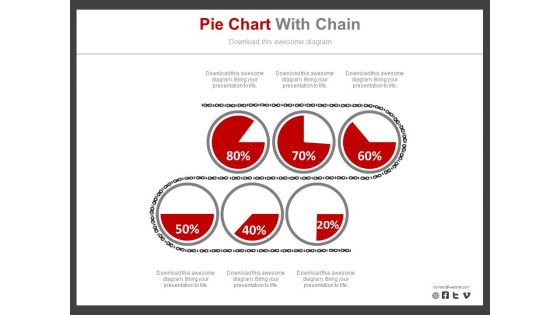
This dashboard PPT template contains graphics of pie chart. This dashboard PowerPoint template helps to display percentage analysis in a visual manner. Download this PPT slide for quick decision-making.
-
Pie Chart With Icons For Business Analysis Powerpoint Slides
This dashboard template contains graphics of pie chart with icons. This dashboard PowerPoint template helps to display business analysis in a visual manner. Download this template to make impressive presentations.
-
Pie Chart With Population Ratio Analysis Powerpoint Slides
This dashboard template contains graphics of pie chart with icons. This dashboard PowerPoint template helps to display population ratio analysis in a visual manner. Download this template to make impressive presentations.
-
Circle Chart Marketing Research Analysis Powerpoint Template
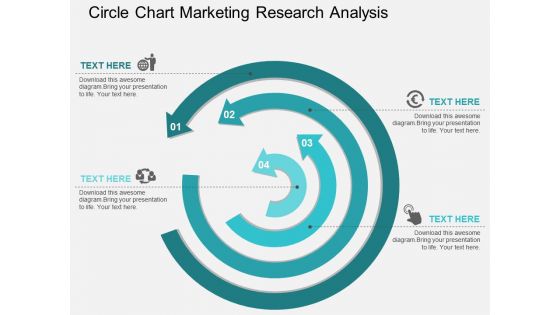
Above PPT slide provides the ideal backdrop to display marketing research analysis. This PowerPoint template contains graphics of circular arrows chart. Add this diagram in your presentations to visually support your content.
-
Circle Chart For Value Analysis Powerpoint Slides
This PowerPoint template has been designed for business presentations and corporate slides. The PowerPoint template has a high quality design. You can download this PowerPoint slide for corporate presentations or annual meeting and business plans.
-
Pie Chart For Customer Analysis Powerpoint Slides
This PowerPoint template has been designed with percentage ratio pie chart. This PPT slide can be used to display customer analysis. You can download finance PowerPoint template to prepare awesome presentations.
-
Pie Charts For Financial Ratio Analysis Powerpoint Slides
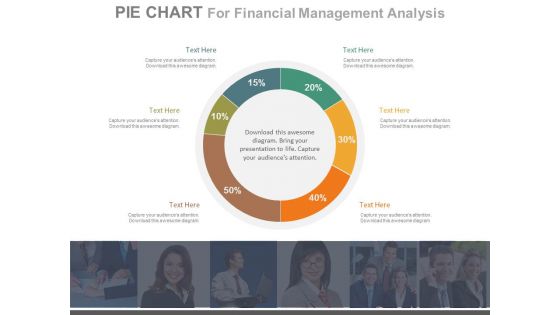
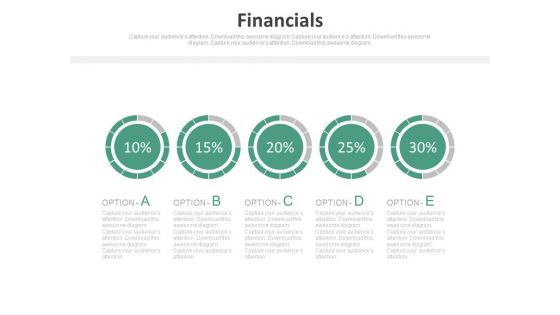
This PowerPoint template has been designed with diagram of pie charts. This PPT slide can be used to prepare presentations for profit growth report and also for financial data analysis. You can download finance PowerPoint template to prepare awesome presentations.
-
Pipeline Percentage Analysis Chart Powerpoint Slides
This PowerPoint template has been designed with pipeline percentage analysis chart. This PPT slide can be used to display business strategy plan. You can download finance PowerPoint template to prepare awesome presentations.
-
Sequential Steps Chart For Data Analysis Powerpoint Slides
This PowerPoint template has been designed sequential steps chart with icons. This PPT slide can be used to display corporate level financial strategy. You can download finance PowerPoint template to prepare awesome presentations.
-
Bar Graph With Line Chart For Analysis Powerpoint Slides
This PowerPoint template contains design of bar graph with line chart. You may download this slide to display strategy steps for business growth. You can easily customize this template to make it more unique as per your need.
-
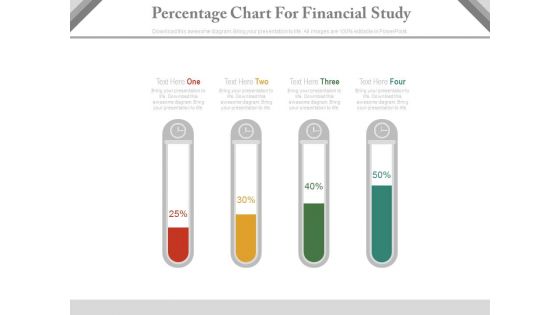
Test Tubes Percentage Chart For Financial Analysis Powerpoint Slides
This PPT slide contains test tubes percentage chart. You may download this PowerPoint template for financial analysis in your presentations. Make outstanding business presentation with this template.
-
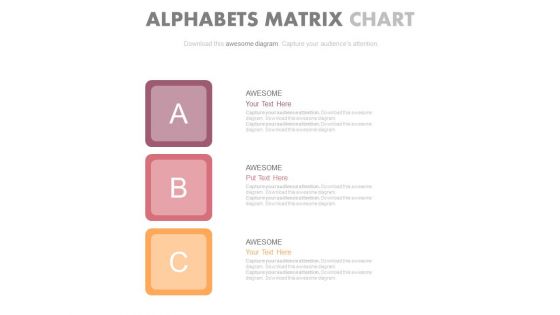
Abc Steps Chart For Data Analysis Powerpoint Slides
Our above PPT slide contains graphics of ABC steps chart. This business diagram helps to depict business information for strategic management. Use this diagram to impart more clarity to data and to create more sound impact on viewers.
-
Five Mountain Chart With Icons For Financial Analysis Powerpoint Slides
Our above PPT slide contains five mountains with icons and financial values. This PowerPoint template helps to exhibit financial analysis for business growth. Use this diagram to impart more clarity to subject and to create more sound impact on viewers.
-
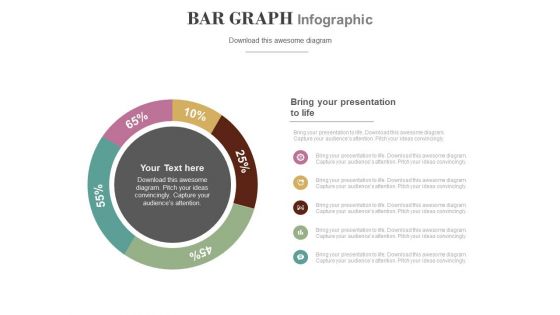
Circle Chart With Percentage Value Analysis Powerpoint Slides
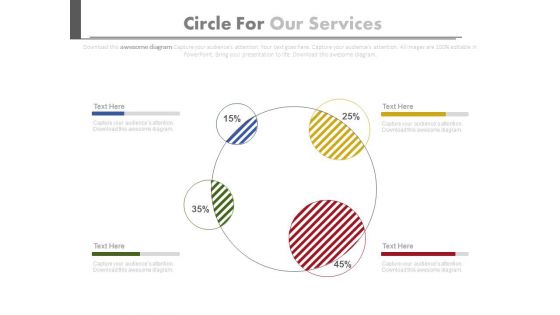
This PowerPoint template has been designed with circular process diagram. This business diagram helps to exhibit financial process control and analysis. Use this diagram to visually support your content.
-
Four Steps Pie Charts For Financial Analysis Powerpoint Slides
Four pie charts have been displayed in this business slide. This PowerPoint template helps to exhibit financial ratio analysis. Use this diagram slide to build an exclusive presentation.
-
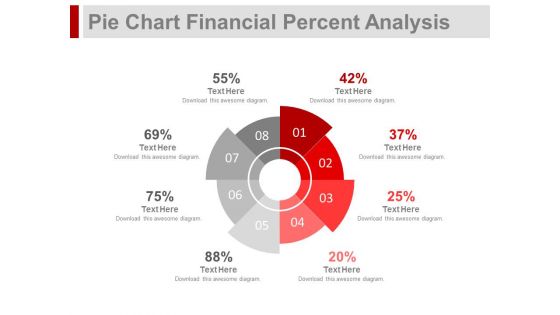
Pie Chart For Financial Ratio Analysis Powerpoint Slides
This PPT slide contains graphics of eight stage pie chart. Download this PowerPoint template slide for financial ratio analysis. This diagram is editable you can edit text, color, shade and style as per you need.
-
Year Based Chart With Percentage Data Analysis Powerpoint Slides
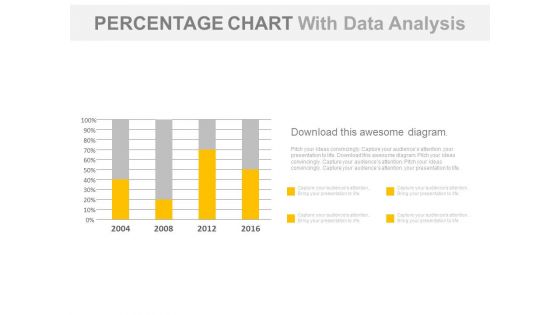
Our above business slide contains year based statistical chart. This PowerPoint template can be used to display percentage data analysis. Capture the attention of your audience with this slide.
-
Six Pie Charts For Revenue Analysis Report Powerpoint Slides
Six pie charts have been displayed in this business slide. This business diagram helps to exhibit revenue analysis report. Download this PowerPoint template to build an exclusive presentation.
-
Two Pie Charts For Comparison And Analysis Powerpoint Slides
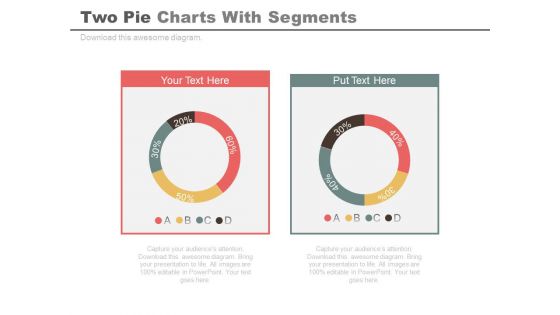
Develop competitive advantage with our above template of two pie charts. This PowerPoint diagram provides an effective way of displaying business information. You can edit text, color, shade and style as per you need.
-
Financial Growth Analysis Circular Chart Powerpoint Slides
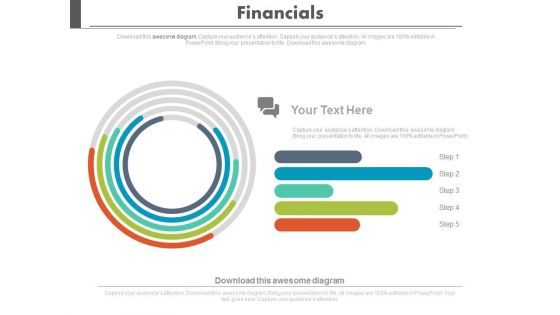
Visually support your presentation with our above template containing graphics of circular chart. This diagram slide helps to display financial growth analysis. Etch your views in the brains of your audience with this diagram slide.
-
Pie Charts For Percentage Value Analysis Powerpoint Slides
Our above PPT slide displays graphics of Pie charts. This PowerPoint template may be used to display percentage value analysis. Download this template to leave permanent impression on your audience.
-
Four Directions Circular Analysis Chart Powerpoint Slides
Our professionally designed business diagram is as an effective tool for communicating business strategy. It contains four directional circular charts. Above slide is also suitable to display financial planning and strategy.
-
Linear Circles Percentage Analysis Charts Powerpoint Slides
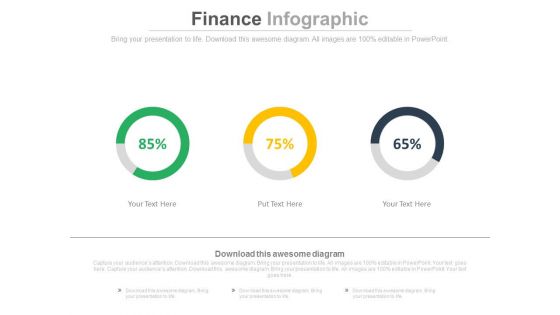
This PowerPoint template has been designed with graphics of three circles and percentage ratios. You may use this dashboard slide design for topics like profit growth and financial planning. This PPT slide is powerful tool to describe your ideas.
-
Male Female Gender Ratio Analysis Comparison Chart Powerpoint Slides
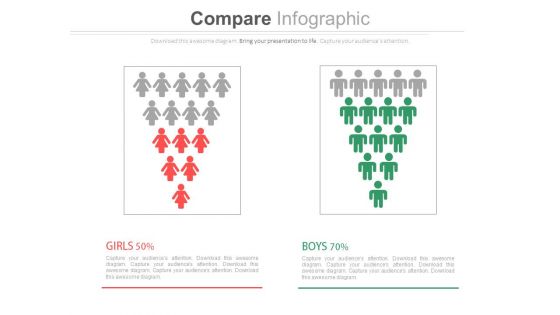
This PowerPoint template has been designed with graphics of male and female icons. Download this PPT slide to depict gender ratio analysis. Grab the attention of your team with this eye catching template.
-
Two Teams Performance Analysis Chart Powerpoint Slides
This PowerPoint template has been designed with icons of two teams with percentage values. Download this PPT slide to depict team?s performance analysis. Deliver amazing presentations to mesmerize your audience by using this PPT slide design.


