Chart analysis PowerPoint Presentation Templates and Google Slides
-
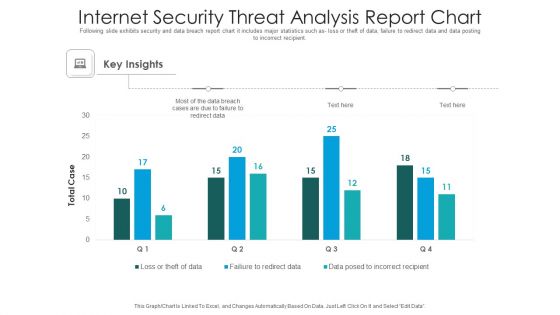
Internet Security Threat Analysis Report Chart Introduction PDF
Following slide exhibits security and data breach report chart it includes major statistics such as- loss or theft of data, failure to redirect data and data posting to incorrect recipient. Pitch your topic with ease and precision using this internet security threat analysis report chart introduction pdf. This layout presents information on internet security threat analysis report chart. It is also available for immediate download and adjustment. So, changes can be made in the color, design, graphics or any other component to create a unique layout.
-
Solution Monitoring Verification Solution Assessment Criteria Analysis Chart Template PDF
This slide shows the overview and some details of the fifth task in solution assessment and validation process i.e. Validate Solution such as purpose of validating solution, process inputs and output description, elements, stakeholder details and validate solution model. Deliver an awe inspiring pitch with this creative solution monitoring verification solution assessment criteria analysis chart template pdf bundle. Topics like process, output, elements can be discussed with this completely editable template. It is available for immediate download depending on the needs and requirements of the user.
-
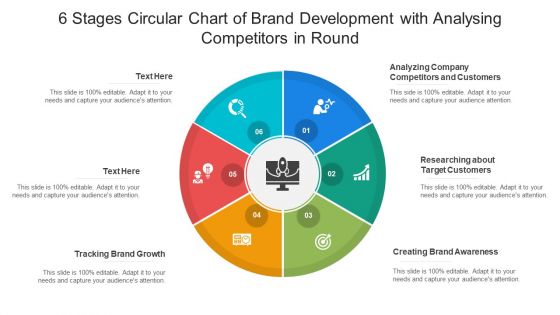
Six Stages Circular Chart Of Brand Development With Analysing Competitors In Round Ppt PowerPoint Presentation File Background PDF
Persuade your audience using this six stages circular chart of brand development with analysing competitors in round ppt powerpoint presentation file background pdf. This PPT design covers six stages, thus making it a great tool to use. It also caters to a variety of topics including growth, analyzing, target. Download this PPT design now to present a convincing pitch that not only emphasizes the topic but also showcases your presentation skills.
-
Advisory Company Pitch Deck Competitive Analysis Comparison Chart Ppt Layouts Brochure PDF
This slide provides the glimpse about the problem faced by the users since email is used for personal use which leads to problems such as no collaboration, poor productivity, and regular errors. Deliver an awe inspiring pitch with this creative advisory company pitch deck competitive analysis comparison chart ppt layouts brochure pdf bundle. Topics like e commerce, devices, email, pricing, average can be discussed with this completely editable template. It is available for immediate download depending on the needs and requirements of the user.
-
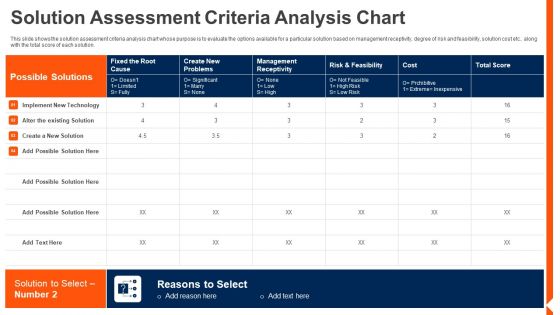
Comprehensive Solution Analysis Solution Assessment Criteria Analysis Chart Mockup PDF
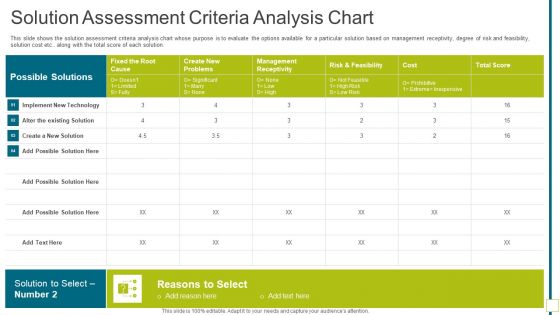
This slide shows the solution assessment criteria analysis chart whose purpose is to evaluate the options available for a particular solution based on management receptivity, degree of risk and feasibility, solution cost etc.. along with the total score of each solution. This is a comprehensive solution analysis solution assessment criteria analysis chart mockup pdf template with various stages. Focus and dispense information on one stage using this creative set, that comes with editable features. It contains large content boxes to add your information on topics like solution assessment criteria analysis chart. You can also showcase facts, figures, and other relevant content using this PPT layout. Grab it now.
-
Organization Chart Competitor Analysis Table With Team Members Diagrams PDF
Pitch your topic with ease and precision using this organization chart competitor analysis table with team members diagrams pdf. This layout presents information on organization chart competitor analysis table with team members. It is also available for immediate download and adjustment. So, changes can be made in the color, design, graphics or any other component to create a unique layout.
-
Feasibility Analysis Template Different Projects Hospital Organizational Chart Download PDF
This slide provides the glimpse of the hospital organizational chart that is required to built a solid foundation and recruit qualified professionals. Presenting feasibility analysis template different projects hospital organizational chart download pdf to provide visual cues and insights. Share and navigate important information on one stages that need your due attention. This template can be used to pitch topics like hospital organizational chart. In addtion, this PPT design contains high resolution images, graphics, etc, that are easily editable and available for immediate download.
-
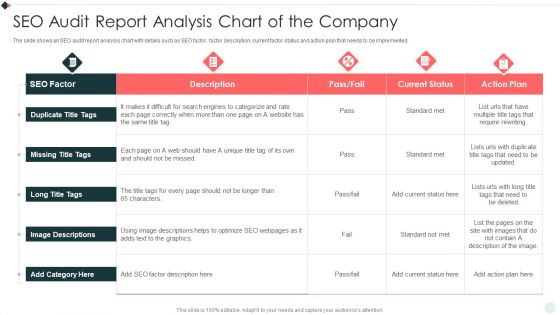
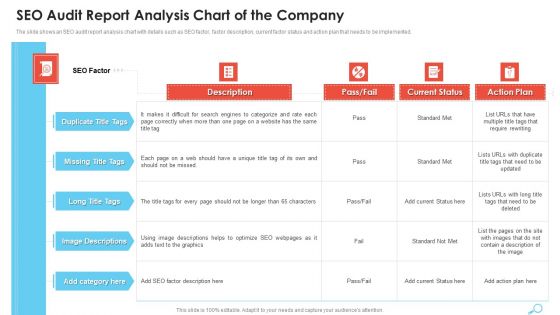
SEO Audit Report Analysis Chart Of The Company Ppt Summary Mockup PDF
The slide shows an SEO audit report analysis chart with details such as SEO factor, factor description, current factor status and action plan that needs to be implemented. Deliver an awe inspiring pitch with this creative SEO Audit Report Analysis Chart Of The Company Ppt Summary Mockup PDF bundle. Topics like SEO Factor Action, Missing Title Tags, Long Title Tags can be discussed with this completely editable template. It is available for immediate download depending on the needs and requirements of the user.
-
Customer Data Analysis Chart For Product Sales Inspiration PDF
Showcasing this set of slides titled customer data analysis chart for product sales inspiration pdf. The topics addressed in these templates are customer data analysis chart for product sales. All the content presented in this PPT design is completely editable. Download it and make adjustments in color, background, font etc. as per your unique business setting.
-
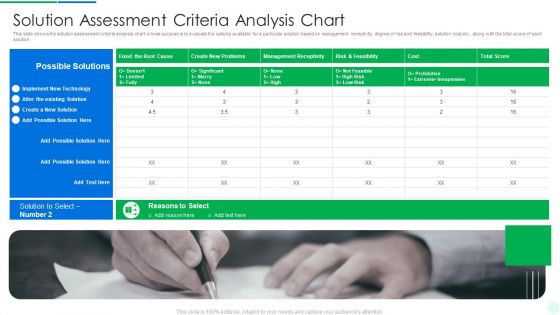
Solution Assessment Criteria Analysis Chart Solution Evaluation Validation Meet Organizational Needs Diagrams PDF
This slide shows the solution assessment criteria analysis chart whose purpose is to evaluate the options available for a particular solution based on management receptivity, degree of risk and feasibility, solution cost etc.. along with the total score of each solution. Deliver and pitch your topic in the best possible manner with this solution assessment criteria analysis chart solution evaluation validation meet organizational needs diagrams pdf. Use them to share invaluable insights on solution assessment criteria analysis chart and impress your audience. This template can be altered and modified as per your expectations. So, grab it now.
-
Cross Departmental Technology Skill Gaps Analysis Chart Introduction PDF
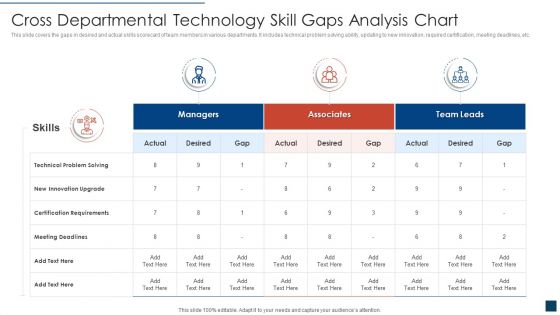
This slide covers the gaps in desired and actual skills scorecard of team members in various departments. It includes technical problem solving ability, updating to new innovation, required certification, meeting deadlines, etc. Pitch your topic with ease and precision using this cross departmental technology skill gaps analysis chart introduction pdf. This layout presents information on cross departmental technology skill gaps analysis chart. It is also available for immediate download and adjustment. So, changes can be made in the color, design, graphics or any other component to create a unique layout.
-
Statistical Data Analysis Chart Of Collected Data Formats PDF
Presenting statistical data analysis chart of collected data formats pdf to dispense important information. This template comprises four stages. It also presents valuable insights into the topics including statistical data analysis chart of collected data. This is a completely customizable PowerPoint theme that can be put to use immediately. So, download it and address the topic impactfully.
-
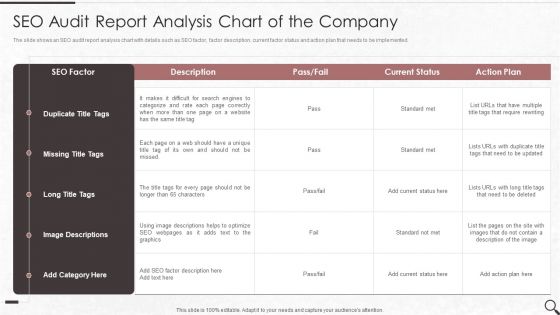
SEO Audit Report Analysis Chart Of The Company Ppt Infographic Template Microsoft PDF
The slide shows an SEO audit report analysis chart with details such as SEO factor, factor description, current factor status and action plan that needs to be implemented. Deliver an awe inspiring pitch with this creative seo audit report analysis chart of the company ppt infographic template microsoft pdf bundle. Topics like seo audit report analysis chart of the company can be discussed with this completely editable template. It is available for immediate download depending on the needs and requirements of the user.
-
Bar Chart Representing Macroeconomic Analysis Variables Background PDF
This slide shows the graphical representation of macroeconomic variables which includes house prices, stock prices, unemployment and wages that shows effect of macroeconomic policies on the variables of four different countries. Showcasing this set of slides titled Bar Chart Representing Macroeconomic Analysis Variables Background PDF. The topics addressed in these templates are House Prices, Stock Prices, Unemployment, Wages. All the content presented in this PPT design is completely editable. Download it and make adjustments in color, background, font etc. as per your unique business setting.
-
Environmental Analysis Icon With Chart And Magnifying Glass Introduction PDF
Persuade your audience using this Environmental Analysis Icon With Chart And Magnifying Glass Introduction PDF. This PPT design covers five stages, thus making it a great tool to use. It also caters to a variety of topics including Environmental Analysis Icon With Chart And Magnifying Glass. Download this PPT design now to present a convincing pitch that not only emphasizes the topic but also showcases your presentation skills.
-
Brand Comparative Analysis Chart With Market Size And Pricing Model Pictures PDF
This slide illustrates comparative analysis of brands of XYZ product. It includes their market size, key features of these brands.Showcasing this set of slides titled Brand Comparative Analysis Chart With Market Size And Pricing Model Pictures PDF. The topics addressed in these templates are Pricing Model, Competitive Pricing, Market Size. All the content presented in this PPT design is completely editable. Download it and make adjustments in color, background, font etc. as per your unique business setting.
-
Brand Specifications Comparative Analysis Ratings Chart Demonstration PDF
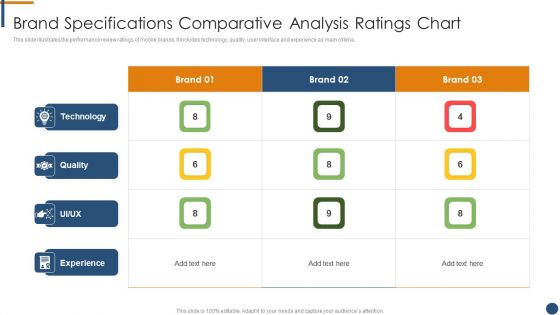
This slide illustrates the performance review ratings of mobile brands. It includes technology, quality, user interface and experience as main criteria.Showcasing this set of slides titled Brand Specifications Comparative Analysis Ratings Chart Demonstration PDF. The topics addressed in these templates are Technology, Quality, Experience. All the content presented in this PPT design is completely editable. Download it and make adjustments in color, background, font etc. as per your unique business setting
-
Brands Comparative Analysis Chart With Features And Durability Ratings Template PDF
This slide illustrates tabular comparative analysis of three brands. It includes ratings on features, price, technology, service, support, durability etc.Pitch your topic with ease and precision using this Brands Comparative Analysis Chart With Features And Durability Ratings Template PDF. This layout presents information on Technology, Price, Service. It is also available for immediate download and adjustment. So, changes can be made in the color, design, graphics or any other component to create a unique layout.
-
6 Step Brand Development With Analysing Competitors In Round Chart Graphics PDF
Presenting 6 step brand development with analysing competitors in round chart graphics pdf to dispense important information. This template comprises six stages. It also presents valuable insights into the topics including target, awareness, brand growth. This is a completely customizable PowerPoint theme that can be put to use immediately. So, download it and address the topic impactfully.
-
Pestle Working Chart For Variance Analysis Techniques And Models Infographics PDF
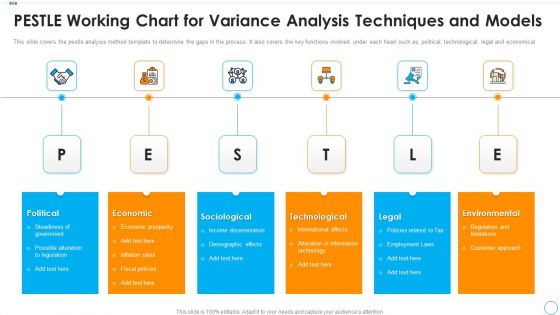
This slide covers the pestle analysis method template to determine the gaps in the process. It also covers the key functions involved under each head such as, political, technological, legal and economical. Presenting pestle working chart for variance analysis techniques and models infographics pdf to dispense important information. This template comprises five stages. It also presents valuable insights into the topics including sociological, technological, environmental. This is a completely customizable PowerPoint theme that can be put to use immediately. So, download it and address the topic impactfully.
-
SEO Audit Summary To Increase SEO Audit Report Analysis Chart Of The Company Template PDF
The slide shows an SEO audit report analysis chart with details such as SEO factor, factor description, current factor status and action plan that needs to be implemented. Deliver an awe inspiring pitch with this creative SEO Audit Summary To Increase SEO Audit Report Analysis Chart Of The Company Template PDF bundle. Topics like Current Status, Action Plan, SEO Factor can be discussed with this completely editable template. It is available for immediate download depending on the needs and requirements of the user.
-
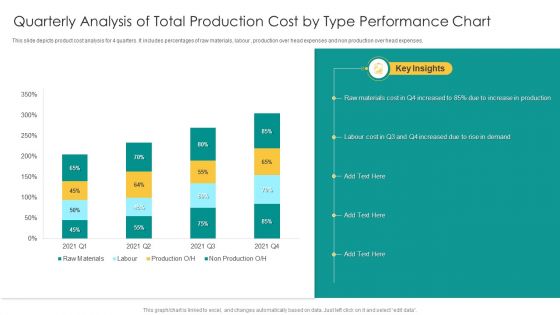
Quarterly Analysis Of Total Production Cost By Type Performance Chart Summary PDF
This slide depicts product cost analysis for 4 quarters. It includes percentages of raw materials, labour , production over head expenses and non production over head expenses. Showcasing this set of slides titled Quarterly Analysis Of Total Production Cost By Type Performance Chart Summary PDF. The topics addressed in these templates are Raw Materials Cost, Increase Production, Rise Demand. All the content presented in this PPT design is completely editable. Download it and make adjustments in color, background, font etc. as per your unique business setting.
-
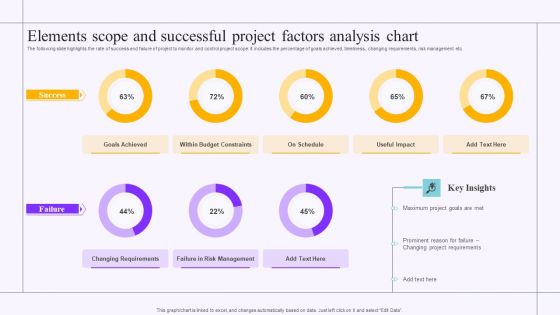
Elements Scope And Successful Project Factors Analysis Chart Sample PDF
The following slide highlights the rate of success and failure of project to monitor and control project scope. It includes the percentage of goals achieved, timeliness, changing requirements, risk management etc. Showcasing this set of slides titled Elements Scope And Successful Project Factors Analysis Chart Sample PDF. The topics addressed in these templates are Goals Achieved, Budget Constraints, Project Requirements. All the content presented in this PPT design is completely editable. Download it and make adjustments in color, background, font etc. as per your unique business setting.
-
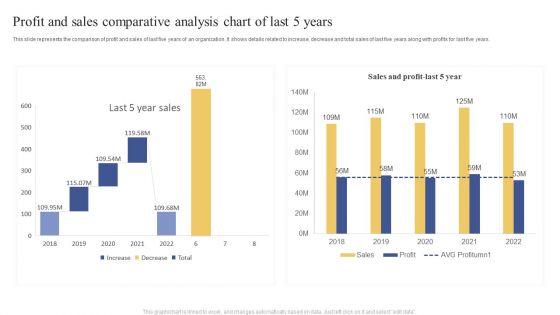
Profit And Sales Comparative Analysis Chart Of Last 5 Years Ppt Visual Aids Example 2015 PDF
This slide represents the comparison of profit and sales of last five years of an organization. It shows details related to increase, decrease and total sales of last five years along with profits for last five years. Showcasing this set of slides titled Profit And Sales Comparative Analysis Chart Of Last 5 Years Ppt Visual Aids Example 2015 PDF. The topics addressed in these templates are Last 5 Year, Sales, 2018 To 2022. All the content presented in this PPT design is completely editable. Download it and make adjustments in color, background, font etc. as per your unique business setting.
-
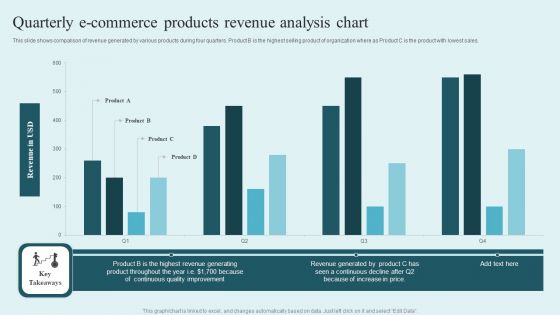
Quarterly E Commerce Products Revenue Analysis Chart Guidelines PDF
This slide shows comparison of revenue generated by various products during four quarters. Product B is the highest selling product of organization where as Product C is the product with lowest sales. Showcasing this set of slides titled Quarterly E Commerce Products Revenue Analysis Chart Guidelines PDF. The topics addressed in these templates are Revenue USD, Product, Continuous Quality Improvement. All the content presented in this PPT design is completely editable. Download it and make adjustments in color, background, font etc. as per your unique business setting.
-
Monthly Sales Analysis Chart For Pharmaceutical Device Structure PDF
This slide showcases the medical equipment monthly sales summary analysis chart. It includes elements such as product name, unit price, sales volume, monthly sales of the product and product trend chart. Showcasing this set of slides titled Monthly Sales Analysis Chart For Pharmaceutical Device Structure PDF. The topics addressed in these templates are Monthly Sales Analysis, Pharmaceutical Device. All the content presented in this PPT design is completely editable. Download it and make adjustments in color, background, font etc. as per your unique business setting.
-
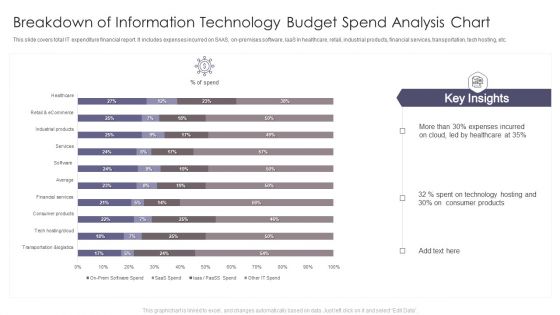
Breakdown Of Information Technology Budget Spend Analysis Chart Download PDF
This slide covers total IT expenditure financial report. It includes expenses incurred on SAAS, on-premises software, laaS in healthcare, retail, industrial products, financial services, transportation, tech hosting, etc. Pitch your topic with ease and precision using this Breakdown Of Information Technology Budget Spend Analysis Chart Download PDF. This layout presents information on Expenses Incurred, Technology Hosting, Consumer Products. It is also available for immediate download and adjustment. So, changes can be made in the color, design, graphics or any other component to create a unique layout.
-
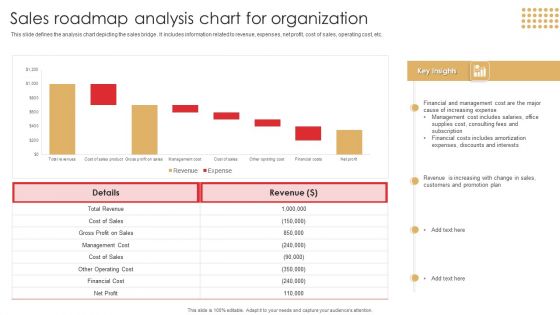
Sales Roadmap Analysis Chart For Organization Download PDF
This slide defines the analysis chart depicting the sales bridge . It includes information related to revenue, expenses, net profit, cost of sales, operating cost, etc.Showcasing this set of slides titled Sales Roadmap Analysis Chart For Organization Download PDF. The topics addressed in these templates are Management Cost, Financial Cost, Includes Amortization. All the content presented in this PPT design is completely editable. Download it and make adjustments in color, background, font etc. as per your unique business setting.
-
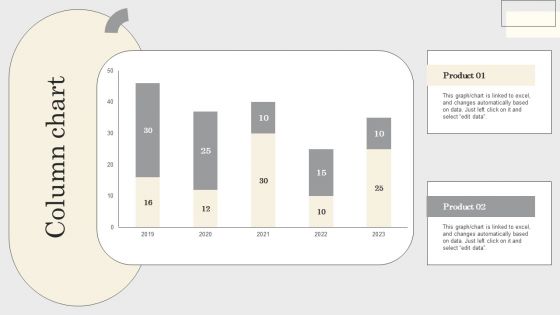
Steps To Conduct Competitor Analysis Column Chart Ppt Model Gridlines PDF
This graph or chart is linked to excel, and changes automatically based on data. Just left click on it and select edit data. If your project calls for a presentation, then Slidegeeks is your go-to partner because we have professionally designed, easy-to-edit templates that are perfect for any presentation. After downloading, you can easily edit Steps To Conduct Competitor Analysis Column Chart Ppt Model Gridlines PDF and make the changes accordingly. You can rearrange slides or fill them with different images. Check out all the handy templates
-
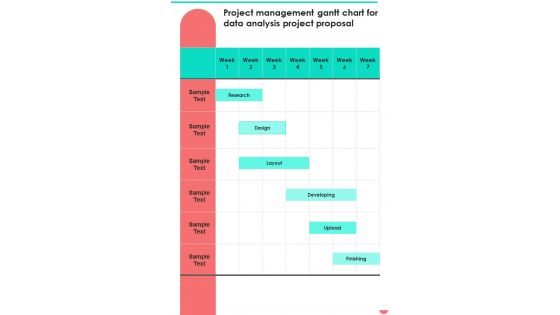
Project Management Gantt Chart For Data Analysis Project Proposal One Pager Sample Example Document
Presenting you an exemplary Project Management Gantt Chart For Data Analysis Project Proposal One Pager Sample Example Document. Our one-pager comprises all the must-have essentials of an inclusive document. You can edit it with ease, as its layout is completely editable. With such freedom, you can tweak its design and other elements to your requirements. Download this Project Management Gantt Chart For Data Analysis Project Proposal One Pager Sample Example Document brilliant piece now.
-
Gantt Chart Proposal For Data Analysis In Research Project One Pager Sample Example Document
Presenting you an exemplary Gantt Chart Proposal For Data Analysis In Research Project One Pager Sample Example Document. Our one-pager comprises all the must-have essentials of an inclusive document. You can edit it with ease, as its layout is completely editable. With such freedom, you can tweak its design and other elements to your requirements. Download this Gantt Chart Proposal For Data Analysis In Research Project One Pager Sample Example Document brilliant piece now.
-
Employee Quarter Wise Performance Analysis Bar Chart Icon Guidelines PDF
Presenting Employee Quarter Wise Performance Analysis Bar Chart Icon Guidelines PDF to dispense important information. This template comprises four stages. It also presents valuable insights into the topics including Employee Quarter Wise, Performance Analysis, Bar Chart Icon. This is a completely customizable PowerPoint theme that can be put to use immediately. So, download it and address the topic impactfully.
-
SEO Audit Report Analysis Chart Of The Company Rules PDF
The slide shows an SEO audit report analysis chart with details such as SEO factor, factor description, current factor status and action plan that needs to be implemented.Deliver an awe inspiring pitch with this creative SEO Audit Report Analysis Chart Of The Company Rules PDF bundle. Topics like Engines To Categorize, Duplicate Title, Image Descriptions can be discussed with this completely editable template. It is available for immediate download depending on the needs and requirements of the user.
-
Clients Existing Website Traffic Assessment SEO Audit Report Analysis Chart Of The Company Brochure PDF
The slide shows an SEO audit report analysis chart with details such as SEO factor, factor description, current factor status and action plan that needs to be implemented.Deliver an awe inspiring pitch with this creative Clients Existing Website Traffic Assessment SEO Audit Report Analysis Chart Of The Company Brochure PDF bundle. Topics like Current Status, Image Descriptions, Standard can be discussed with this completely editable template. It is available for immediate download depending on the needs and requirements of the user.
-
5 Years Attrition Rate Comparative Analysis Chart Of IT Company Ppt Layouts Examples PDF
This slide represents the table showing the comparison between attrition rates and no. of employees of an IT company over the five years. It includes details related to attrition rates and no. of employees during different years. Showcasing this set of slides titled 5 Years Attrition Rate Comparative Analysis Chart Of IT Company Ppt Layouts Examples PDF. The topics addressed in these templates are Attrition Rate, No Employees, 2018 To 2022. All the content presented in this PPT design is completely editable. Download it and make adjustments in color, background, font etc. as per your unique business setting.
-
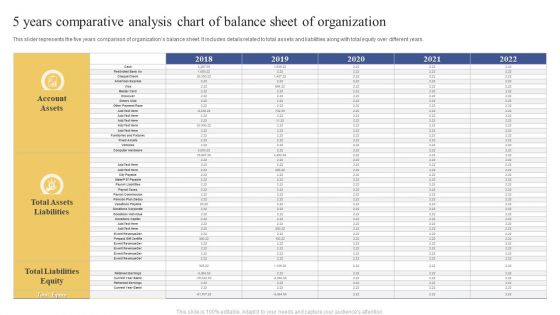
5 Years Comparative Analysis Chart Of Balance Sheet Of Organization Ppt Inspiration Slide PDF
This slider represents the five years comparison of organizations balance sheet. It includes details related to total assets and liabilities along with total equity over different years. Pitch your topic with ease and precision using this 5 Years Comparative Analysis Chart Of Balance Sheet Of Organization Ppt Inspiration Slide PDF. This layout presents information on Account Assets, Total Assets Liabilities, Total Liabilities Equity. It is also available for immediate download and adjustment. So, changes can be made in the color, design, graphics or any other component to create a unique layout.
-
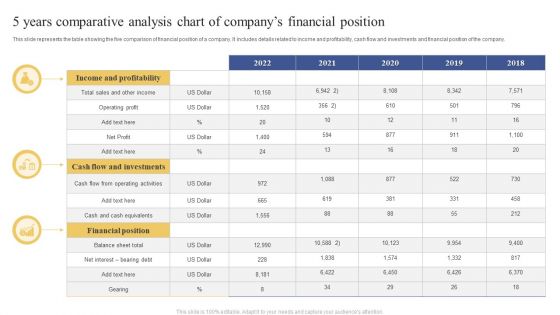
5 Years Comparative Analysis Chart Of Companys Financial Position Ppt Layouts Structure PDF
This slide represents the table showing the five comparison of financial position of a company. It includes details related to income and profitability, cash flow and investments and financial position of the company. Showcasing this set of slides titled 5 Years Comparative Analysis Chart Of Companys Financial Position Ppt Layouts Structure PDF. The topics addressed in these templates are Income And Profitability, Financial Position, Balance Sheet Total. All the content presented in this PPT design is completely editable. Download it and make adjustments in color, background, font etc. as per your unique business setting.
-
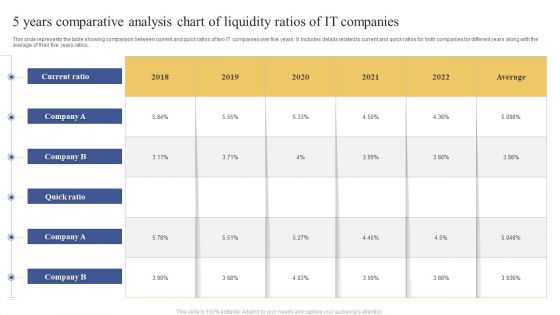
5 Years Comparative Analysis Chart Of Liquidity Ratios Of IT Companies Ppt Portfolio Visual Aids PDF
This slide represents the table showing comparison between current and quick ratios of two IT companies over five years. It includes details related to current and quick ratios for both companies for different years along with the average of their five years ratios. Pitch your topic with ease and precision using this 5 Years Comparative Analysis Chart Of Liquidity Ratios Of IT Companies Ppt Portfolio Visual Aids PDF. This layout presents information on Current Ratio, Average, 2018 To 2022. It is also available for immediate download and adjustment. So, changes can be made in the color, design, graphics or any other component to create a unique layout.
-
5 Years Employee Performance Comparative Analysis Chart Icon Ppt Portfolio Objects PDF
Presenting 5 Years Employee Performance Comparative Analysis Chart Icon Ppt Portfolio Objects PDF to dispense important information. This template comprises three stages. It also presents valuable insights into the topics including 5 Years, Employee Performance, Comparative Analysis, Chart Icon. This is a completely customizable PowerPoint theme that can be put to use immediately. So, download it and address the topic impactfully.
-
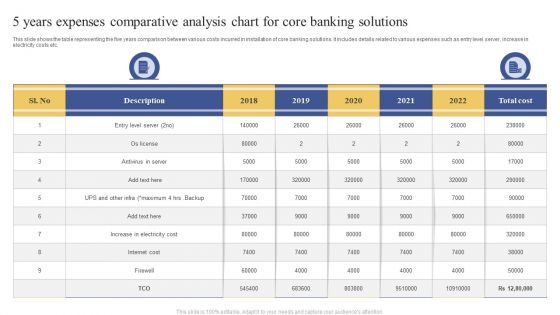
5 Years Expenses Comparative Analysis Chart For Core Banking Solutions Ppt Portfolio Clipart Images PDF
This slide shows the table representing the five years comparison between various costs incurred in installation of core banking solutions. It includes details related to various expenses such as entry level server, increase in electricity costs etc. Pitch your topic with ease and precision using this 5 Years Expenses Comparative Analysis Chart For Core Banking Solutions Ppt Portfolio Clipart Images PDF. This layout presents information on Entry Level Server, Antivirus Server, Increase Electricity Cost. It is also available for immediate download and adjustment. So, changes can be made in the color, design, graphics or any other component to create a unique layout.
-
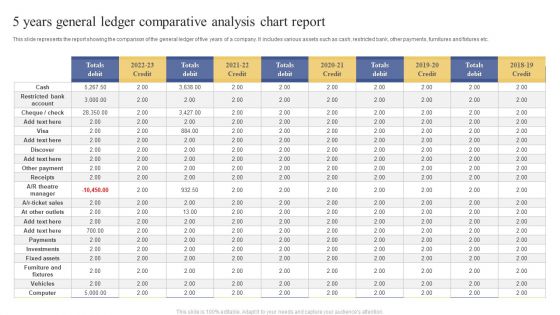
5 Years General Ledger Comparative Analysis Chart Report Ppt Model Slide PDF
This slide represents the report showing the comparison of the general ledger of five years of a company. It includes various assets such as cash, restricted bank, other payments, furnitures and fixtures etc. Showcasing this set of slides titled 5 Years General Ledger Comparative Analysis Chart Report Ppt Model Slide PDF. The topics addressed in these templates are Other Payment, Investments, Fixed Assets. All the content presented in this PPT design is completely editable. Download it and make adjustments in color, background, font etc. as per your unique business setting.
-
5 Years Mutual Funds Performance Comparative Analysis Chart Icon Ppt Show Gridlines PDF
Persuade your audience using this 5 Years Mutual Funds Performance Comparative Analysis Chart Icon Ppt Show Gridlines PDF. This PPT design covers three stages, thus making it a great tool to use. It also caters to a variety of topics including 5 Years, Mutual Funds, Performance Comparative, Analysis, Chart Icon. Download this PPT design now to present a convincing pitch that not only emphasizes the topic but also showcases your presentation skills.
-
5 Years Net Income Comparative Analysis Chart Of Financial Institute Ppt Show Designs PDF
This slide represents the comparison of net income of financial institute for different years. It includes details related to total revenue, gross profit, operating income and net income and ratios of the institute for different years. Showcasing this set of slides titled 5 Years Net Income Comparative Analysis Chart Of Financial Institute Ppt Show Designs PDF. The topics addressed in these templates are Income Statement, 2018 To 2022, Ratios. All the content presented in this PPT design is completely editable. Download it and make adjustments in color, background, font etc. as per your unique business setting.
-
5 Years Profit And Loss Comparative Analysis Chart Of Enterprise Ppt Icon Graphics PDF
This slide represents the comparison of profit and loss of an organization for the five years. It includes details related to profit and loss from various accounts such as order fees, concession income, facility rental etc. Pitch your topic with ease and precision using this 5 Years Profit And Loss Comparative Analysis Chart Of Enterprise Ppt Icon Graphics PDF. This layout presents information on Account, 2018 To 2022, Exchange Fees. It is also available for immediate download and adjustment. So, changes can be made in the color, design, graphics or any other component to create a unique layout.
-
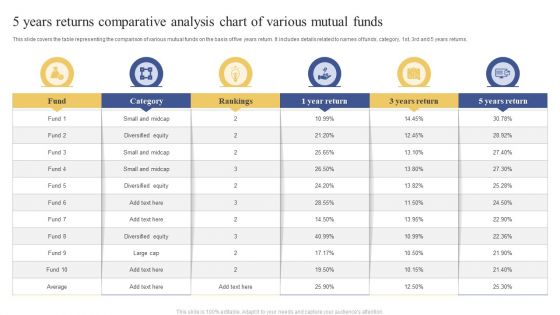
5 Years Returns Comparative Analysis Chart Of Various Mutual Funds Ppt Slides Microsoft PDF
This slide covers the table representing the comparison of various mutual funds on the basis of five years return. It includes details related to names of funds, category, 1st, 3rd and 5 years returns. Showcasing this set of slides titled 5 Years Returns Comparative Analysis Chart Of Various Mutual Funds Ppt Slides Microsoft PDF. The topics addressed in these templates are Diversified Equity, Small And Midcap, Diversified Equity. All the content presented in this PPT design is completely editable. Download it and make adjustments in color, background, font etc. as per your unique business setting.
-
5 Years Revenue Comparative Analysis Chart Icon Ppt Inspiration Diagrams PDF
Presenting 5 Years Revenue Comparative Analysis Chart Icon Ppt Inspiration Diagrams PDF to dispense important information. This template comprises three stages. It also presents valuable insights into the topics including 5 Years, Revenue Comparative, Analysis Chart, Icon. This is a completely customizable PowerPoint theme that can be put to use immediately. So, download it and address the topic impactfully.
-
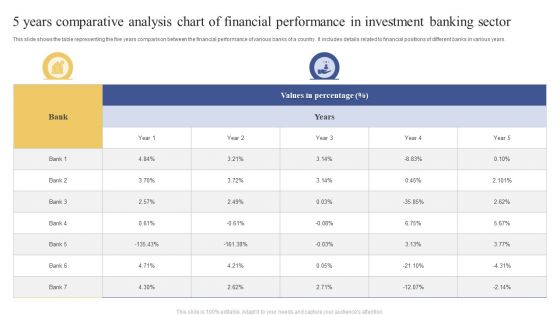
5 Years Comparative Analysis Chart Of Financial Performance In Investment Banking Sector Themes PDF
This slide shows the table representing the five years comparison between the financial performance of various banks of a country. It includes details related to financial positions of different banks in various years. Showcasing this set of slides titled 5 Years Comparative Analysis Chart Of Financial Performance In Investment Banking Sector Themes PDF. The topics addressed in these templates are Values Percentage, Bank, Year. All the content presented in this PPT design is completely editable. Download it and make adjustments in color, background, font etc. as per your unique business setting.
-
5 Years Sales And Profit Growth Comparative Analysis Chart Of Private Banks Infographics PDF
This slide shows the table representing the comparison between sales and profit growth of five years of various private banks. It includes details related to names of private banks and their five years sales growth and profit growth. Pitch your topic with ease and precision using this 5 Years Sales And Profit Growth Comparative Analysis Chart Of Private Banks Infographics PDF. This layout presents information on Private Banks, Sales Growth, Profit Growth. It is also available for immediate download and adjustment. So, changes can be made in the color, design, graphics or any other component to create a unique layout.
-
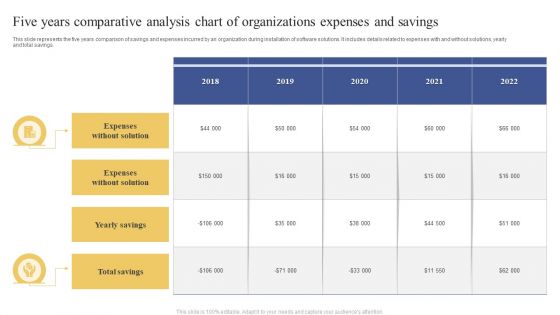
Five Years Comparative Analysis Chart Of Organizations Expenses And Savings Topics PDF
This slide represents the five years comparison of savings and expenses incurred by an organization during installation of software solutions. It includes details related to expenses with and without solutions, yearly and total savings. Showcasing this set of slides titled Five Years Comparative Analysis Chart Of Organizations Expenses And Savings Topics PDF. The topics addressed in these templates are Expenses Without Solution, Yearly Savings, Total Savings. All the content presented in this PPT design is completely editable. Download it and make adjustments in color, background, font etc. as per your unique business setting.
-
5 Years Price Comparative Analysis Chart Of Cloud Service Solutions Brochure PDF
This slide represents the table showing the five years comparison of prices incurred in installing cloud service solution in the organization. It includes details related to on-premises prices, cloud services price and savings for different years. Showcasing this set of slides titled 5 Years Price Comparative Analysis Chart Of Cloud Service Solutions Brochure PDF. The topics addressed in these templates are Cloud, Savings, 2018 To 2022. All the content presented in this PPT design is completely editable. Download it and make adjustments in color, background, font etc. as per your unique business setting.
-
5 Years Technological Comparative Analysis Chart Of Service Provisioning And Operational Costs Information PDF
This slide represents the five years technological and cost based comparison for use of passive optical network. It includes details related to ONT cost, service provisioning and operational costs for five years. Pitch your topic with ease and precision using this 5 Years Technological Comparative Analysis Chart Of Service Provisioning And Operational Costs Information PDF. This layout presents information on Optical Network Termination, Service Provisioning, Operational Cost. It is also available for immediate download and adjustment. So, changes can be made in the color, design, graphics or any other component to create a unique layout.
-
Issues And Impact Of Failure Mode And Effects Analysis Matrix Chart For FMEA Interpretation Icons PDF
This slide provides the matrix chart of potential severity and probability of occurrence to determine the high, medium and low priorities in order to take required actions.Deliver and pitch your topic in the best possible manner with this Issues And Impact Of Failure Mode And Effects Analysis Matrix Chart For FMEA Interpretation Icons PDF. Use them to share invaluable insights on Highest Priority, Medium Priority, Severity Occurrence and impress your audience. This template can be altered and modified as per your expectations. So, grab it now.
-
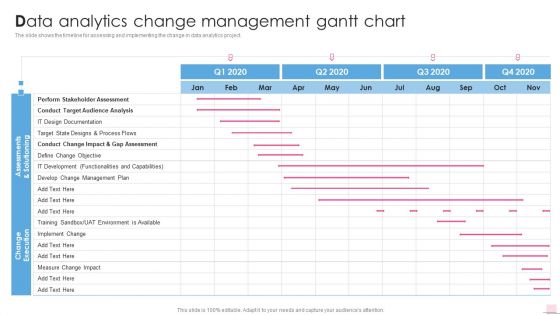
Data Analytics Change Management Gantt Chart Business Analysis Modification Toolkit Portrait PDF
Deliver an awe inspiring pitch with this creative Data Analytics Change Management Gantt Chart Business Analysis Modification Toolkit Portrait PDF bundle. Topics like Functionalities Capabilities, Environment Available, Implement Change can be discussed with this completely editable template. It is available for immediate download depending on the needs and requirements of the user.
-
Biyearly Gantt Chart For Project Analysis And Evaluation Structure PDF
Showcasing this set of slides titled Biyearly Gantt Chart For Project Analysis And Evaluation Structure PDF. The topics addressed in these templates are Project Planning, Project Design, Project Implementation. All the content presented in this PPT design is completely editable. Download it and make adjustments in color, background, font etc. as per your unique business setting.
-
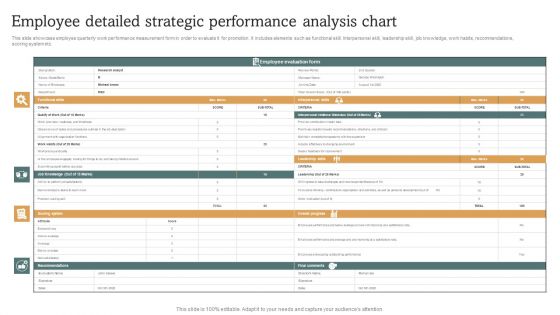
Employee Detailed Strategic Performance Analysis Chart Elements PDF
This slide showcase employee quarterly work performance measurement form in order to evaluate it for promotion. It includes elements such as functional skill. Interpersonal skill, leadership skill, job knowledge, work habits, recommendations, scoring system etc. Showcasing this set of slides titled Employee Detailed Strategic Performance Analysis Chart Elements PDF. The topics addressed in these templates are Employee Evaluation, Interpersonal Skills, Leadership Skills. All the content presented in this PPT design is completely editable. Download it and make adjustments in color, background, font etc. as per your unique business setting.
-
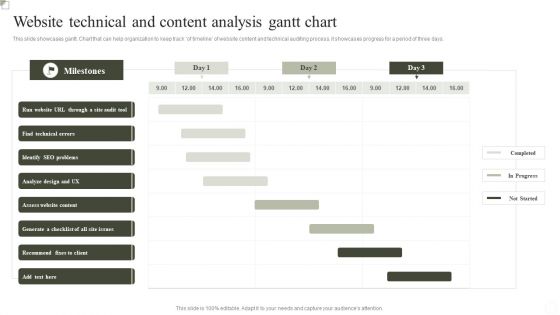
Website Technical And Content Analysis Gantt Chart Ppt Portfolio Example PDF
This slide showcases gantt. Chart that can help organization to keep track of timeline of website content and technical auditing process. it showcases progress for a period of three days. Pitch your topic with ease and precision using this Website Technical And Content Analysis Gantt Chart Ppt Portfolio Example PDF. This layout presents information on Find Technical Errors, Identify SEO Problems, Assess Website Content. It is also available for immediate download and adjustment. So, changes can be made in the color, design, graphics or any other component to create a unique layout.
-
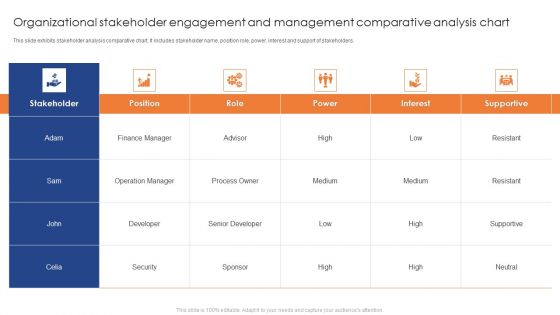
Organizational Stakeholder Engagement And Management Comparative Analysis Chart Professional PDF
This slide exhibits stakeholder analysis comparative chart. It includes stakeholder name, position role, power, interest and support of stakeholders. Showcasing this set of slides titled Organizational Stakeholder Engagement And Management Comparative Analysis Chart Professional PDF. The topics addressed in these templates are Finance Manager, Operation Manager, Developer. All the content presented in this PPT design is completely editable. Download it and make adjustments in color, background, font etc. as per your unique business setting.
-
Workflow Chart Representing Gap Analysis In Workforce Planning Formats PDF
This slide presents a flowchart which will help HR in conducting gap analysis in workforce planning to be used by human resource managers. The steps are identify, inspect, decision, implementation, analyze and improve. Persuade your audience using this Workflow Chart Representing Gap Analysis In Workforce Planning Formats PDF. This PPT design covers Six stages, thus making it a great tool to use. It also caters to a variety of topics including Identify, Inspect, Decision. Download this PPT design now to present a convincing pitch that not only emphasizes the topic but also showcases your presentation skills.
-
Pre And Post Report Analysis Bar Chart Icon Pictures PDF
Showcasing this set of slides titled Pre And Post Report Analysis Bar Chart Icon Pictures PDF. The topics addressed in these templates are Pre And Post Report Analysis, Bar Chart Icon. All the content presented in this PPT design is completely editable. Download it and make adjustments in color, background, font etc. as per your unique business setting.
-
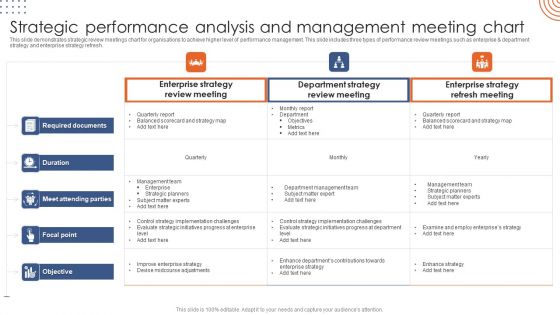
Strategic Performance Analysis And Management Meeting Chart Portrait PDF
This slide demonstrates strategic review meetings chart for organisations to achieve higher level of performance management. This slide includes three types of performance review meetings such as enterprise and department strategy and enterprise strategy refresh. Pitch your topic with ease and precision using this Strategic Performance Analysis And Management Meeting Chart Portrait PDF. This layout presents information on Enterprise Strategy, Review Meeting, Department Strategy. It is also available for immediate download and adjustment. So, changes can be made in the color, design, graphics or any other component to create a unique layout.


