Chart analysis PowerPoint Presentation Templates and Google Slides
-
5 Years Comparative Analysis Chart Ppt PowerPoint Presentation Complete Deck With Slides
Improve your presentation delivery using this 5 Years Comparative Analysis Chart Ppt PowerPoint Presentation Complete Deck With Slides. Support your business vision and objectives using this well-structured PPT deck. This template offers a great starting point for delivering beautifully designed presentations on the topic of your choice. Comprising twenty slides this professionally designed template is all you need to host discussion and meetings with collaborators. Each slide is self-explanatory and equipped with high-quality graphics that can be adjusted to your needs. Therefore, you will face no difficulty in portraying your desired content using this PPT slideshow. This PowerPoint slideshow contains every important element that you need for a great pitch. It is not only editable but also available for immediate download and utilization. The color, font size, background, shapes everything can be modified to create your unique presentation layout. Therefore, download it now.
-
Market Analysis Chart Digital Content Ppt PowerPoint Presentation Complete Deck With Slides
Improve your presentation delivery using this market analysis chart digital content ppt powerpoint presentation complete deck with slides. Support your business vision and objectives using this well-structured PPT deck. This template offers a great starting point for delivering beautifully designed presentations on the topic of your choice. Comprising twelve this professionally designed template is all you need to host discussion and meetings with collaborators. Each slide is self-explanatory and equipped with high-quality graphics that can be adjusted to your needs. Therefore, you will face no difficulty in portraying your desired content using this PPT slideshow. This PowerPoint slideshow contains every important element that you need for a great pitch. It is not only editable but also available for immediate download and utilization. The color, font size, background, shapes everything can be modified to create your unique presentation layout. Therefore, download it now.
-
Competitor Analysis Table Organization Chart Ppt PowerPoint Presentation Complete Deck With Slides
Boost your confidence and team morale with this well-structured competitor analysis table organization chart ppt powerpoint presentation complete deck with slides. This prefabricated set gives a voice to your presentation because of its well-researched content and graphics. Our experts have added all the components very carefully, thus helping you deliver great presentations with a single click. Not only that, it contains a set of twelve slides that are designed using the right visuals, graphics, etc. Various topics can be discussed, and effective brainstorming sessions can be conducted using the wide variety of slides added in this complete deck. Apart from this, our PPT design contains clear instructions to help you restructure your presentations and create multiple variations. The color, format, design anything can be modified as deemed fit by the user. Not only this, it is available for immediate download. So, grab it now.
-
Competitor Analysis Comparison Chart Ppt PowerPoint Presentation Complete Deck With Slides
Share a great deal of information on the topic by deploying this Competitor Analysis Comparison Chart Ppt PowerPoint Presentation Complete Deck With Slides. Support your ideas and thought process with this prefabricated set. It includes a set of twelve slides, all fully modifiable and editable. Each slide can be restructured and induced with the information and content of your choice. You can add or remove large content boxes as well, to make this PPT slideshow more personalized. Its high-quality graphics and visuals help in presenting a well-coordinated pitch. This PPT template is also a resourceful tool to take visual cues from and implement the best ideas to help your business grow and expand. The main attraction of this well-formulated deck is that everything is editable, giving you the freedom to adjust it to your liking and choice. Changes can be made in the background and theme as well to deliver an outstanding pitch. Therefore, click on the download button now to gain full access to this multifunctional set.
-
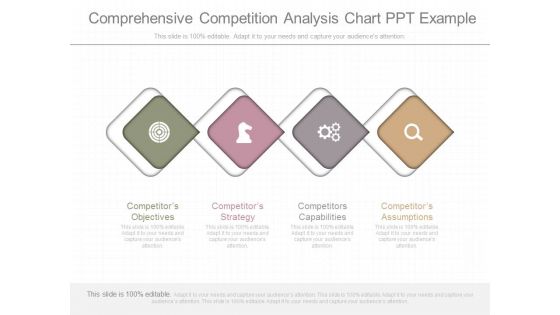
Comprehensive Competition Analysis Chart Ppt Example
This is a comprehensive competition analysis chart ppt example. This is a four stage process. The stages in this process are competitors objectives, competitors strategy, competitors capabilities, competitors assumptions.
-
Data Visualization And Predictive Analysis Chart Ppt Slides
This is a data visualization and predictive analysis chart ppt slides. This is a nine stage process. The stages in this process are business requirement, data exploration, data selection, data preparation, design model, validate model, deploy model, analyze results, update model, revalidate.
-
The Problem Analysis Venn Chart Ppt Examples Professional
This is a the problem analysis venn chart ppt examples professional. This is a eight stage process. The stages in this process are business, analysis, marketing, process, strategy.
-
Competitor Analysis 2 X 2 Matrix Chart Powerpoint Slide Show
This is a competitor analysis 2 x 2 matrix chart powerpoint slide show. This is a four stage process. The stages in this process are competitor, your company, competitor, complex, simple, fast, slow.
-
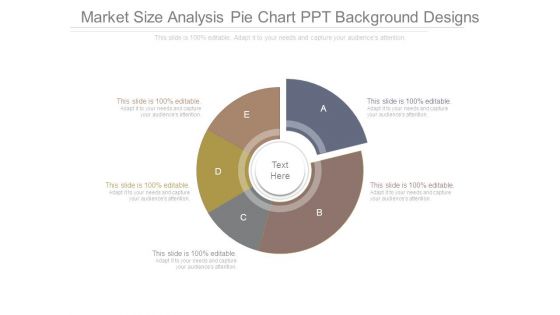
Market Size Analysis Pie Chart Ppt Background Designs
This is a market size analysis pie chart ppt background designs. This is a five stage process. The stages in this process are donut, business, marketing, process.
-
Quarterly Money Flow Analysis Chart Presentation Design
This is a quarterly money flow analysis chart presentation design. This is a four stage process. The stages in this process are cash position, cash in, initial funding, sales, total cash in, cash out, start up costs, product costs, marketing, fixed costs, principal payments, total cash out, inflows outflows, cumulative.
-
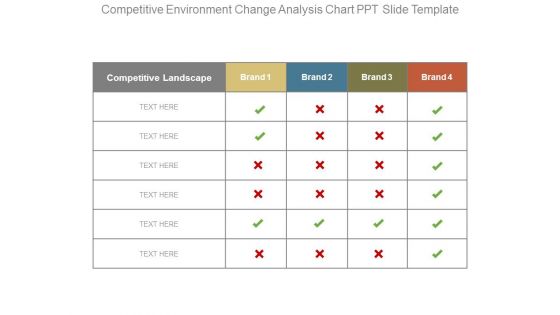
Competitive Environment Change Analysis Chart Ppt Slide Template
This is a competitive environment change analysis chart ppt slide template. This is a four stage process. The stages in this process are competitive landscape, brand.
-
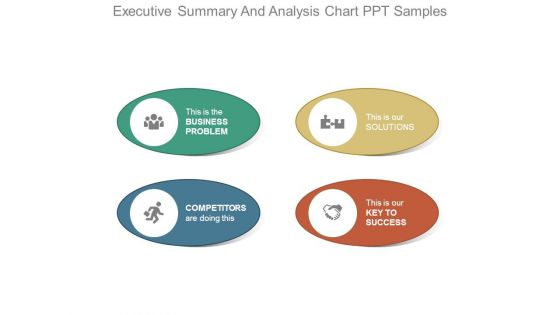
Executive Summary And Analysis Chart Ppt Samples
This is a executive summary and analysis chart ppt samples. This is a four stage process. The stages in this process are this is the business problem, this is our solutions, competitors are doing this, this is our key to success.
-
Fund Flow Analysis Chart Ppt Powerpoint Slide Designs
This is a fund flow analysis chart ppt powerpoint slide designs. This is a five stage process. The stages in this process are sources of funds, long term funds, uses of funds, long term uses, working capital.
-
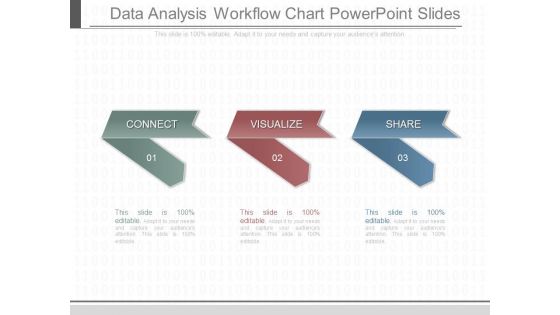
Data Analysis Workflow Chart Powerpoint Slides
This is a data analysis workflow chart powerpoint slides. This is a three stage process. The stages in this process are connect, visualize, share.
-
Flow Chart Of Safety Function Analysis Ppt Powerpoint Layout
This is a flow chart of safety function analysis ppt powerpoint layout. This is a six stage process. The stages in this process are hazard identification, limits of the machination, risk estimation, is the machine safe, risk reduction, risk evaluation.
-
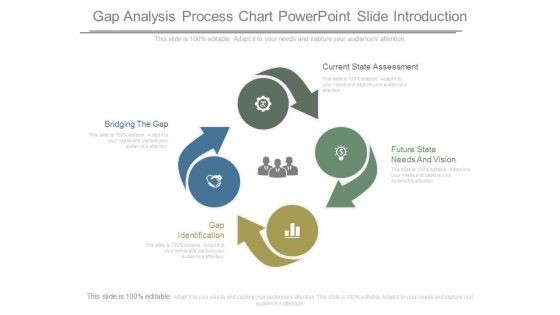
Gap Analysis Process Chart Powerpoint Slide Introduction
This is a gap analysis process chart powerpoint slide introduction. This is a four stage process. The stages in this process are bridging the gap, gap identification, future state needs and vision, current state assessment.
-
Strategic Alliances And Gap Analysis Chart Powerpoint Images
This is a strategic alliances and gap analysis chart powerpoint images. This is a four stage process. The stages in this process are solution mapping, gap analysis, capacity planning, ecosystem valuation.
-
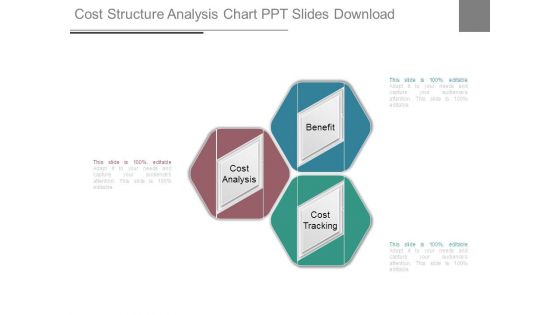
Cost Structure Analysis Chart Ppt Slides Download
This is a cost structure analysis chart ppt slides download. This is a three stage process. The stages in this process are cost analysis, benefit, cost tracking.
-
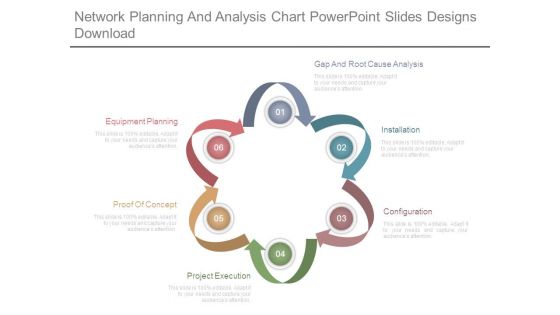
Network Planning And Analysis Chart Powerpoint Slides Designs Download
This is a network planning and analysis chart powerpoint slides designs download. This is a six stage process. The stages in this process are equipment planning, proof of concept, project execution, configuration, installation, gap and root cause analysis.
-
Trade Procurement Analysis Chart Ppt Examples Slides
This is a trade procurement analysis chart ppt examples slides. This is a eight stage process. The stages in this process are operations, total spend, account payable, spend under management, realized saving, procurement, negotiated saving, saving realization.
-
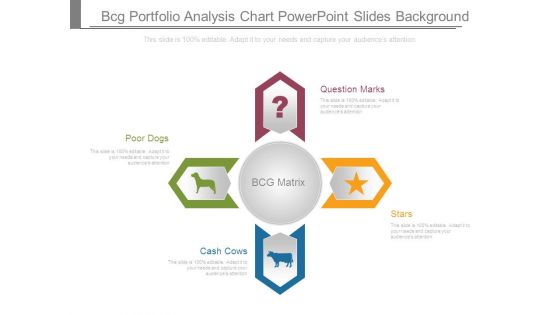
Bcg Portfolio Analysis Chart Powerpoint Slides Background
This is a bcg portfolio analysis chart powerpoint slides background. This is a four stage process. The stages in this process are question marks, stars, cash cows, poor dogs.
-
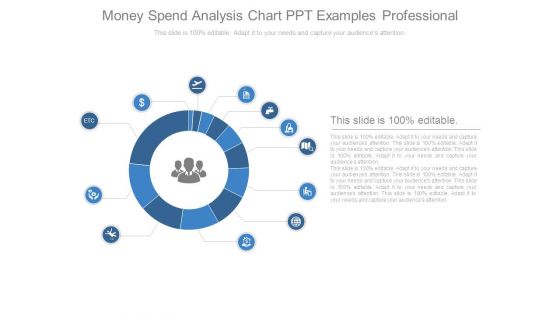
Money Spend Analysis Chart Ppt Examples Professional
This is a money spend analysis chart ppt examples professional. This is a twelve stage process. The stages in this process are marketing, business, icon, process, management.
-
Market Size Analysis Pie Charts Ppt Images
This is a market size analysis pie charts ppt images. This is a three stage process. The stages in this process are business, marketing, analysis, management, strategy.
-
Market Size And Contribution Analysis Chart Ppt Ideas
This is a market size and contribution analysis chart ppt ideas. This is a six stage process. The stages in this process are business, marketing, contribution, management, ideas.
-
Competitive Analysis Table Chart Powerpoint Guide
This is a competitive analysis table chart powerpoint guide. This is a twelve stage process. The stages in this process are jan,feb, mar, apr, may, jun, jul, aug, sep, oct, nov, dec.
-
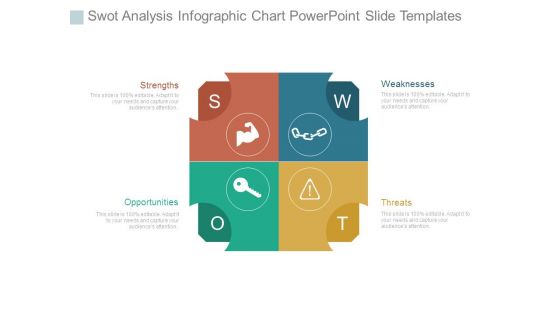
Swot Analysis Infographic Chart Powerpoint Slide Templates
This is a swot analysis infographic chart powerpoint slide templates. This is a four stage process. The stages in this process are strengths, opportunities, threats, weaknesses.
-
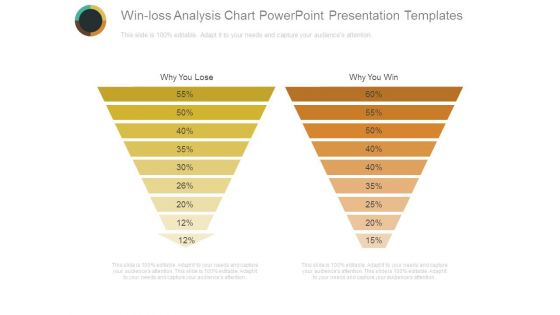
Win Loss Analysis Chart Powerpoint Presentation Templates
This is a win loss analysis chart powerpoint presentation templates. This is a two stage process. The stages in this process are business, management, marketing, sales, funnel.
-
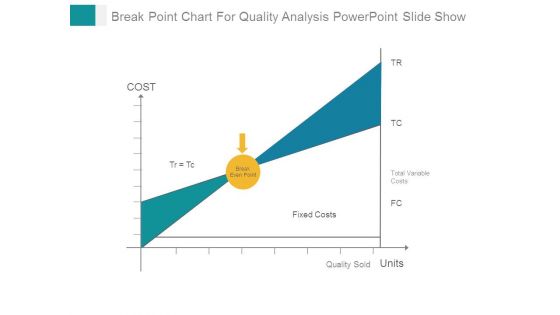
Break Point Chart For Quality Analysis Powerpoint Slide Show
This is a break point chart for quality analysis powerpoint slide show. This is a one stage process. The stages in this process are total variable costs, fixed costs, quality sold.
-
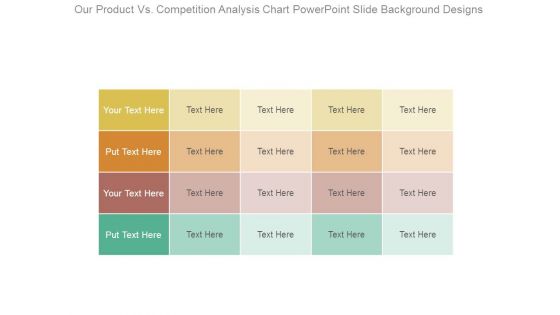
Our Product Vs Competition Analysis Chart Powerpoint Slide Background Designs
This is a our product vs competition analysis chart powerpoint slide background designs. This is a four stage process. The stages in this process are business, marketing, success, strategy, compare.
-
Financial Analysis Progressive Chart Powerpoint Slide Download
This is a financial analysis progressive chart powerpoint slide download. This is a three stage process. The stages in this process are 3 point 4 percent dollar 832 point 5m, 7 point 5 percent dollar 435 point 2 m, 10 point 1 percent dollar 721 point 8m.
-
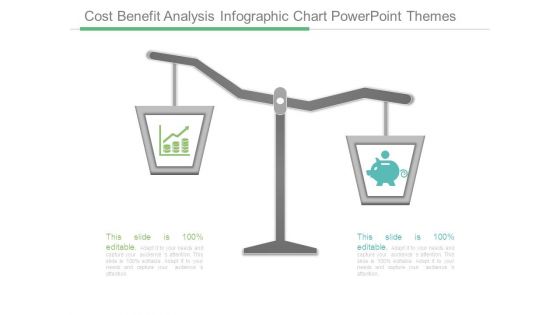
Cost Benefit Analysis Infographic Chart Powerpoint Themes
This is a cost benefit analysis infographic chart powerpoint themes. This is a two stage process. The stages in this process are balance, icons, finance, strategy, business.
-
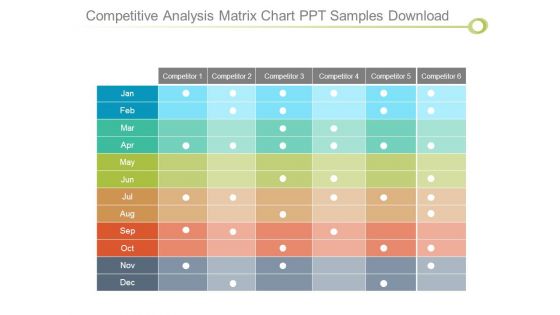
Competitive Analysis Matrix Chart Ppt Samples Download
This is a competitive analysis matrix chart ppt samples download. This is a six stage process. The stages in this process are competitor, jan, feb, mar, apr, may, jun, jul, aug, sep, oct, nov, dec.
-
Business Expenditure Analysis Pie Charts Ppt Infographic Template
This is a business expenditure analysis pie charts ppt infographic template. This is a three stage process. The stages in this process are pie, business, marketing, finance, success.
-
Market Size Analysis Pie Charts Ppt Background Images
This is a market size analysis pie charts ppt background images. This is a three stage process. The stages in this process are in team of users, in team of revenue from customers, target market, we are planning to acquire users first and then paid customer, advertisers, event organizers, mentors.
-
Market Share Analysis Pie Chart Sample Of Ppt
This is a market share analysis pie chart sample of ppt. This is a three stage process. The stages in this process are serviceable available market sam, target market, total available market tam, market share.
-
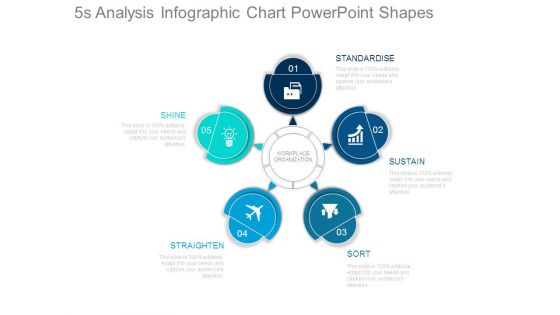
5s Analysis Infographic Chart Powerpoint Shapes
This is a 5s analysis infographic chart powerpoint shapes. This is a five stage process. The stages in this process are workplace organization, shine, straighten, sort, sustain, standardise.
-
Cost Benefit Analysis Chart With Icons Powerpoint Layout
This is a cost benefit analysis chart with icons powerpoint layout. This is a two stage process. The stages in this process are balance scale, compare, business, marketing, management.
-
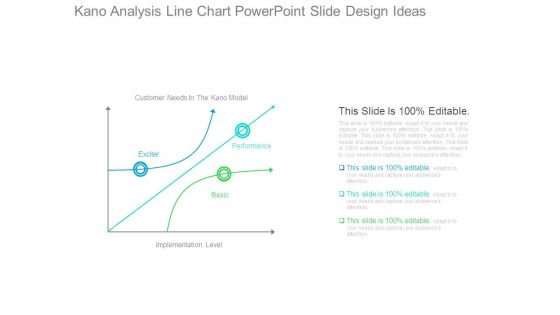
Kano Analysis Line Chart Powerpoint Slide Design Ideas
This is a kano analysis line chart powerpoint slide design ideas. This is a three stage process. The stages in this process are customer needs in the kano model, exciter, performance, basic, implementation level.
-
Pie Charts For Pareto Analysis Powerpoint Slide Backgrounds
This is a pie charts for pareto analysis powerpoint slide backgrounds. This is a two stage process. The stages in this process are reasons, complaints.
-
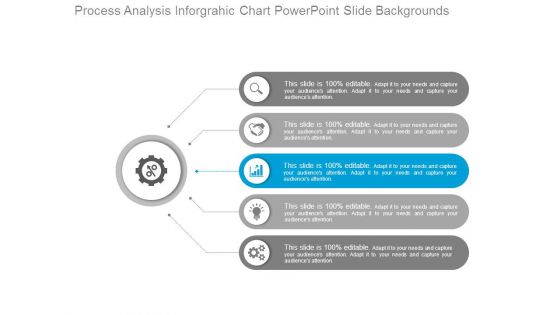
Process Analysis Inforgrahic Chart Powerpoint Slide Backgrounds
This is a process analysis inforgrahic chart powerpoint slide backgrounds. This is a five stage process. The stages in this process are customer business, marketing, icons, strategy.
-
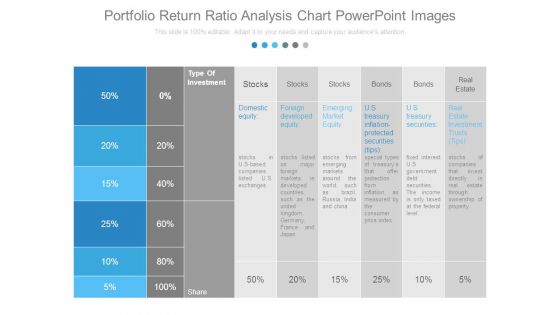
Portfolio Return Ratio Analysis Chart Powerpoint Images
This is a portfolio return ratio analysis chart powerpoint images. This is a six stage process. The stages in this process are type of investment, stocks, bonds, real estate, domestic equity, foreign developed equity, emerging market equity, u s treasury inflation protected securities tips, u s treasury securities, real estate investment trusts tips, share.
-
Process Flow Chart Project Execution Analysis Ppt Ideas
This is a process flow chart project execution analysis ppt ideas. This is a six stage process. The stages in this process are functional design, testing, test plan, user requirements, implementation, commissioning and start up.
-
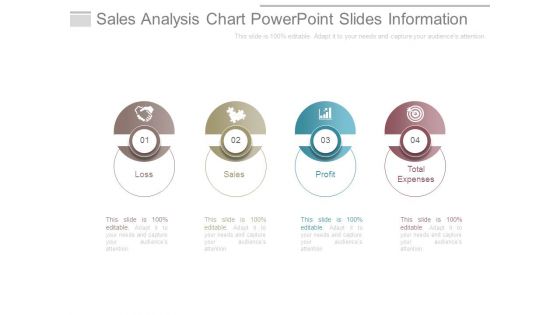
Sales Analysis Chart Powerpoint Slides Information
This is a sales analysis chart powerpoint slides information. This is a four stage process. The stages in this process are loss, sales, profit, total expenses.
-
Bar Chart With Magnifying Glass For Financial Analysis Ppt Powerpoint Presentation Infographics Designs Download
This is a bar chart with magnifying glass for financial analysis ppt powerpoint presentation infographics designs download. This is a three stage process. The stages in this process are business metrics, business kpi, business dashboard.
-
Business Analysis Data Charts And Reports Ppt Powerpoint Presentation Ideas Portrait
This is a business analysis data charts and reports ppt powerpoint presentation ideas portrait. This is a three stage process. The stages in this process are business metrics, business kpi, business dashboard.
-
Financial Charts And Graphs For Statistical Analysis Ppt Powerpoint Presentation Show Layout
This is a financial charts and graphs for statistical analysis ppt powerpoint presentation show layout. This is a four stage process. The stages in this process are business metrics, business kpi, business dashboard.
-
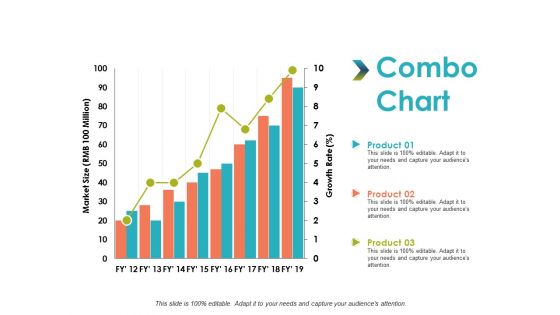
Combo Chart Analysis Management Ppt PowerPoint Presentation Professional Gridlines
This is a combo chart analysis management ppt powerpoint presentation professional gridlines. This is a three stage process. The stages in this process are combo chart, finance, marketing, business, analysis.
-
Data Collection And Analysis Control Chart Ppt PowerPoint Presentation Slide Download
This is a data collection and analysis control chart ppt powerpoint presentation slide download. This is a three stage process. The stages in this process are line chart, finance, marketing, management, investment.
-
Combo Chart Marketing Analysis Ppt Powerpoint Presentation Pictures Icons
This is a combo chart marketing analysis ppt powerpoint presentation pictures icons. This is a three stage process. The stages in this process are finance, marketing, management, investment, analysis.
-
Scatter Chart Analysis Marketing Ppt Powerpoint Presentation Summary Infographic Template
This is a scatter chart analysis marketing ppt powerpoint presentation summary infographic template. This is a two stage process. The stages in this process are finance, marketing, management, investment, analysis.
-
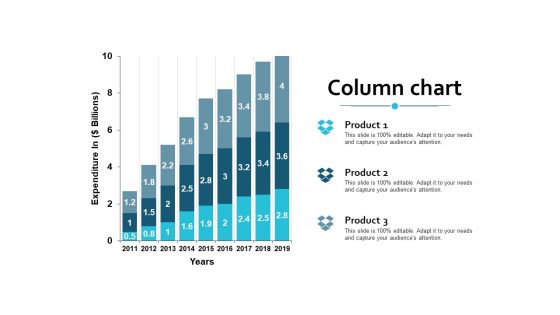
Stacked Column Chart Analysis Ppt PowerPoint Presentation Slides Graphics Design
This is a stacked column chart analysis ppt powerpoint presentation slides graphics design. This is a three stage process. The stages in this process are finance, marketing, management, investment, analysis.
-
Eight Sections Pie Chart For Percentage Data Analysis Ppt PowerPoint Presentation Styles Icons
This is a eight sections pie chart for percentage data analysis ppt powerpoint presentation styles icons. This is a eight stage process. The stages in this process are 6 piece pie chart, 6 segment pie chart, 6 parts pie chart.
-
Data Comparison And Analysis Chart Ppt Powerpoint Presentation File Background Images
This is a data comparison and analysis chart ppt powerpoint presentation file background images. This is a four stage process. The stages in this process are data presentation, content presentation, information presentation.
-
Bar Charts For Business Performance Analysis Ppt PowerPoint Presentation Show Slideshow
This is a bar charts for business performance analysis ppt powerpoint presentation show slideshow. This is a two stage process. The stages in this process are compare, comparison of two, competitive analysis.
-
Data Analysis Chart For Funds Management Ppt PowerPoint Presentation Infographic Template Files
This is a data analysis chart for funds management ppt powerpoint presentation infographic template files. This is a five stage process. The stages in this process are financial analysis, quantitative, statistical modelling.
-
Data Chart For Individual Income Analysis Ppt PowerPoint Presentation Layouts Visual Aids
This is a data chart for individual income analysis ppt powerpoint presentation layouts visual aids. This is a five stage process. The stages in this process are financial analysis, quantitative, statistical modelling.
-
Quantitative Bar Chart For Data Analysis Ppt PowerPoint Presentation Model Graphic Tips
This is a quantitative bar chart for data analysis ppt powerpoint presentation model graphic tips. This is a two stage process. The stages in this process are financial analysis, quantitative, statistical modelling.
-
Yearly Business Performance Chart For Customer Profitability Analysis Ppt PowerPoint Presentation Ideas Picture
This is a yearly business performance chart for customer profitability analysis ppt powerpoint presentation ideas picture. This is a five stage process. The stages in this process are financial analysis, quantitative, statistical modelling.
-
Column Chart Analysis Ppt Powerpoint Presentation Summary Infographics
This is a column chart analysis ppt powerpoint presentation summary infographics. This is a three stage process. The stages in this process are column chart, finance, marketing, management, analysiscolumn chart, finance, marketing, management, analysis.
-
Stock Chart Finance Analysis Ppt Powerpoint Presentation Ideas Portrait
This is a stock chart finance analysis ppt powerpoint presentation ideas portrait. This is a three stage process. The stages in this process are finance, marketing, management, investment, strategy.


