Chart analysis PowerPoint Presentation Templates and Google Slides
-
Input Process Output Chart Analysis In Recruitment Process Sample PDF
This slide covers the IPO chart analysis used in recruitment process by the human resource department. The purpose of this table is improve the hiring process of an organization. It includes information related to the input, process, output and HR. Showcasing this set of slides titled Input Process Output Chart Analysis In Recruitment Process Sample PDF. The topics addressed in these templates are Business Leaders, Manager, Recruiter, Agency. All the content presented in this PPT design is completely editable. Download it and make adjustments in color, background, font etc. as per your unique business setting.
-
Input Process Output Processing Analysis Chart Icon Sample PDF
Presenting Input Process Output Processing Analysis Chart Icon Sample PDF to dispense important information. This template comprises Three stages. It also presents valuable insights into the topics including Input Process, Output Processing, Analysis Chart. This is a completely customizable PowerPoint theme that can be put to use immediately. So, download it and address the topic impactfully.
-
Error Tracking With Priority And Status Analysis Chart Icons PDF
This template covers issues analysis reports based on problem status and priority level. It also includes KPIs such as department, reporting date, responsible person, the actual status of the issue, etc. Showcasing this set of slides titled Error Tracking With Priority And Status Analysis Chart Icons PDF. The topics addressed in these templates are Issue Description, Current Status Issues, Analysis Chart. All the content presented in this PPT design is completely editable. Download it and make adjustments in color, background, font etc. as per your unique business setting.
-
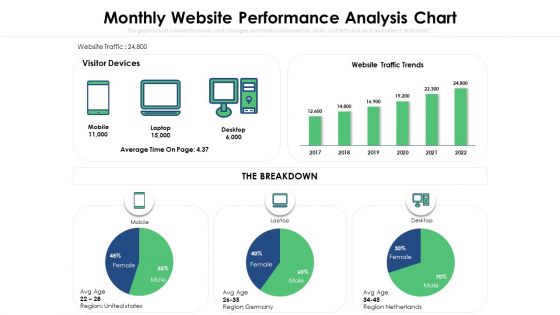
Monthly Website Performance Analysis Chart Ppt PowerPoint Presentation Model Skills PDF
Pitch your topic with ease and precision using this monthly website performance analysis chart ppt powerpoint presentation model skills pdf. This layout presents information on visitor devices, maverage time, the breakdown, laptop, desktop, mobile. It is also available for immediate download and adjustment. So, changes can be made in the color, design, graphics or any other component to create a unique layout.
-
Cyber Computing Services Risk Analysis Software Status Chart Portrait PDF
This slide illustrates different digitally enabled cyber computing applications. It includes risk severity chart, action cost along with risk owner details and implementation due date. Showcasing this set of slides titled Cyber Computing Services Risk Analysis Software Status Chart Portrait PDF. The topics addressed in these templates are Risk Treatment, Risk Owner, Implementation. All the content presented in this PPT design is completely editable. Download it and make adjustments in color, background, font etc. as per your unique business setting.
-
Corporate Vulnerability Analysis Process Flow Chart Summary PDF
This slide showcases the enterprise vulnerability management process flow chart. It also includes stages such as information gathering, questionnaire, vendor response, risk management, remediation and validation. Pitch your topic with ease and precision using this Corporate Vulnerability Analysis Process Flow Chart Summary PDF. This layout presents information on Vender Response, Risk Assessment, Information Gathering. It is also available for immediate download and adjustment. So, changes can be made in the color, design, graphics or any other component to create a unique layout.
-
Value Canvas Icon With Competitor Analysis Chart Pictures Pdf
Showcasing this set of slides titled Value Canvas Icon With Competitor Analysis Chart Pictures Pdf. The topics addressed in these templates are Value Canvas Icon, Competitor Analysis Chart. All the content presented in this PPT design is completely editable. Download it and make adjustments in color, background, font etc. as per your unique business setting.
-
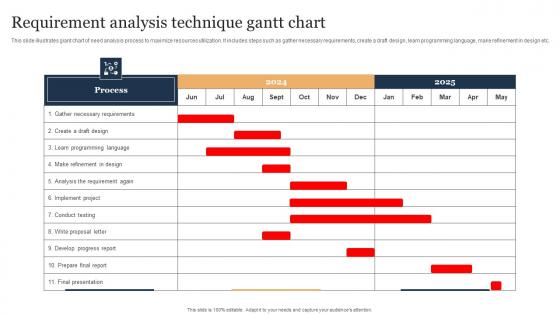
Requirement Analysis Technique Gantt Chart Guidelines Pdf
This slide illustrates giant chart of need analysis process to maximize resources utilization. It includes steps such as gather necessary requirements, create a draft design, learn programming language, make refinement in design etc. Pitch your topic with ease and precision using this Requirement Analysis Technique Gantt Chart Guidelines Pdf. This layout presents information on Requirement Analysis Technique, Resources Utilization, Learn Programming Language. It is also available for immediate download and adjustment. So, changes can be made in the color, design, graphics or any other component to create a unique layout.
-
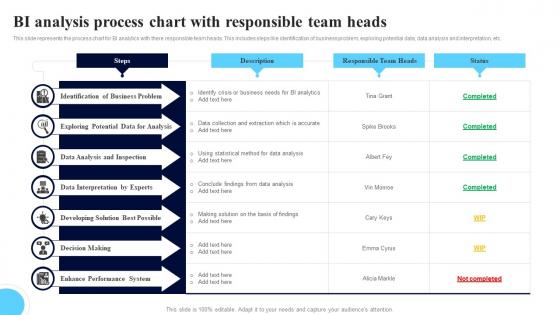
BI Analysis Process Chart With Responsible Team Heads Mockup Pdf
This slide represents the process chart for BI analytics with there responsible team heads. This includes steps like identification of business problem, exploring potential data, data analysis and interpretation, etc. Showcasing this set of slides titled BI Analysis Process Chart With Responsible Team Heads Mockup Pdf. The topics addressed in these templates are Identification Of Business, Data Analysis, Data Interpretation. All the content presented in this PPT design is completely editable. Download it and make adjustments in color, background, font etc. as per your unique business setting.
-
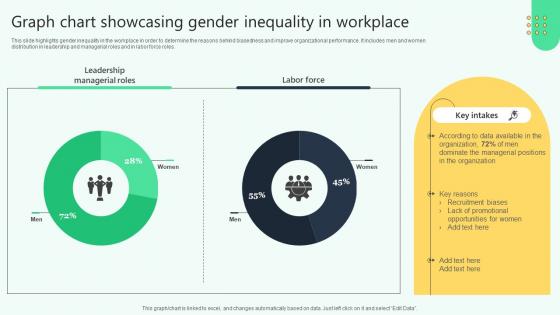
Graph Chart Showcasing Gender Inequality In Workplace Analysing Hr Data For Effective Decision Making
This slide highlights gender inequality in the workplace in order to determine the reasons behind biasedness and improve organizational performance. It includes men and women distribution in leadership and managerial roles and in labor force roles. This Graph Chart Showcasing Gender Inequality In Workplace Analysing Hr Data For Effective Decision Making is perfect for any presentation, be it in front of clients or colleagues. It is a versatile and stylish solution for organizing your meetings. The Graph Chart Showcasing Gender Inequality In Workplace Analysing Hr Data For Effective Decision Making features a modern design for your presentation meetings. The adjustable and customizable slides provide unlimited possibilities for acing up your presentation. Slidegeeks has done all the homework before launching the product for you. So, do not wait, grab the presentation templates today
-
Administering Quality Assurance Sample Control Chart Analysis To Measure Project Defects PM SS V
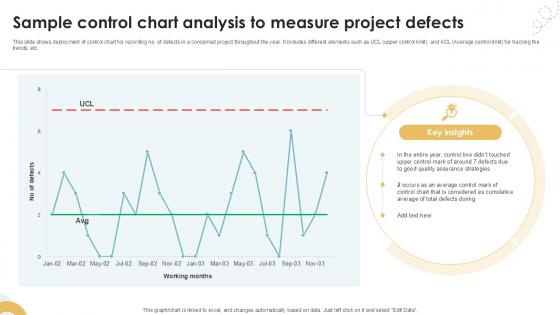
This slide shows deployment of control chart for recording no. of defects in a concerned project throughout the year. It includes different elements such as UCL upper control limit and ACL Average control limit for tracking the trends, etc. From laying roadmaps to briefing everything in detail, our templates are perfect for you. You can set the stage with your presentation slides. All you have to do is download these easy-to-edit and customizable templates. Administering Quality Assurance Sample Control Chart Analysis To Measure Project Defects PM SS V will help you deliver an outstanding performance that everyone would remember and praise you for. Do download this presentation today.
-
Sample Control Chart Analysis To Measure Project Executing Quality Ppt Sample PM SS V
This slide shows deployment of control chart for recording no. of defects in a concerned project throughout the year. It includes different elements such as UCL upper control limit and ACL Average control limit for tracking the trends, etc. Do you have an important presentation coming up Are you looking for something that will make your presentation stand out from the rest Look no further than Sample Control Chart Analysis To Measure Project Executing Quality Ppt Sample PM SS V. With our professional designs, you can trust that your presentation will pop and make delivering it a smooth process. And with Slidegeeks, you can trust that your presentation will be unique and memorable. So why wait Grab Sample Control Chart Analysis To Measure Project Executing Quality Ppt Sample PM SS V today and make your presentation stand out from the rest


