Sample Control Chart Analysis To Measure Project Executing Quality Ppt Sample PM SS V
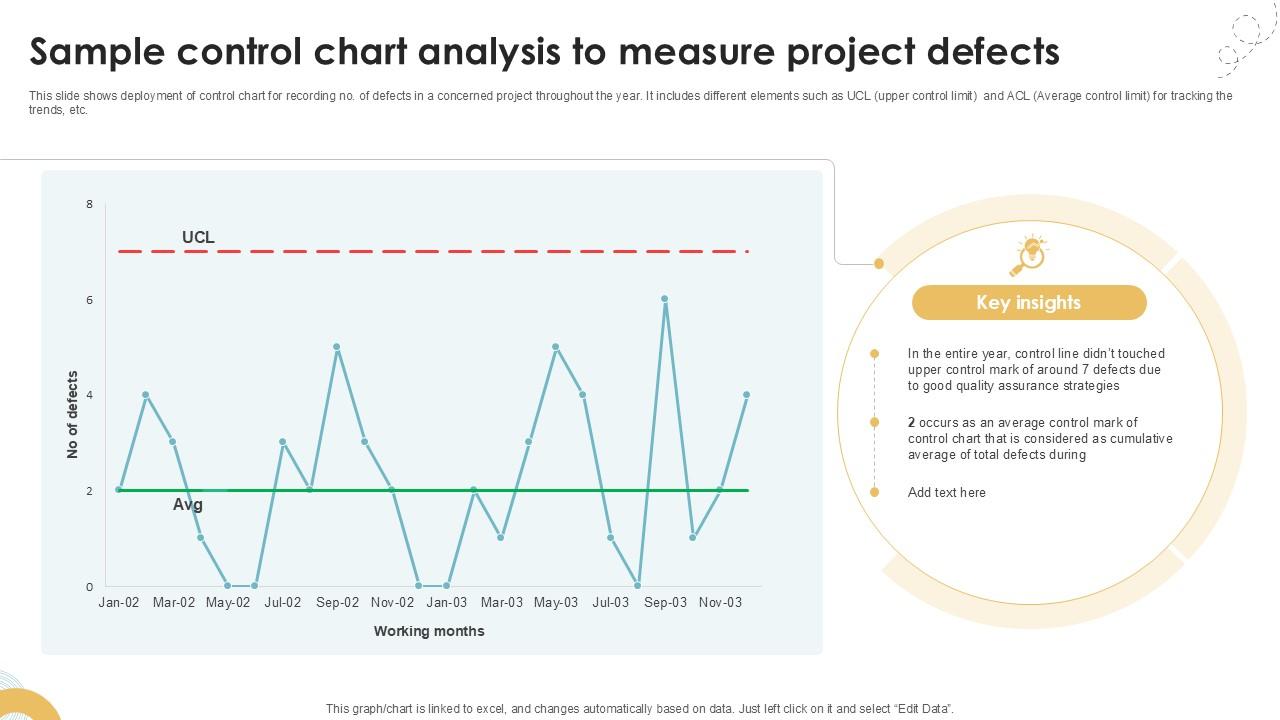
This slide shows deployment of control chart for recording no. of defects in a concerned project throughout the year. It includes different elements such as UCL upper control limit and ACL Average control limit for tracking the trends, etc.
- Google Slides is a new FREE Presentation software from Google.
- All our content is 100% compatible with Google Slides.
- Just download our designs, and upload them to Google Slides and they will work automatically.
- Amaze your audience with SlideGeeks and Google Slides.
-
Want Changes to This PPT Slide? Check out our Presentation Design Services
- WideScreen Aspect ratio is becoming a very popular format. When you download this product, the downloaded ZIP will contain this product in both standard and widescreen format.
-

- Some older products that we have may only be in standard format, but they can easily be converted to widescreen.
- To do this, please open the SlideGeeks product in Powerpoint, and go to
- Design ( On the top bar) -> Page Setup -> and select "On-screen Show (16:9)” in the drop down for "Slides Sized for".
- The slide or theme will change to widescreen, and all graphics will adjust automatically. You can similarly convert our content to any other desired screen aspect ratio.
Compatible With Google Slides

Get This In WideScreen
You must be logged in to download this presentation.
 Impress Your
 Audience
 100%
100% Editable
Google Slides
Features of these PowerPoint presentation slides:
This slide shows deployment of control chart for recording no. of defects in a concerned project throughout the year. It includes different elements such as UCL upper control limit and ACL Average control limit for tracking the trends, etc. Do you have an important presentation coming up Are you looking for something that will make your presentation stand out from the rest Look no further than Sample Control Chart Analysis To Measure Project Executing Quality Ppt Sample PM SS V. With our professional designs, you can trust that your presentation will pop and make delivering it a smooth process. And with Slidegeeks, you can trust that your presentation will be unique and memorable. So why wait Grab Sample Control Chart Analysis To Measure Project Executing Quality Ppt Sample PM SS V today and make your presentation stand out from the rest This slide shows deployment of control chart for recording no. of defects in a concerned project throughout the year. It includes different elements such as UCL upper control limit and ACL Average control limit for tracking the trends, etc.
People who downloaded this PowerPoint presentation also viewed the following :
Sample Control Chart Analysis To Measure Project Executing Quality Ppt Sample PM SS V with all 10 slides:
Use our Sample Control Chart Analysis To Measure Project Executing Quality Ppt Sample PM SS V to effectively help you save your valuable time. They are readymade to fit into any presentation structure.
Most Relevant Reviews
-
Commendable slides with attractive designs. Extremely pleased with the fact that they are easy to modify. Great work!
-
Informative presentations that are easily editable.

 Home
Home 


