Survey Infographic

Key Financial Ratios Template 1 Ppt PowerPoint Presentation Infographics Shapes
This is a key financial ratios template 1 ppt powerpoint presentation infographics shapes. This is a four stage process. The stages in this process are business, marketing, analysis, finance, icon.
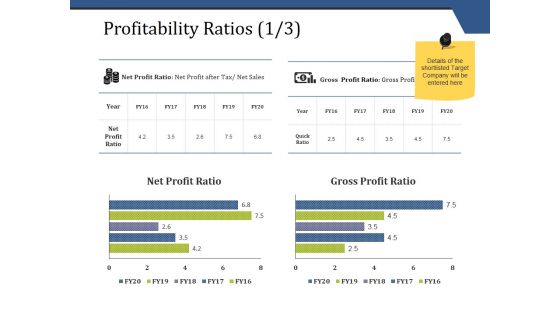
Profitability Ratios Template 1 Ppt PowerPoint Presentation Infographics Mockup
This is a profitability ratios template 1 ppt powerpoint presentation infographics mockup. This is a two stage process. The stages in this process are business, finance, marketing, strategy, analysis.

Capex Summary Template 1 Ppt PowerPoint Presentation Infographics Mockup
This is a capex summary template 1 ppt powerpoint presentation infographics mockup. This is a four stage process. The stages in this process are finance, marketing, business, analysis, strategy.

Project Task List Template 2 Ppt PowerPoint Presentation Infographics Brochure
This is a project task list template 2 ppt powerpoint presentation infographics brochure. This is a three stage process. The stages in this process are finance, business, marketing, analysis, strategy.

Clustered Column Line Ppt PowerPoint Presentation Infographics Graphics Design
This is a clustered column line ppt powerpoint presentation infographics graphics design. This is a three stage process. The stages in this process are finance, marketing, business, analysis, management.
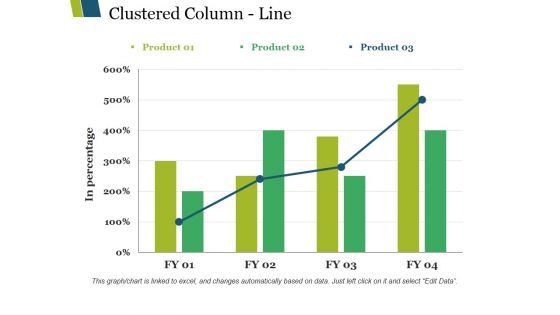
Clustered Column Line Ppt PowerPoint Presentation Infographics Background Images
This is a clustered column line ppt powerpoint presentation infographics background images. This is a three stage process. The stages in this process are clustered column line, finance, analysis, marketing, business.

Summary Financials Revenue Ebitda Pat Ppt PowerPoint Presentation Infographics Ideas
This is a summary financials revenue ebitda pat ppt powerpoint presentation infographics ideas. This is a three stage process. The stages in this process are business, finance, analysis, marketing, strategy.

Line Chart Ppt PowerPoint Presentation Infographics File Formats
This is a line chart ppt powerpoint presentation infographics file formats. This is a two stage process. The stages in this process are line chart, growth, strategy, analysis, business.
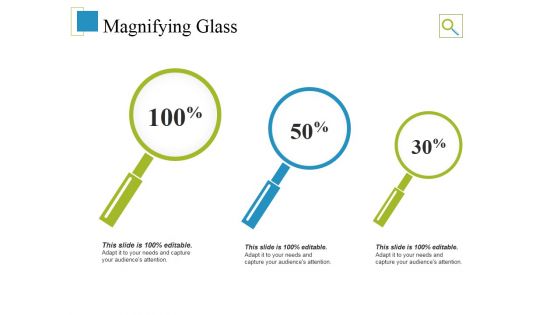
Magnifying Glass Ppt PowerPoint Presentation Infographics Designs Download
This is a magnifying glass ppt powerpoint presentation infographics designs download. This is a three stage process. The stages in this process are magnifying glass, search, marketing, strategy, analysis, business.
Enterprise Resource Planning Funnel Ppt PowerPoint Presentation Infographics Icons
This is a enterprise resource planning funnel ppt powerpoint presentation infographics icons. This is a five stage process. The stages in this process are project preparation, situational analysis, software selection, realization and implementation, support from management.

Enterprise Resource Planning Funnel Ppt PowerPoint Presentation Infographics Clipart Images
This is a enterprise resource planning funnel ppt powerpoint presentation infographics clipart images. This is a five stage process. The stages in this process are project preparation, situational analysis, software selection, concept fine, realization and implementation.

Tips For Selecting Erp System Ppt PowerPoint Presentation Infographics Graphics
This is a tips for selecting erp system ppt powerpoint presentation infographics graphics. This is a six stage process. The stages in this process are cost planning, erp industry solutions, requirement analysis, usability requirements, versatility and expandability.

Financial Due Diligence Ppt PowerPoint Presentation Infographics Graphics
This is a financial due diligence ppt powerpoint presentation infographics graphics. This is a one stage process. The stages in this process are financial due diligence, marketing, strategy, analysis, business.

Donut Pie Chart Ppt PowerPoint Presentation Infographics Ideas
This is a donut pie chart ppt powerpoint presentation infographics ideas. This is a three stage process. The stages in this process are donut pie chart, finance, marketing, strategy, analysis.

Choose Your Payroll Software Ppt PowerPoint Presentation Infographics Topics
This is a choose your payroll software ppt powerpoint presentation infographics topics. This is a four stage process. The stages in this process are business, icons, marketing, strategy, analysis.
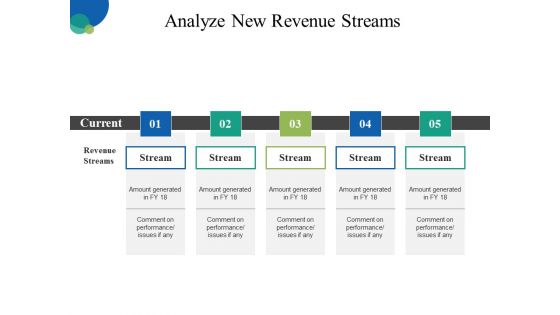
Analyze New Revenue Streams Ppt PowerPoint Presentation Infographics Background Designs
This is a analyze new revenue streams ppt powerpoint presentation infographics background designs. This is a five stage process. The stages in this process are business, management, process, strategy, analysis.

Assets And Revenue Financial Summary Ppt PowerPoint Presentation Infographics Demonstration
This is a assets and revenue financial summary ppt powerpoint presentation infographics demonstration. This is a six stage process. The stages in this process are business, finance, marketing, strategy, analysis, investment.

Column Chart Finance Ppt PowerPoint Presentation Infographics Backgrounds
This is a column chart finance ppt powerpoint presentation infographics backgrounds. This is a two stage process. The stages in this process are column chart, investment, marketing, finance, analysis.
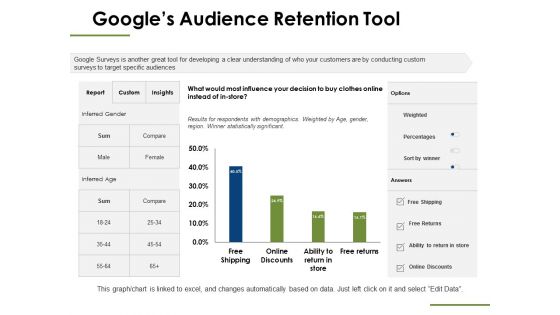
Googles Audience Retention Tool Ppt PowerPoint Presentation Infographics Summary
This is a googles audience retention tool ppt powerpoint presentation infographics summary. This is a four stage process. The stages in this process are business, finance, marketing, investment, analysis.
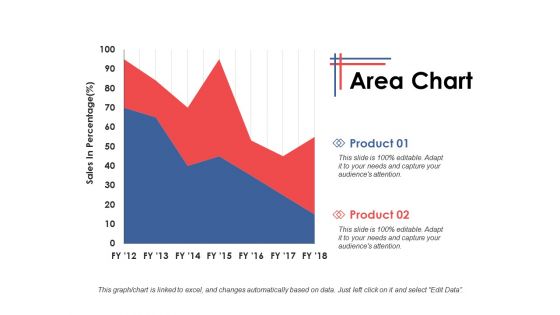
Area Chart Growth Strategy Ppt PowerPoint Presentation Infographics Themes
This is a area chart growth strategy ppt powerpoint presentation infographics themes. This is a two stage process. The stages in this process are finance, marketing, management, investment, analysis.
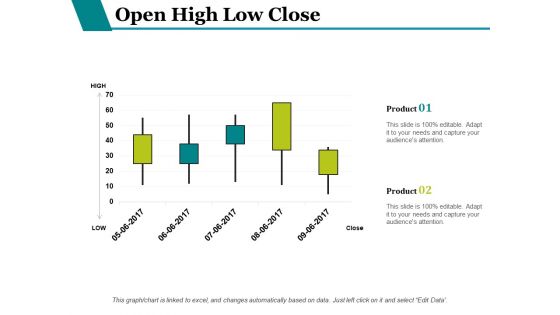
Open High Low Close Ppt PowerPoint Presentation Infographics Inspiration
This is a open high low close ppt powerpoint presentation infographics inspiration. This is a two stage process. The stages in this process are finance, analysis, investment, business, marketing.

Stacked Area Clustered Column Ppt PowerPoint Presentation Infographics Backgrounds
This is a stacked area clustered column ppt powerpoint presentation infographics backgrounds. This is a three stage process. The stages in this process are finance, marketing, management, investment, analysis.
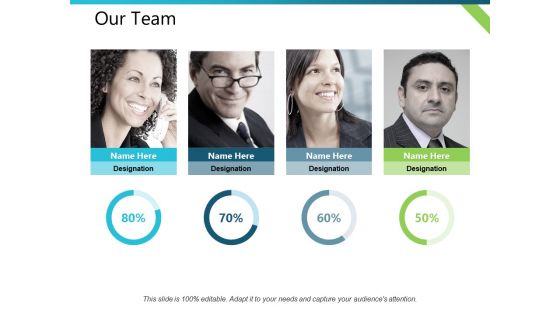
Our Team Distribution Plan Ppt PowerPoint Presentation Infographics Portrait
This is a our team distribution plan ppt powerpoint presentation infographics portrait. This is a four stage process. The stages in this process are business, management, planning, analysis, strategy.
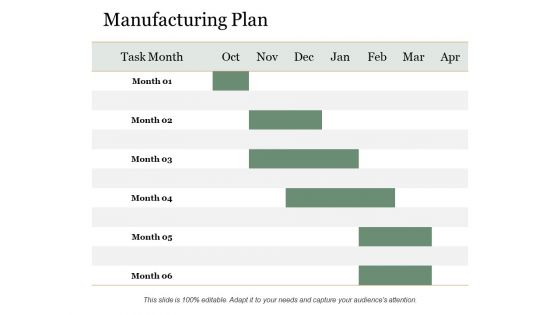
Manufacturing Plan Ppt PowerPoint Presentation Infographics Graphic Tips
This is a manufacturing plan ppt powerpoint presentation infographics graphic tips. This is a six stage process. The stages in this process are manufacturing plan, month, business, marketing, analysis.

Bar Graph Finance Ppt PowerPoint Presentation Infographics Background Designs
This is a bar graph finance ppt powerpoint presentation infographics background designs. This is a two stage process. The stages in this process are finance, analysis, business, investment, marketing.
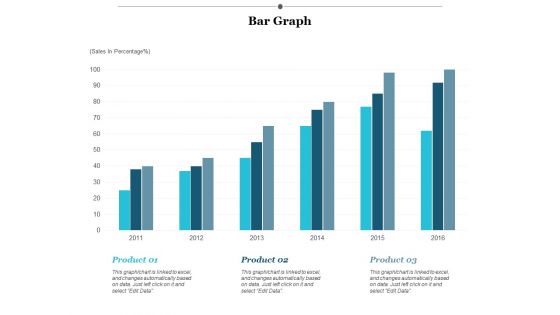
Bar Graph Finance Ppt PowerPoint Presentation Infographics Designs Download
This is a bar graph finance ppt powerpoint presentation infographics designs download. This is a three stage process. The stages in this process are finance, marketing, management, investment, analysis.

Door To Door Sales Outline Ppt PowerPoint Presentation Infographics Grid
This is a door to door sales outline ppt powerpoint presentation infographics grid. This is a two stage process. The stages in this process are competitive advantage, training evaluation, activity goals, sales evaluation, competitor analysis.
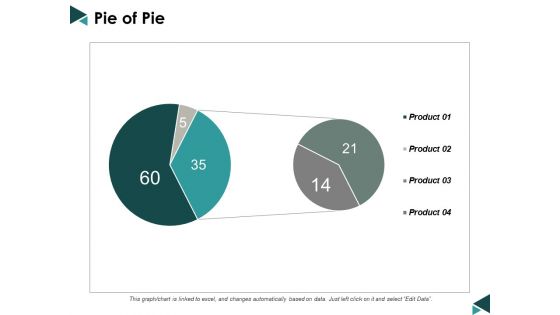
Pie Of Pie Ppt Powerpoint Presentation Infographics Layout Ideas
This is a pie of pie ppt powerpoint presentation infographics layout ideas. This is a four stage process. The stages in this process are pie chart, marketing, business, analysis, management.

Our Team Realty Management Ppt PowerPoint Presentation Infographics Templates
This is a our team realty management ppt powerpoint presentation infographics templates. This is a three stage process. The stages in this process are business, management, strategy, analysis, communication.

Operating Plan Initiatives Ppt PowerPoint Presentation Infographics Slide Download
This is a operating plan initiatives ppt powerpoint presentation infographics slide download. This is a four stage process. The stages in this process are business, management, strategy, analysis, icons.

Puzzle Yearly Operating Plan Ppt PowerPoint Presentation Infographics Visual Aids
This is a puzzle yearly operating plan ppt powerpoint presentation infographics visual aids. This is a three stage process. The stages in this process are business, management, strategy, analysis, marketing.
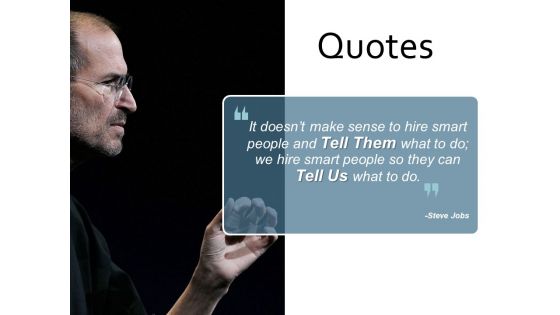
Quotes Yearly Operating Plan Ppt PowerPoint Presentation Infographics Structure
This is a quotes yearly operating plan ppt powerpoint presentation infographics structure. This is a one stage process. The stages in this process are business, management, strategy, analysis, knowledge.

Stacked Area Clustered Column Ppt PowerPoint Presentation Infographics Designs Download
This is a stacked area clustered column ppt powerpoint presentation infographics designs download. This is a three stage process. The stages in this process are business, management, strategy, analysis, marketing.

Determine Future Talent Needs Ppt PowerPoint Presentation Infographics Example Introduction
This is a determine future talent needs ppt powerpoint presentation infographics example introduction. This is a three stage process. The stages in this process are finance, analysis, business, investment, marketing.
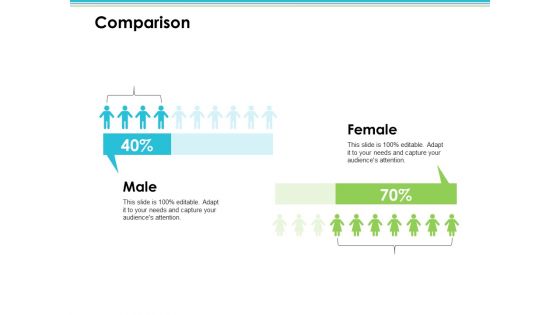
Comparison Employee Value Proposition Ppt PowerPoint Presentation Infographics Master Slide
This is a comparison employee value proposition ppt powerpoint presentation infographics master slide. This is a two stage process. The stages in this process are business, management, strategy, analysis, marketing.

Employee Compensation Employee Value Proposition Ppt PowerPoint Presentation Infographics Introduction
This is a employee compensation employee value proposition ppt powerpoint presentation infographics introduction. This is a two stage process. The stages in this process are business, management, strategy, analysis, icons.
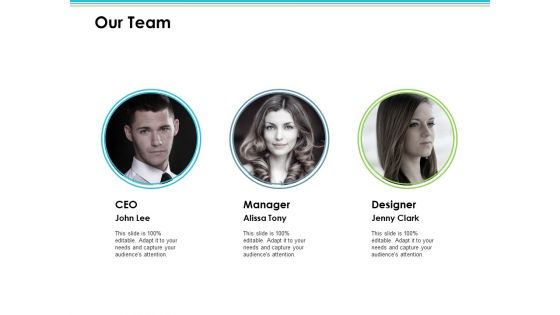
Our Team Employee Value Proposition Ppt PowerPoint Presentation Infographics Grid
This is a our team employee value proposition ppt powerpoint presentation infographics grid. This is a three stage process. The stages in this process are business, management, strategy, analysis, communication.

Work Environment Employee Value Proposition Ppt PowerPoint Presentation Infographics Brochure
This is a work environment employee value proposition ppt powerpoint presentation infographics brochure. This is a five stage process. The stages in this process are business, management, strategy, analysis, communication.

Column Chart Sample Budget Ppt Ppt PowerPoint Presentation Infographics Brochure
This is a column chart sample budget ppt ppt powerpoint presentation infographics brochure. This is a two stage process. The stages in this process are business, management, strategy, analysis, marketing.

Event Budget Sample Budget Ppt Ppt PowerPoint Presentation Infographics Smartart
This is a event budget sample budget ppt ppt powerpoint presentation infographics smartart. This is a three stage process. The stages in this process are business, management, strategy, analysis, icons.
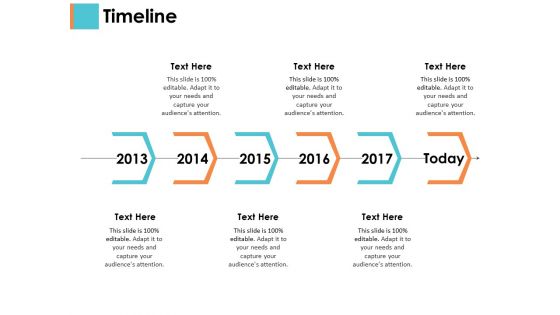
Timeline Sample Budget Ppt Ppt PowerPoint Presentation Infographics Elements
This is a timeline sample budget ppt ppt powerpoint presentation infographics elements. This is a six stage process. The stages in this process are business, management, strategy, analysis, timeline.

Data Mining And Clustering Infographics Ppt PowerPoint Presentation Portfolio Elements
This is a data mining and clustering infographics ppt powerpoint presentation portfolio elements. This is a seven stage process. The stages in this process are cluster analysis, cluster examination, cluster investigation.
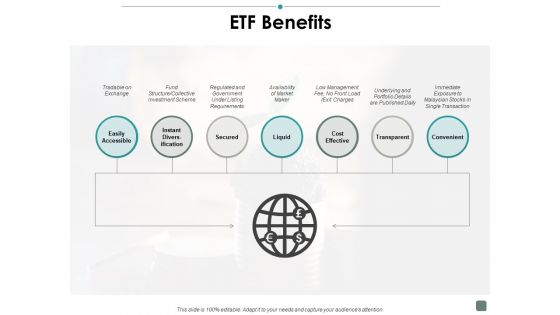
Etf Benefits Contribution Ppt PowerPoint Presentation Infographics Background Images
This is a etf benefits contribution ppt powerpoint presentation infographics background images. This is a seven stage process. The stages in this process are business, management, strategy, analysis, marketing.

Exchange Traded Funds Contribution Ppt PowerPoint Presentation Infographics Tips
This is a exchange traded funds contribution ppt powerpoint presentation infographics tips. This is a four stage process. The stages in this process are finance, business, management, strategy, analysis.

Pie Chart Finance Marketing Ppt Powerpoint Presentation Infographics Background
This is a pie chart finance marketing ppt powerpoint presentation infographics background. This is a two stage process. The stages in this process are finance, marketing, management, investment, analysis.

Staked Area Clustered Column Ppt Powerpoint Presentation Infographics Elements
This is a staked area clustered column ppt powerpoint presentation infographics elements. This is a four stage process. The stages in this process are finance, marketing, management, investment, analysis.
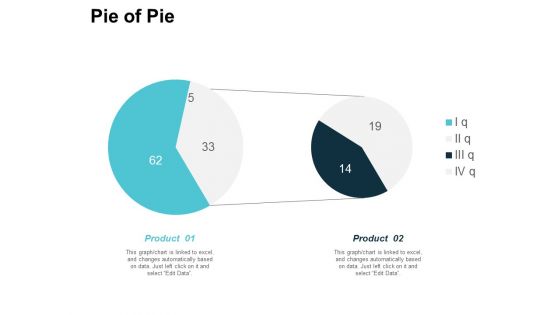
Pie Of Pie Finance Marketing Ppt Powerpoint Presentation Infographics Demonstration
This is a pie of pie finance marketing ppt powerpoint presentation infographics demonstration. This is a stage process. The stages in this process are finance, marketing, management, investment, analysis.
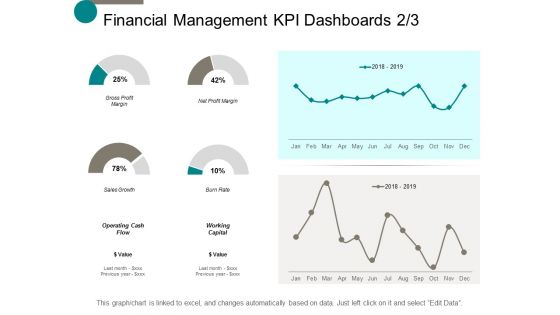
Financial Management Kpi Dashboards Marketing Ppt Powerpoint Presentation Infographics Outline
This is a financial management kpi dashboards marketing ppt powerpoint presentation infographics outline. This is a six stage process. The stages in this process are finance, marketing, management, investment, analysis.
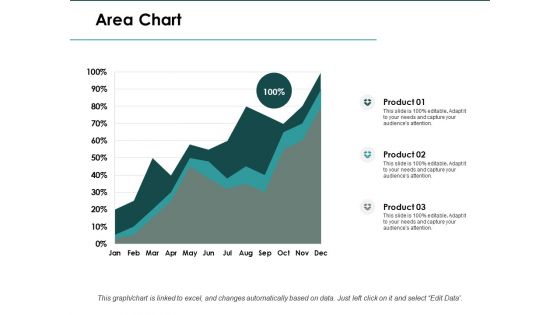
Area Chart Finance Ppt PowerPoint Presentation Infographics Slide
This is a area chart finance ppt powerpoint presentation infographics slide. This is a three stage process. The stages in this process are area chart, finance, marketing, analysis, investment.
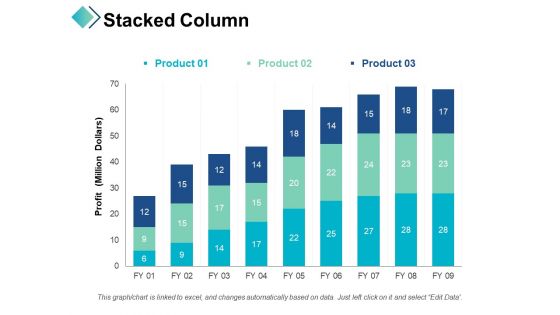
Stacked Column Profit Business Ppt PowerPoint Presentation Infographics Master Slide
This is a stacked column profit business ppt powerpoint presentation infographics master slide. This is a three stage process. The stages in this process are finance, strategy, analysis, business, marketing.

Stacked Bar Finance Management Ppt Powerpoint Presentation Infographics Graphics Design
This is a stacked bar finance management ppt powerpoint presentation infographics graphics design. This is a two stage process. The stages in this process are finance, marketing, management, investment, analysis.
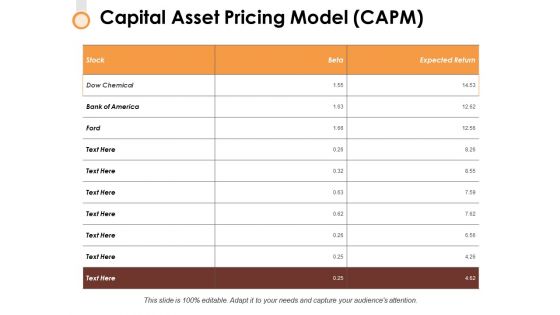
Capital Asset Pricing Model Capm Ppt PowerPoint Presentation Infographics Ideas
This is a capital asset pricing model capm ppt powerpoint presentation infographics ideas. This is a nine stage process. The stages in this process are analysis, strategy, marketing, compare, business.
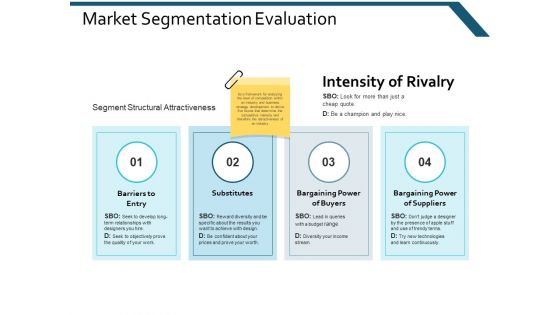
Market Segmentation Evaluation Substitutes Ppt Powerpoint Presentation Infographics Aids
This is a market segmentation evaluation substitutes ppt powerpoint presentation infographics aids. This is a two stage process. The stages in this process are finance, marketing, management, investment, analysis.
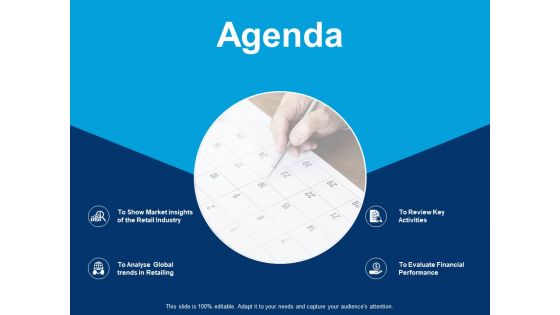
Agenda To Review Key Activities Ppt PowerPoint Presentation Infographics Themes
This is a agenda to review key activities ppt powerpoint presentation infographics themes. This is a four stage process. The stages in this process are business, management, strategy, analysis, marketing.
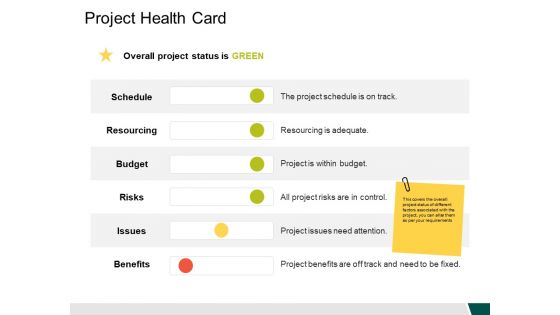
Project Health Card Resourcing Ppt PowerPoint Presentation Infographics Deck
This is a project health card resourcing ppt powerpoint presentation infographics deck. This is a six stage process. The stages in this process are business, management, strategy, analysis, marketing.

Risk Identification 2 2 Ppt PowerPoint Presentation Infographics Layouts
This is a risk identification 2 2 ppt powerpoint presentation infographics layouts. This is a three stage process. The stages in this process are business, management, strategy, analysis, marketing.

Clustered Column Line Product Financial Ppt PowerPoint Presentation Infographics Guide
This is a clustered column line product financial ppt powerpoint presentation infographics guide. This is a three stage process. The stages in this process are business, finance, strategy, analysis, marketing.

Magnifying Glass Testing Ppt PowerPoint Presentation Infographics Layout Ideas
This is a magnifying glass testing ppt powerpoint presentation infographics layout ideas. This is a five stage process. The stages in this process are technology, icons, strategy, analysis, marketing.

Retail Global Trends Comparing Online Ppt PowerPoint Presentation Infographics Guide
This is a retail global trends comparing online ppt powerpoint presentation infographics guide. This is a two stage process. The stages in this process are finance, analysis, business, investment, marketing.

Employee Weekly Efficiency Dashboard Ppt PowerPoint Presentation Infographics Microsoft
This is a employee weekly efficiency dashboard ppt powerpoint presentation infographics microsoft. This is a six stage process. The stages in this process are finance, analysis, business, investment, marketing.

 Home
Home