Survey Infographic
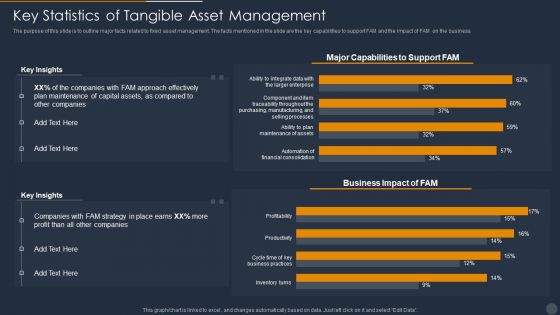
Key Statistics Of Tangible Asset Management Infographics PDF
Showcasing this set of slides titled key statistics of tangible asset management infographics pdf. The topics addressed in these templates are plan, strategy, profit. All the content presented in this PPT design is completely editable. Download it and make adjustments in color, background, font etc. as per your unique business setting.

Cybersecurity Operations Cybersecops Checklist For Secops Implementation Infographics PDF
This slide represents the checklist to implement security operations in an organization. The purpose of this slide is to demonstrate the various guidelines to keep in mind while implementing SecOps in a company, including defining the SecOps scope, building repeatable workflows, and so on. Want to ace your presentation in front of a live audience Our Cybersecurity Operations Cybersecops Checklist For Secops Implementation Infographics PDF can help you do that by engaging all the users towards you. Slidegeeks experts have put their efforts and expertise into creating these impeccable powerpoint presentations so that you can communicate your ideas clearly. Moreover, all the templates are customizable, and easy to edit and downloadable. Use these for both personal and commercial use.

Data Research And Analytics Ppt PowerPoint Presentation Infographics Examples
This is a data research and analytics ppt powerpoint presentation infographics examples. This is a one stage process. The stages in this process are metrics icon, kpis icon, statistics icon.
Performance Evaluation Checklist Vector Icon Ppt PowerPoint Presentation Infographics Gridlines
Presenting this set of slides with name performance evaluation checklist vector icon ppt powerpoint presentation infographics gridlines. This is a one stage process. The stages in this process are evaluation of option, business, checklist. This is a completely editable PowerPoint presentation and is available for immediate download. Download now and impress your audience.
Quality Control Checklist Pen Icon Ppt PowerPoint Presentation Infographics Elements
Presenting this set of slides with name quality control checklist pen icon ppt powerpoint presentation infographics elements. This is a one stage process. The stages in this process are quality, excellent quality, quality control checklist. This is a completely editable PowerPoint presentation and is available for immediate download. Download now and impress your audience.
Supplier Compliance Audit Checklist Icon Ppt Portfolio Infographics PDF
Persuade your audience using this Supplier Compliance Audit Checklist Icon Ppt Portfolio Infographics PDF. This PPT design covers three stages, thus making it a great tool to use. It also caters to a variety of topics including Supplier Compliance Audit, Checklist Icon. Download this PPT design now to present a convincing pitch that not only emphasizes the topic but also showcases your presentation skills.
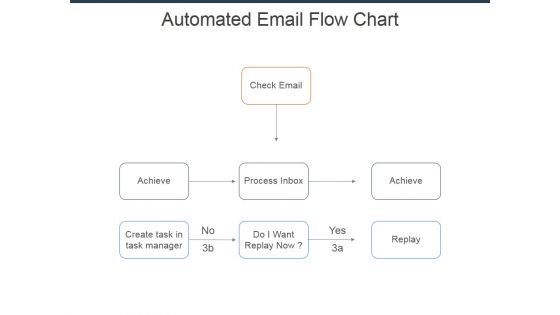
Automated Email Flow Chart Ppt Powerpoint Presentation Infographics Show
This is a automated email flow chart ppt powerpoint presentation infographics show. This is a three stage process. The stages in this process are check email, achieve, process inbox, do i want replay now, create task in task manager.
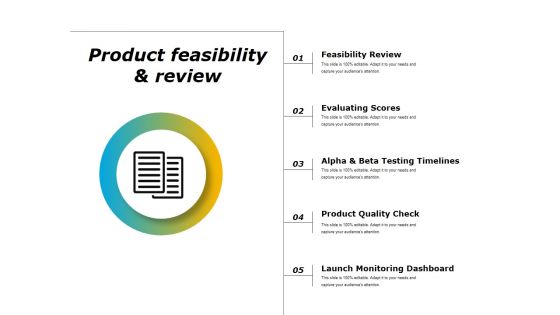
Product Feasibility And Review Ppt PowerPoint Presentation Infographics Design Inspiration
This is a product feasibility and review ppt powerpoint presentation infographics design inspiration. This is a five stage process. The stages in this process are feasibility review, evaluating scores, alpha and beta testing timelines, product quality check, launch monitoring dashboard.
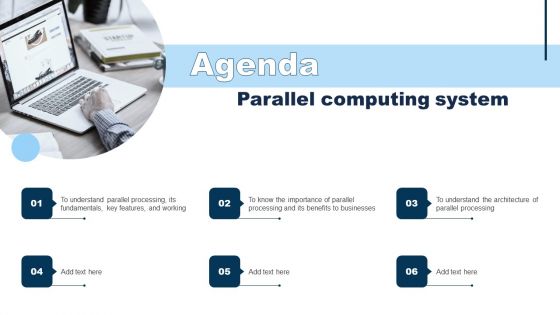
Agenda Parallel Computing System Ppt PowerPoint Presentation File Infographics PDF
Presenting this PowerPoint presentation, titled Agenda Parallel Computing System Ppt PowerPoint Presentation File Infographics PDF, with topics curated by our researchers after extensive research. This editable presentation is available for immediate download and provides attractive features when used. Download now and captivate your audience. Presenting this Agenda Parallel Computing System Ppt PowerPoint Presentation File Infographics PDF. Our researchers have carefully researched and created these slides with all aspects taken into consideration. This is a completely customizable Agenda Parallel Computing System Ppt PowerPoint Presentation File Infographics PDF that is available for immediate downloading. Download now and make an impact on your audience. Highlight the attractive features available with our PPTs.
Audit Checklist Vector Icon Ppt PowerPoint Presentation Infographics Structure
Presenting this set of slides with name audit checklist vector icon ppt powerpoint presentation infographics structure. This is a one stage process. The stages in this process are quality policy, business, management. This is a completely editable PowerPoint presentation and is available for immediate download. Download now and impress your audience.
Ecommerce And SEO Plan Checklist Content Ppt Infographics Icons PDF
Presenting this set of slides with name ecommerce and seo plan checklist content ppt infographics icons pdf. The topics discussed in these slides are lay the foundation for strong ecommerce seo, get to know your industry and target audience, conduct keyword research. This is a completely editable PowerPoint presentation and is available for immediate download. Download now and impress your audience.
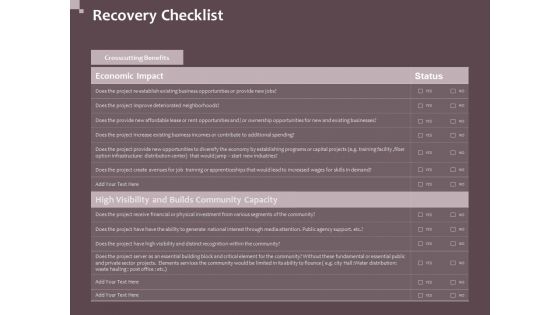
Hazard Administration Recovery Checklist Ppt Infographics Skills PDF
Presenting this set of slides with name hazard administration recovery checklist ppt infographics skills pdf. The topics discussed in these slides are economic impact, high visibility and builds community capacity. This is a completely editable PowerPoint presentation and is available for immediate download. Download now and impress your audience.
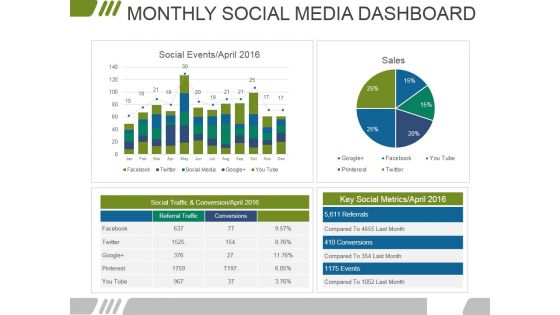
Monthly Social Media Dashboard Ppt PowerPoint Presentation Infographics Files
This is a monthly social media dashboard ppt powerpoint presentation infographics files. This is a four stage process. The stages in this process are marketing, business, financial, data analysis, management.
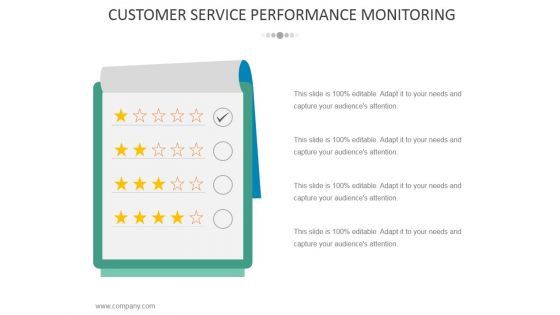
Customer Service Performance Monitoring Ppt PowerPoint Presentation Infographics Format
This is a customer service performance monitoring ppt powerpoint presentation infographics format. This is a four stage process. The stages in this process are business, strategy, marketing, analysis, finance, compare.

Organizational Issue Resolution Tool Quality Check Register Maintenance Infographics PDF
This slide provides information regarding the quality check register that is to be maintained in order to keep track of quality improvement of product. The details regarding the quality method used, reviewer, approver is reported. This is a Organizational Issue Resolution Tool Quality Check Register Maintenance Infographics PDF template with various stages. Focus and dispense information on one stage using this creative set, that comes with editable features. It contains large content boxes to add your information on topics like Product, Reviewer, Approver. You can also showcase facts, figures, and other relevant content using this PPT layout. Grab it now.
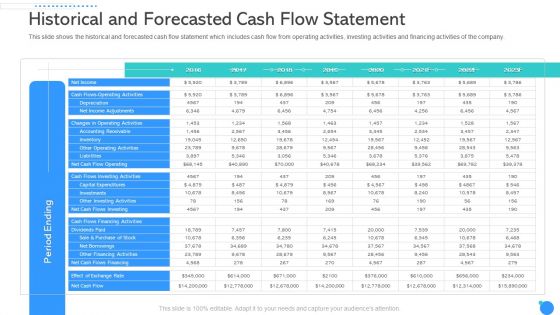
Historical And Forecasted Cash Flow Statement Ppt Infographics Information PDF
This slide shows the historical and forecasted cash flow statement which includes cash flow from operating activities, investing activities and financing activities of the company. Deliver an awe inspiring pitch with this creative historical and forecasted cash flow statement ppt infographics information pdf bundle. Topics like historical and forecasted cash flow statement can be discussed with this completely editable template. It is available for immediate download depending on the needs and requirements of the user.
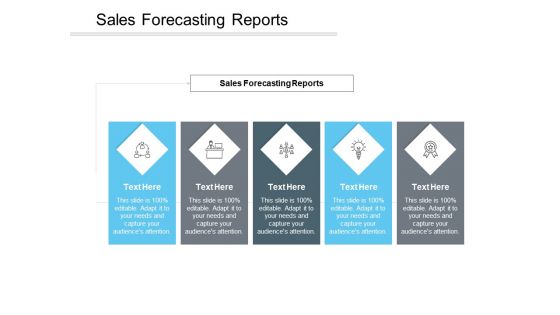
Sales Forecasting Reports Ppt PowerPoint Presentation Infographics Demonstration Cpb
Presenting this set of slides with name sales forecasting reports ppt powerpoint presentation infographics demonstration cpb. This is an editable Powerpoint five stages graphic that deals with topics like sales forecasting reports to help convey your message better graphically. This product is a premium product available for immediate download and is 100 percent editable in Powerpoint. Download this now and use it in your presentations to impress your audience.

Construction Quality Control Administration One Year Plan Infographics PDF
This slide provides report on quality control to ensure non-slippery construction. It includes Dimensional inspection, welding inspection, equipment inspection etc.Pitch your topic with ease and precision using this Construction Quality Control Administration One Year Plan Infographics PDF This layout presents information on Welding Completed, Checked Equipment, Ultrasonic Inspection It is also available for immediate download and adjustment. So, changes can be made in the color, design, graphics or any other component to create a unique layout.
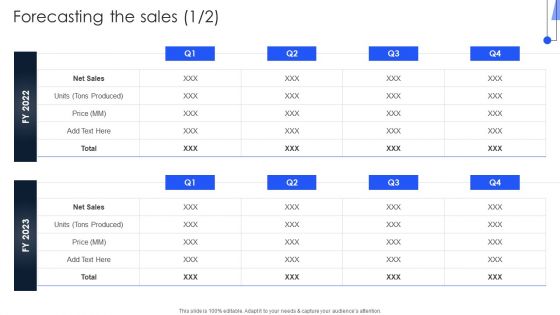
Implementing Marketing Strategies Forecasting The Sales Infographics PDF
Boost your pitch with our creative Implementing Marketing Strategies Forecasting The Sales Infographics PDF. Deliver an awe-inspiring pitch that will mesmerize everyone. Using these presentation templates you will surely catch everyones attention. You can browse the ppts collection on our website. We have researchers who are experts at creating the right content for the templates. So you dont have to invest time in any additional work. Just grab the template now and use them.
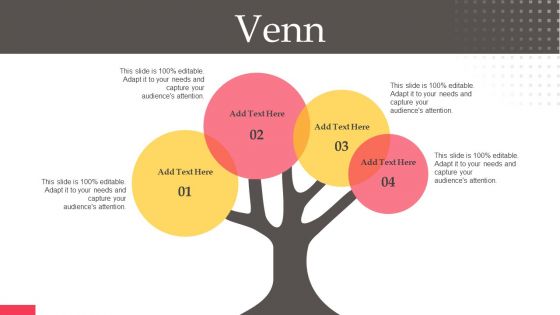
Executing Automotive Marketing Tactics For Sales Boost Venn Infographics PDF
Are you searching for a Executing Automotive Marketing Tactics For Sales Boost Venn Infographics PDF that is uncluttered, straightforward, and original Its easy to edit, and you can change the colors to suit your personal or business branding. For a presentation that expresses how much effort you have put in, this template is ideal With all of its features, including tables, diagrams, statistics, and lists, its perfect for a business plan presentation. Make your ideas more appealing with these professional slides. Download Executing Automotive Marketing Tactics For Sales Boost Venn Infographics PDF from Slidegeeks today.
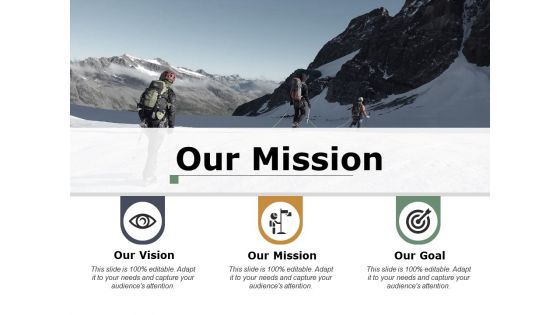
Our Mission Our Vision Ppt PowerPoint Presentation Infographics Rules
This is a our mission our vision ppt powerpoint presentation infographics rules. This is a three stage process. The stages in this process are our mission, our goal, our vision, values, management.
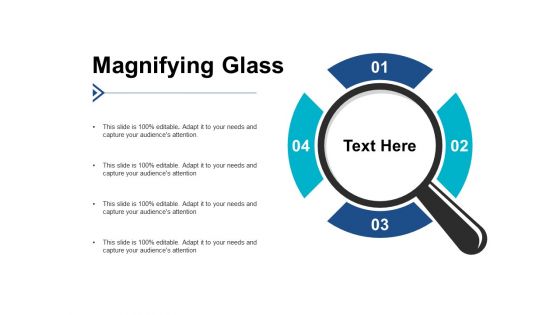
Magnifying Glass Research Ppt PowerPoint Presentation Infographics Example Introduction
This is a magnifying glass research ppt powerpoint presentation infographics example introduction. This is a four stage process. The stages in this process are magnifying glass, research, marketing, strategy, business.

Magnifying Glass Research Ppt PowerPoint Presentation Infographics Good
This is a magnifying glass research ppt powerpoint presentation infographics good. This is a four stage process. The stages in this process are magnifying glass, research, marketing, strategy, business.
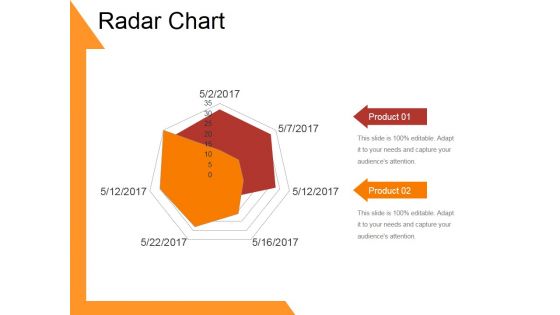
Radar Chart Template 1 Ppt PowerPoint Presentation Infographics Designs
This is a radar chart template 1 ppt powerpoint presentation infographics designs. This is a two stage process. The stages in this process are business, strategy, analysis, pretention, radar chart.
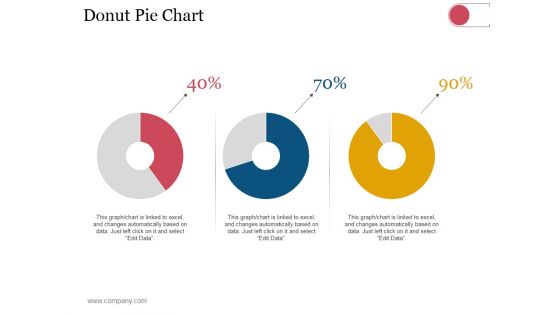
Donut Pie Chart Ppt PowerPoint Presentation Infographics Outfit
This is a donut pie chart ppt powerpoint presentation infographics outfit. This is a three stage process. The stages in this process are business, strategy, analysis, planning, dashboard, finance.
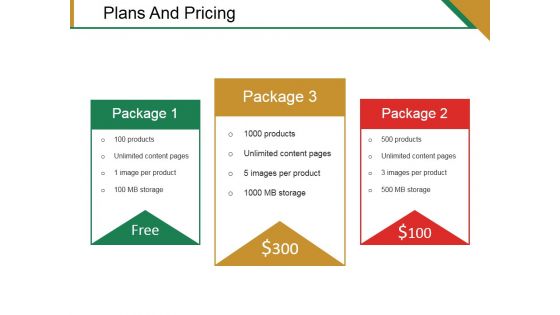
Plans And Pricing Ppt PowerPoint Presentation Infographics Guide
This is a plans and pricing ppt powerpoint presentation infographics guide. This is a three stage process. The stages in this process are business, finance, marketing, strategy, analysis, free, package.

Combo Chart Ppt PowerPoint Presentation Infographics Example Topics
This is a combo chart ppt powerpoint presentation infographics example topics. This is a eight stage process. The stages in this process are business, marketing, growth, combo chart, management.

Website Performance Review Template 2 Ppt PowerPoint Presentation Infographics Vector
This is a website performance review template 2 ppt powerpoint presentation infographics vector. This is a three stage process. The stages in this process are conversion rate, return on investment, visits, average visit value, total visits.

New Customer By Source Ppt PowerPoint Presentation Infographics Outline
This is a new customer by source ppt powerpoint presentation infographics outline. This is a seven stage process. The stages in this process are events, seo ppc, direct mail, website, email, social, advertising.
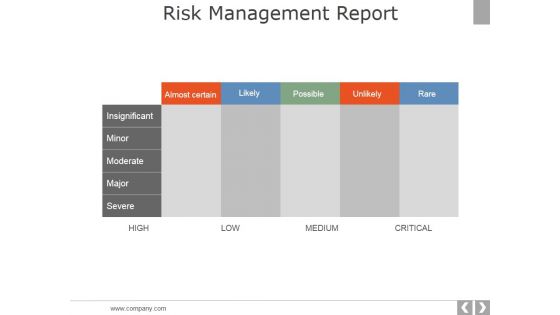
Risk Management Report Template 2 Ppt PowerPoint Presentation Infographics Brochure
This is a risk management report template 2 ppt powerpoint presentation infographics brochure. This is a five stage process. The stages in this process are insignificant, minor, moderate, major, severe.

Email Marketing Performance Ppt PowerPoint Presentation Infographics Layout Ideas
This is a email marketing performance ppt powerpoint presentation infographics layout ideas. This is a four stage process. The stages in this process are delivery rate, open rate, click rate, conversion rate.
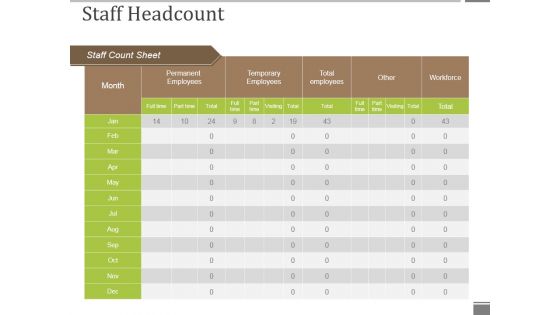
Staff Headcount Ppt PowerPoint Presentation Infographics Example Introduction
This is a staff headcount ppt powerpoint presentation infographics example introduction. This is a five stage process. The stages in this process are permanent employees, month, staff count sheet, other, total employees, temporary employees.
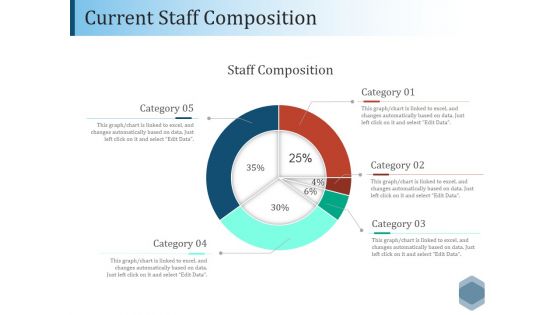
Current Staff Composition Ppt PowerPoint Presentation Infographics Design Inspiration
This is a current staff composition ppt powerpoint presentation infographics design inspiration. This is a five stage process. The stages in this process are staff composition, business, circle, process, planning.
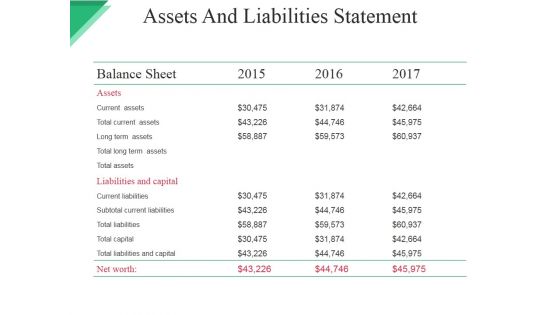
Assets And Liabilities Statement Ppt PowerPoint Presentation Infographics Shapes
This is a assets and liabilities statement ppt powerpoint presentation infographics shapes. This is a three stage process. The stages in this process are balance sheet, current assets, total current assets, long term assets, total long term assets.

Comparison Based On Criteria Ppt PowerPoint Presentation Infographics Graphics Download
This is a comparison based on criteria ppt powerpoint presentation infographics graphics download. This is a six stage process. The stages in this process are high value, low value, low trust, high trust.

Market Competitiveness Template 1 Ppt PowerPoint Presentation Infographics Vector
This is a market competitiveness template 1 ppt powerpoint presentation infographics vector. This is a three stage process. The stages in this process are key success factors, weight, rating, weighted score.
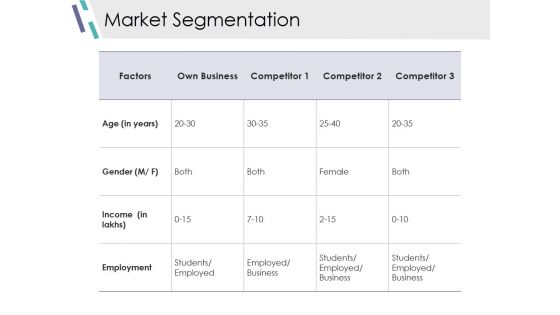
Market Segmentation Ppt PowerPoint Presentation Infographics Background Image
This is a market segmentation ppt powerpoint presentation infographics background image. This is a four stage process. The stages in this process are factors, own business, age, gender, employment.
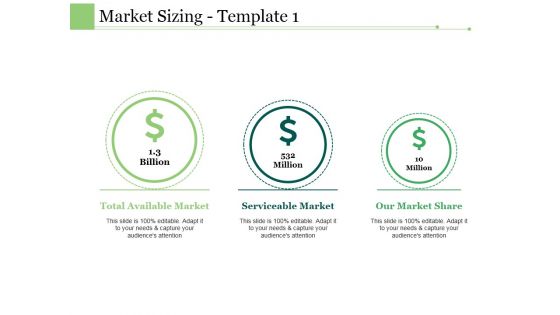
Market Sizing Template 1 Ppt PowerPoint Presentation Infographics Diagrams
This is a market sizing template 1 ppt powerpoint presentation infographics diagrams. This is a three stage process. The stages in this process are total available market, serviceable market, our market share.

Table Of Contents Ppt PowerPoint Presentation Infographics Mockup
This is a table of contents ppt powerpoint presentation infographics mockup. This is a two stage process. The stages in this process are executive summary, key highlights, organizational structure, milestones achieved, the problem.
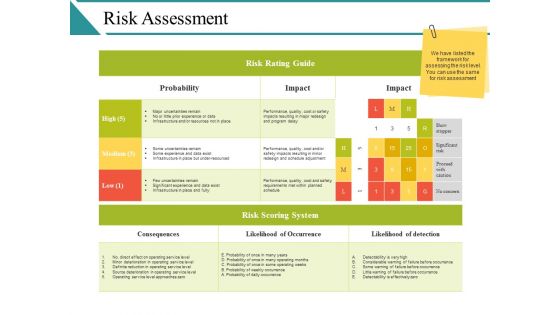
Risk Assessment Ppt PowerPoint Presentation Infographics Background Image
This is a risk assessment ppt powerpoint presentation infographics background image. This is a five stage process. The stages in this process are extreme risk, high risk, moderate risk, low risk, risk scoring results.
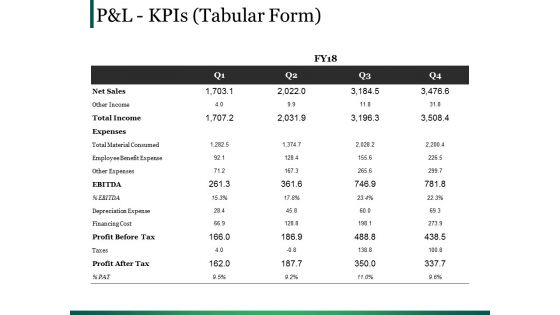
Pandl Kpis Template 1 Ppt PowerPoint Presentation Infographics Tips
This is a pandl kpis template 1 ppt powerpoint presentation infographics tips. This is a four stage process. The stages in this process are ebitda, total income, table, cost, management.

Project Status Report Template Ppt PowerPoint Presentation Infographics Ideas
This is a project status report template ppt powerpoint presentation infographics ideas. This is a five stage process. The stages in this process are cost, planning, table, project report, data management.

Project Status Report Ppt PowerPoint Presentation Infographics Designs Download
This is a project status report ppt powerpoint presentation infographics designs download. This is a four stage process. The stages in this process are cost, planning, table, project report, data management.

Effective Teamwork In Workplace Ppt PowerPoint Presentation Infographics Show
This is a effective teamwork in workplace ppt powerpoint presentation infographics show. This is a three stage process. The stages in this process are business goals, business objectives, business priorities.

Project Cost Calculation And Estimation Ppt PowerPoint Presentation Infographics Structure
This is a project cost calculation and estimation ppt powerpoint presentation infographics structure. This is a one stage process. The stages in this process are cost control, money control, price control.
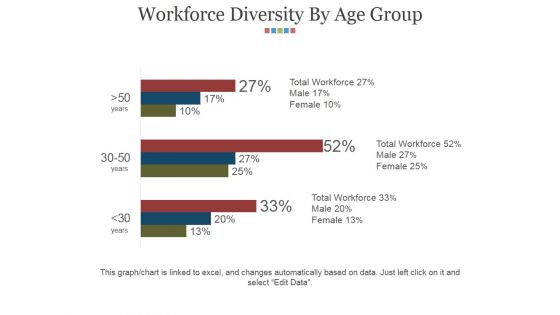
Workforce Diversity By Age Group Ppt PowerPoint Presentation Infographics Slides
This is a workforce diversity by age group ppt powerpoint presentation infographics slides. This is a three stage process. The stages in this process are finance, analysis, success, strategy, business, marketing.

Workforce Diversity By Region Ppt PowerPoint Presentation Infographics Grid
This is a workforce diversity by region ppt powerpoint presentation infographics grid. This is a four stage process. The stages in this process are finance, analysis, success, strategy, business, marketing.
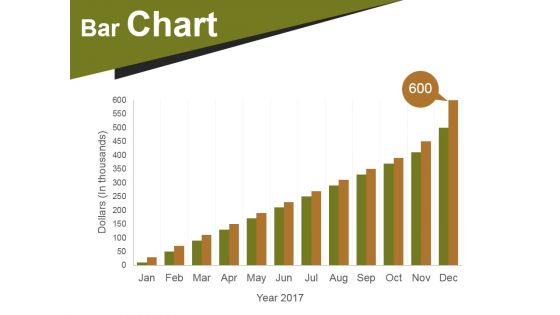
Bar Chart Ppt PowerPoint Presentation Infographics Designs Download
This is a bar chart ppt powerpoint presentation infographics designs download. This is a twelve stage process. The stages in this process are bar chart, business, marketing, strategy, success.

Crm Dashboard Top Customers Ppt PowerPoint Presentation Infographics Format
This is a crm dashboard top customers ppt powerpoint presentation infographics format. This is a ten stage process. The stages in this process are top customers, people, management, business, marketing.

Profitability Ratios Template 2 Ppt PowerPoint Presentation Infographics Layouts
This is a profitability ratios template 2 ppt powerpoint presentation infographics layouts. This is a two stage process. The stages in this process are price to earning ratio, earning per share, market value price per share.
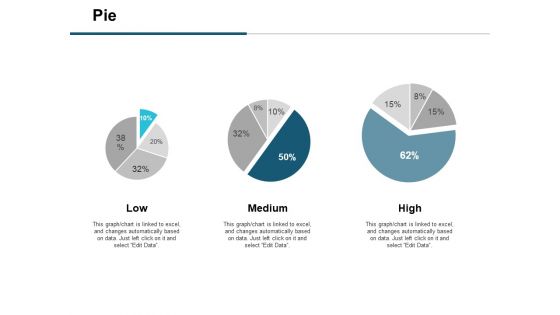
Pie Financial Ppt PowerPoint Presentation Infographics Master Slide
This is a pie financial ppt powerpoint presentation infographics master slide. This is a three stage process. The stages in this process are business strategy, marketing, management, percentage, pie, financial.
Bulb Or Idea Ppt PowerPoint Presentation Infographics Model
This is a bulb or idea ppt powerpoint presentation infographics model. This is a one stage process. The stages in this process are business, strategy, marketing, analysis, technology, light bulb.
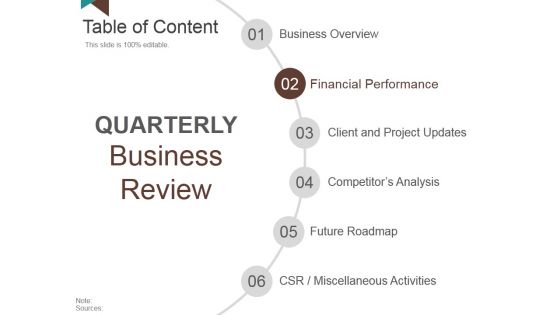
Table Of Content Template 2 Ppt PowerPoint Presentation Infographics Professional
This is a table of content template 2 ppt powerpoint presentation infographics professional. This is a six stage process. The stages in this process are financial performance, client and project updates, competitors analysis, future roadmap, csr miscellaneous activities.
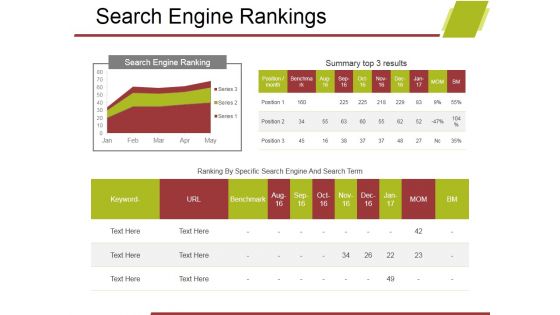
Search Engine Rankings Ppt PowerPoint Presentation Infographics Samples
This is a search engine rankings ppt powerpoint presentation infographics samples. This is a two stage process. The stages in this process are business, management, analysis, strategy, search engine rankings.
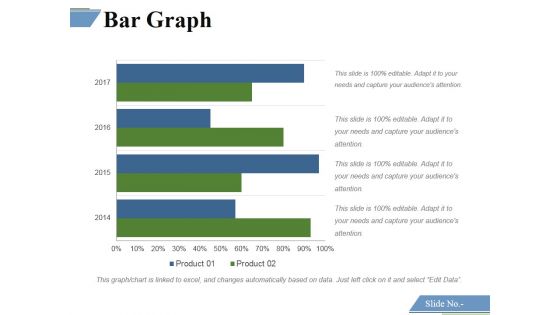
Bar Graph Ppt PowerPoint Presentation Infographics Slide Download
This is a bar graph ppt powerpoint presentation infographics slide download. This is a four stage process. The stages in this process are bar graph, finance, marketing, strategy, analysis.
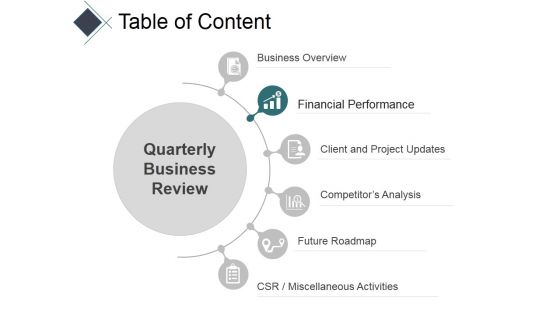
Table Of Content Template 1 Ppt PowerPoint Presentation Infographics Display
This is a table of content template 1 ppt powerpoint presentation infographics display. This is a six stage process. The stages in this process are business overview, financial performance, client and project updates, competitors analysis, future roadmap.
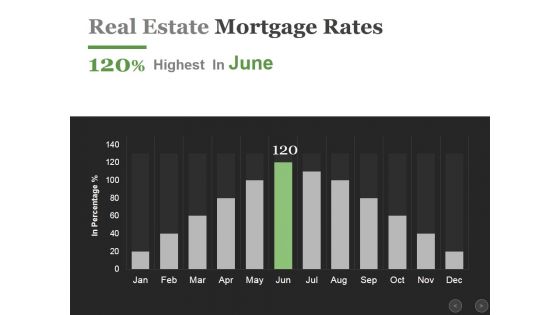
Real Estate Mortgage Rates Ppt PowerPoint Presentation Infographics Influencers
This is a real estate mortgage rates ppt powerpoint presentation infographics influencers. This is a twelve stage process. The stages in this process are business, finance, marketing, analysis, growth.

Staked Line With Markers Ppt PowerPoint Presentation Infographics Show
This is a staked line with markers ppt powerpoint presentation infographics show. This is a one stage process. The stages in this process are business, marketing, finance, line, analysis.

Filled Area Ppt PowerPoint Presentation Infographics Graphics Design
This is a filled area ppt powerpoint presentation infographics graphics design. This is a two stage process. The stages in this process are filled area, finance, marketing, strategy, analysis.

Financial Projections Panel Template 2 Ppt PowerPoint Presentation Infographics Inspiration
This is a financial projections panel template 2 ppt powerpoint presentation infographics inspiration. This is a one stage process. The stages in this process are analysis, finance, business, marketing, strategy.

 Home
Home