Survey Infographic

Pharmaceutical Company SWOT Analysis Weaknesses Infographics PDF
This slide shows the various Weakness related to pharmaceutical company such as less investment in research and development, low brand image, more cash flow problems and many more.This is a pharmaceutical company swot analysis weaknesses infographics pdf template with various stages. Focus and dispense information on four stages using this creative set, that comes with editable features. It contains large content boxes to add your information on topics like research and development, cash flow problems, brand image You can also showcase facts, figures, and other relevant content using this PPT layout. Grab it now.
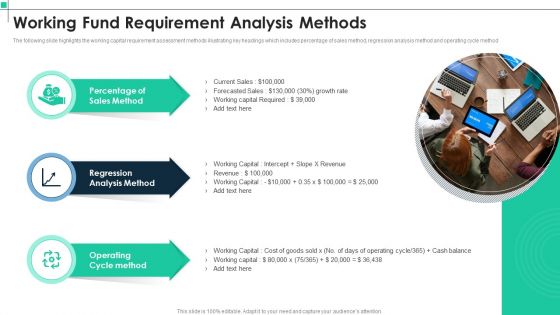
Working Fund Requirement Analysis Methods Infographics PDF
The following slide highlights the working capital requirement assessment methods illustrating key headings which includes percentage of sales method, regression analysis method and operating cycle method. Persuade your audience using this Working Fund Requirement Analysis Methods Infographics PDF. This PPT design covers three stages, thus making it a great tool to use. It also caters to a variety of topics including Sales Method, Regression Analysis Method, Operating Cycle Method. Download this PPT design now to present a convincing pitch that not only emphasizes the topic but also showcases your presentation skills.
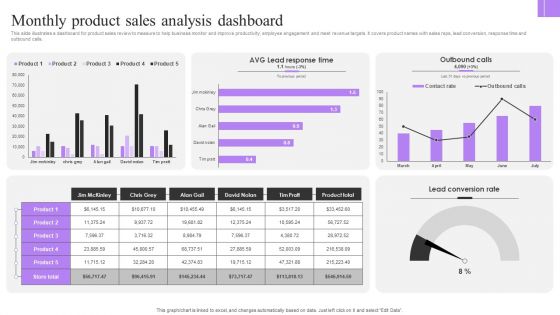
Monthly Product Sales Analysis Dashboard Infographics PDF
This slide illustrates a dashboard for product sales review to measure to help business monitor and improve productivity, employee engagement and meet revenue targets. It covers product names with sales reps, lead conversion, response time and outbound calls. Showcasing this set of slides titled Monthly Product Sales Analysis Dashboard Infographics PDF. The topics addressed in these templates are Lead Conversion Rate, Outbound Calls, Sales Analysis Dashboard. All the content presented in this PPT design is completely editable. Download it and make adjustments in color, background, font etc. as per your unique business setting.
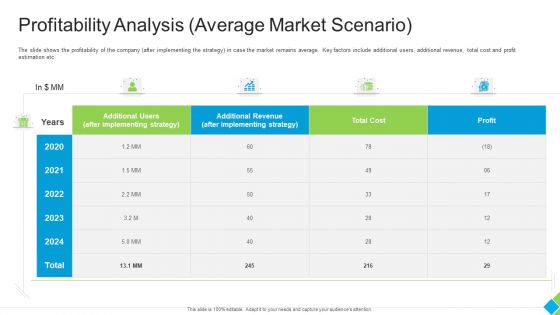
Profitability Analysis Average Market Scenario Infographics PDF
The slide shows the profitability of the company after implementing the strategy in case the market remains average. Key factors include additional users, additional revenue, total cost and profit estimation etc. Deliver an awe inspiring pitch with this creative profitability analysis average market scenario infographics pdf bundle. Topics like additional users after implementing strategy, additional revenue after implementing strategy, total cost, profit can be discussed with this completely editable template. It is available for immediate download depending on the needs and requirements of the user.
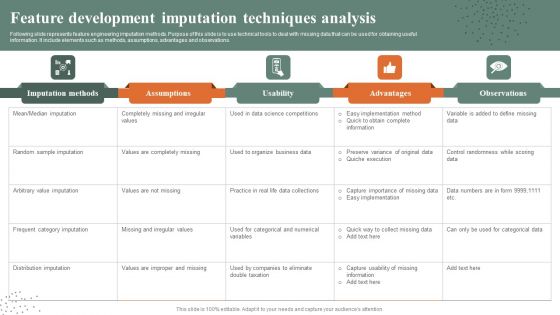
Feature Development Imputation Techniques Analysis Infographics PDF
Following slide represents feature engineering imputation methods. Purpose of this slide is to use technical tools to deal with missing data that can be used for obtaining useful information. It include elements such as methods, assumptions, advantages and observations. Pitch your topic with ease and precision using this Feature Development Imputation Techniques Analysis Infographics PDF. This layout presents information on Imputation Methods, Assumptions, Usability . It is also available for immediate download and adjustment. So, changes can be made in the color, design, graphics or any other component to create a unique layout.
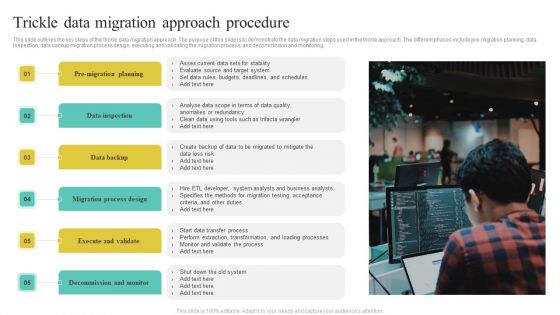
Trickle Data Migration Approach Procedure Infographics PDF
This slide outlines the key steps of the trickle data migration approach. The purpose of this slide is to demonstrate the data migration steps used in the trickle approach. The different phases include pre-migration planning, data inspection, data backup migration process design, executing and validating the migration process, and decommission and monitoring.Presenting Trickle Data Migration Approach Procedure Infographics PDF to dispense important information. This template comprises Five stages. It also presents valuable insights into the topics including Data Inspection, Data Backup, Execute And Validate . This is a completely customizable PowerPoint theme that can be put to use immediately. So, download it and address the topic impactfully.
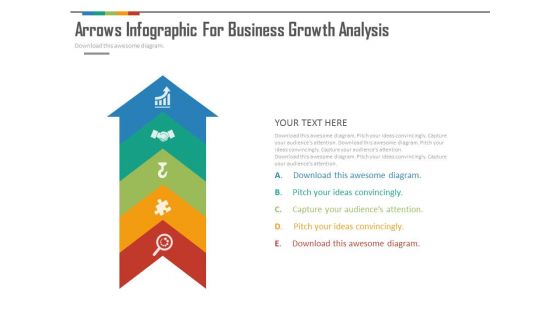
Arrow Infographics For Strategic Analysis Powerpoint Slides
This PowerPoint template contains design of arrow infographic. Download this diagram slide to depict strategic analysis. Use this PPT slide to make impressive presentations.
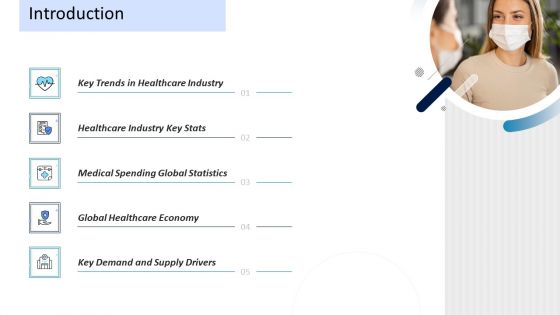
Pharmaceutical Management Introduction Ppt Styles Infographics PDF
This is a pharmaceutical management introduction ppt styles infographics pdf template with various stages. Focus and dispense information on five stages using this creative set, that comes with editable features. It contains large content boxes to add your information on topics like key trends healthcare industry, healthcare industry key stats, medical spending global statistics, global healthcare economy, key demand and supply drivers. You can also showcase facts, figures, and other relevant content using this PPT layout. Grab it now.

Pharmaceutical QC And Assurance Functions Infographics PDF
This slide illustrates functions of quality assurance and control in pharmaceutical industry. It includes functions such as critical manufacturing process checks, process monitoring, etc. Presenting Pharmaceutical QC And Assurance Functions Infographics PDF to dispense important information. This template comprises five stages. It also presents valuable insights into the topics including Process Monitoring, Batch Record Review, Stability Testing. This is a completely customizable PowerPoint theme that can be put to use immediately. So, download it and address the topic impactfully.
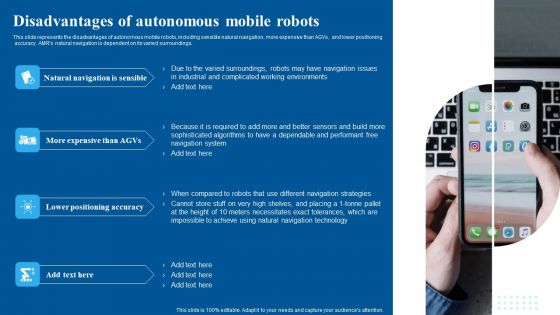
Disadvantages Of Autonomous Mobile Robots Infographics PDF
This slide represents the disadvantages of autonomous mobile robots, including sensible natural navigation, more expensive than AGVs, and lower positioning accuracy. AMRs natural navigation is dependent on its varied surroundings. Do you have an important presentation coming up Are you looking for something that will make your presentation stand out from the rest Look no further than Disadvantages Of Autonomous Mobile Robots Infographics PDF. With our professional designs, you can trust that your presentation will pop and make delivering it a smooth process. And with Slidegeeks, you can trust that your presentation will be unique and memorable. So why wait Grab Disadvantages Of Autonomous Mobile Robots Infographics PDF today and make your presentation stand out from the rest.

Strategic SEM Campaign Launch Flowchart Infographics PDF
The following slide depicts the campaign launch flowchart to streamline actions and achieve desired results. It includes elements such as analyzing and defining, developing target audience, defining strategies, advertisement creatives, improving landing page etc. Here you can discover an assortment of the finest PowerPoint and Google Slides templates. With these templates, you can create presentations for a variety of purposes while simultaneously providing your audience with an eye-catching visual experience. Download Strategic SEM Campaign Launch Flowchart Infographics PDF to deliver an impeccable presentation. These templates will make your job of preparing presentations much quicker, yet still, maintain a high level of quality. Slidegeeks has experienced researchers who prepare these templates and write high-quality content for you. Later on, you can personalize the content by editing the Strategic SEM Campaign Launch Flowchart Infographics PDF.

Stakeholders Engagement Strategy And Plan Infographics PDF
This slide covers the Stakeholders Engagement Plan which outlines the approach to be adopted and implemented for project engagement. Presenting stakeholders engagement strategy and plan infographics pdf to provide visual cues and insights. Share and navigate important information on one stage that need your due attention. This template can be used to pitch topics like compliance, objectives, identify, engage, relationship. In addition, this PPT design contains high-resolution images, graphics, etc, that are easily editable and available for immediate download.
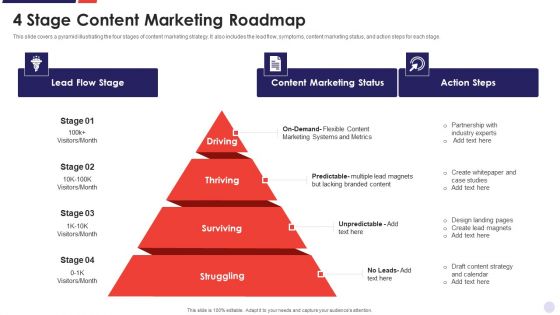
4 Stage Content Marketing Roadmap Infographics PDF
This slide covers a pyramid illustrating the four stages of content marketing strategy. It also includes the lead flow, symptoms, content marketing status, and action steps for each stage. Presenting 4 Stage Content Marketing Roadmap Infographics PDF to dispense important information. This template comprises four stages. It also presents valuable insights into the topics including Driving, Thriving, Surviving. This is a completely customizable PowerPoint theme that can be put to use immediately. So, download it and address the topic impactfully.

Challenges Faced During Technology Implementation Infographics PDF
This slide shows three challenges faced by an organization in technology implementation. It includes training, security and monitoring. Presenting Challenges Faced During Technology Implementation Infographics PDF to dispense important information. This template comprises three stages. It also presents valuable insights into the topics including Training, Security, Monitoring. This is a completely customizable PowerPoint theme that can be put to use immediately. So, download it and address the topic impactfully.
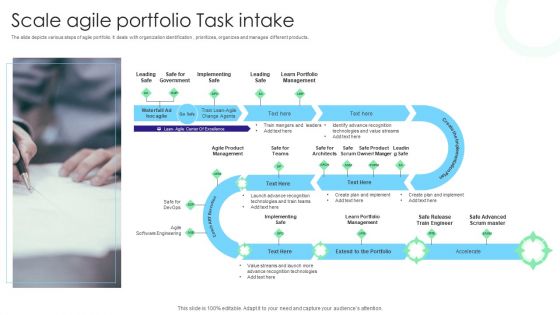
Scale Agile Portfolio Task Intake Infographics PDF
The slide depicts various steps of agile portfolio. It deals with organization identification, prioritizes, organizes and manages different products. Persuade your audience using this Scale Agile Portfolio Task Intake Infographics PDF. This PPT design covers one stages, thus making it a great tool to use. It also caters to a variety of topics including Leading Safe, Implementing Safe, Learn Portfolio Management. Download this PPT design now to present a convincing pitch that not only emphasizes the topic but also showcases your presentation skills.

Global Green Technology Adoption Index Infographics PDF
The slide showcases statistics highlighting adoption of greens technology by companies in sustainability market to identify growth rate. It includes elements like on and off premises cloud, costs saving, getting things done faster, better allocation of resources, priorities of business with speed and employee satisfaction, etc. Explore a selection of the finest Global Green Technology Adoption Index Infographics PDF here. With a plethora of professionally designed and pre made slide templates, you can quickly and easily find the right one for your upcoming presentation. You can use our Global Green Technology Adoption Index Infographics PDF to effectively convey your message to a wider audience. Slidegeeks has done a lot of research before preparing these presentation templates. The content can be personalized and the slides are highly editable. Grab templates today from Slidegeeks.

Integrated System Software Designing Process Infographics PDF
This slide presents software services design process for embedded systems, helpful in segmenting each stage into separate task. It includes planning, analysis, designing, implementation, testing, integration and maintenance. Presenting Integrated System Software Designing Process Infographics PDF to dispense important information. This template comprises six stages. It also presents valuable insights into the topics including Planning, Analysis, Design, Implementation. This is a completely customizable PowerPoint theme that can be put to use immediately. So, download it and address the topic impactfully.
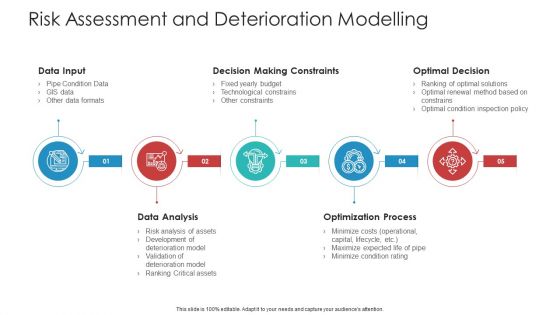
Risk Assessment And Deterioration Modelling Infographics PDF
This is a risk assessment and deterioration modelling infographics pdf template with various stages. Focus and dispense information on five stages using this creative set, that comes with editable features. It contains large content boxes to add your information on topics like data input, data analysis, optimization process, decision making constraints, optimal decision. You can also showcase facts, figures, and other relevant content using this PPT layout. Grab it now.
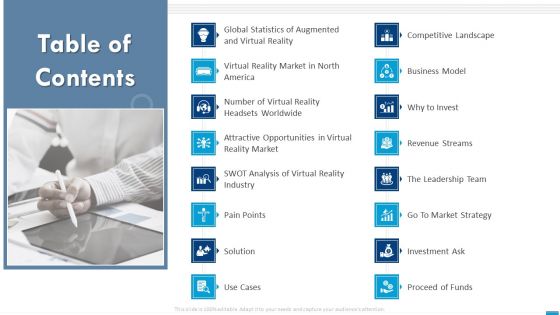
VR Startup Table Of Contents Infographics PDF
This is a vr startup table of contents infographics pdf template with various stages. Focus and dispense information on one stages using this creative set, that comes with editable features. It contains large content boxes to add your information on topics like global, opportunities, reality market, analysis, industry. You can also showcase facts, figures, and other relevant content using this PPT layout. Grab it now.
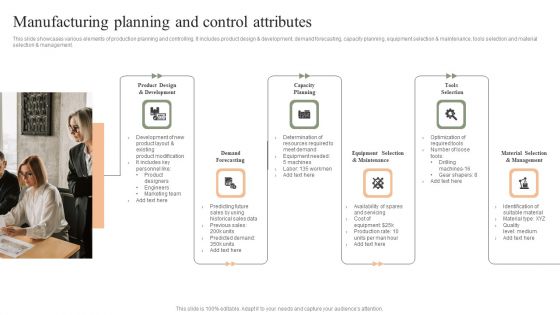
Manufacturing Planning And Control Attributes Infographics PDF
This slide showcases various elements of production planning and controlling. It includes product design and development, demand forecasting, capacity planning, equipment selection and maintenance, tools selection and material selection and management. Presenting Manufacturing Planning And Control Attributes Infographics PDF to dispense important information. This template comprises Six stage. It also presents valuable insights into the topics including Product Design Development, Demand Forecasting, Capacity Planning. This is a completely customizable PowerPoint theme that can be put to use immediately. So, download it and address the topic impactfully.

Sales Budget Deficit Assessment Sheet Infographics PDF
The following slide illustrates the process to evaluate budget variances to review actual VS projected cost. It includes elements such as collect data, assess gap, compile management report, adjusts forecast etc. Pitch your topic with ease and precision using this Sales Budget Deficit Assessment Sheet Infographics PDF. This layout presents information on Collect Data, Assess Gap, Adjusts Forecast. It is also available for immediate download and adjustment. So, changes can be made in the color, design, graphics or any other component to create a unique layout.

Dynamic Malware Assessment Flow Chart Infographics PDF
This slide illustrates malware analysis flowchart which companies employ to learn from past attack and create more secure infrastructure for future. The elements covered in this slide are live operating system, volatile memory forensics and slide channel analysis. Showcasing this set of slides titled Dynamic Malware Assessment Flow Chart Infographics PDF. The topics addressed in these templates are Live Operating System, Volatile Memory Forensics, Slide Channel Analysis. All the content presented in this PPT design is completely editable. Download it and make adjustments in color, background, font etc. as per your unique business setting.
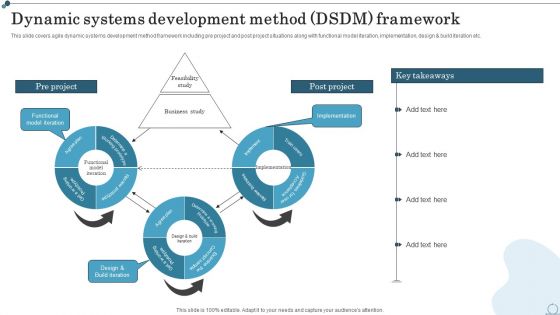
Dynamic Systems Development Method Dsdmframework Infographics PDF
This slide covers agile dynamic systems development method framework including pre project and post project situations along with functional model iteration, implementation, design and build iteration etc. Make sure to capture your audiences attention in your business displays with our gratis customizable Dynamic Systems Development Method Dsdmframework Infographics PDF. These are great for business strategies, office conferences, capital raising or task suggestions. If you desire to acquire more customers for your tech business and ensure they stay satisfied, create your own sales presentation with these plain slides.
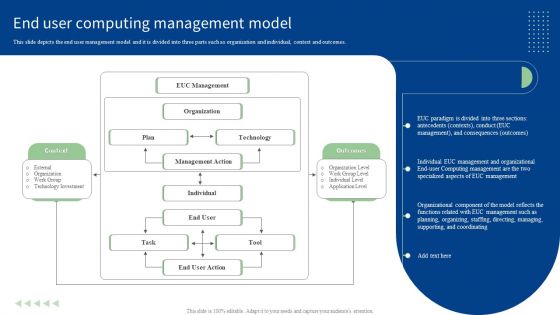
End User Computing Management Model Infographics PDF
This slide depicts the end user management model and it is divided into three parts such as organization and individual, context and outcomes. Do you know about Slidesgeeks End User Computing Management Model Infographics PDF These are perfect for delivering any kind od presentation. Using it, create PowerPoint presentations that communicate your ideas and engage audiences. Save time and effort by using our pre-designed presentation templates that are perfect for a wide range of topic. Our vast selection of designs covers a range of styles, from creative to business, and are all highly customizable and easy to edit. Download as a PowerPoint template or use them as Google Slides themes.

ERD Diagram For E Commerce Infographics PDF
Below mentioned slide illustrates ecommerce database entity relationship diagram which the businesses can use to make data flow more efficient. It also provides systematized overview of various entities like customer, company, shipping, shopping cart etc. Showcasing this set of slides titled ERD Diagram For E Commerce Infographics PDF. The topics addressed in these templates are Shipping, Customer, Company, Entity, Shopping Chart, Credit Card, Relationship. All the content presented in this PPT design is completely editable. Download it and make adjustments in color, background, font etc. as per your unique business setting.

Customer Relationship Management Value Stream Infographics PDF
The CRM value stream comprise of value proposition, solutions, targeted customer segments, KPIs, channels, customer relationships, etc. Want to ace your presentation in front of a live audience Our Customer Relationship Management Value Stream Infographics PDF can help you do that by engaging all the users towards you.. Slidegeeks experts have put their efforts and expertise into creating these impeccable powerpoint presentations so that you can communicate your ideas clearly. Moreover, all the templates are customizable, and easy-to-edit and downloadable. Use these for both personal and commercial use.
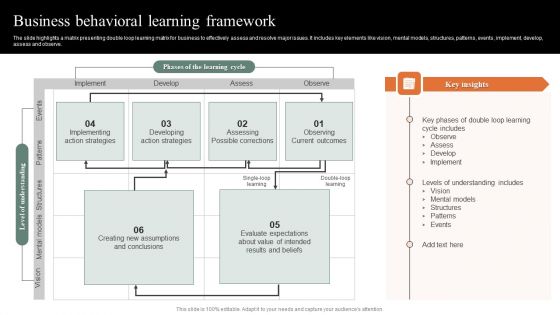
Business Behavioral Learning Framework Infographics PDF

Supply Chain Optimization Strategy Waterfall Infographics PDF
The slide showcases a strategy cascade from the viewpoint of a business whose declared goal, mission, and strategy are connected to making its products accessible to a large market and reasonably priced. It covers aspects such as strategy, tactics, operations and S and OP. Showcasing this set of slides titled Supply Chain Optimization Strategy Waterfall Infographics PDF. The topics addressed in these templates are Strategy, Tactics, Operations. All the content presented in this PPT design is completely editable. Download it and make adjustments in color, background, font etc. as per your unique business setting.
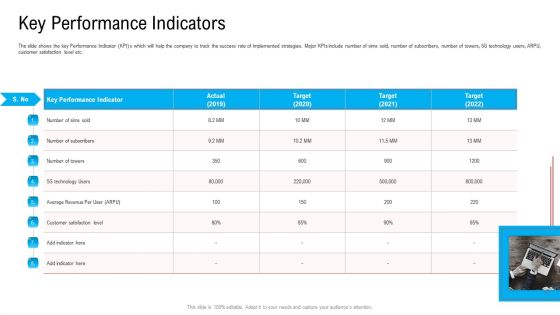
Key Performance Indicators Ppt Infographics Mockup PDF
The slide shows the key Performance Indicator KPI s which will help the company to track the success rate of implemented strategies. Major KPIs include number of sims sold, number of subscribers, number of towers, 5G technology users, ARPU, customer satisfaction level etc. This is a key performance indicators ppt infographics mockup pdf template with various stages. Focus and dispense information on one stage using this creative set, that comes with editable features. It contains large content boxes to add your information on topics like key performance indicator, technology, customer satisfaction level, target, 2019 to 2022. You can also showcase facts, figures, and other relevant content using this PPT layout. Grab it now.
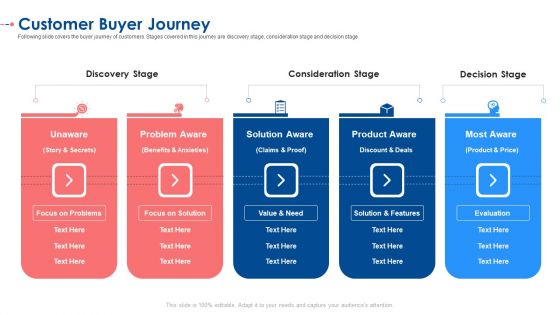
Customer Buyer Journey Ppt Infographics Mockup PDF
Following slide covers the buyer journey of customers. Stages covered in this journey are discovery stage, consideration stage and decision stage. This is a customer buyer journey ppt infographics mockup pdf. template with various stages. Focus and dispense information on five stages using this creative set, that comes with editable features. It contains large content boxes to add your information on topics like unaware, problem aware, solution aware, product aware, most aware . You can also showcase facts, figures, and other relevant content using this PPT layout. Grab it now.
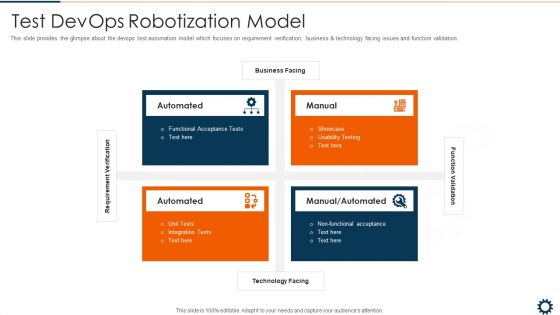
Test Devops Robotization Model Infographics PDF
This slide provides the glimpse about the devops test automation model which focuses on requirement verification, business and technology facing issues and function validation. This is a test devops robotization model infographics pdf template with various stages. Focus and dispense information on four stages using this creative set, that comes with editable features. It contains large content boxes to add your information on topics like functional, usability, acceptance, non-functional, integration. You can also showcase facts, figures, and other relevant content using this PPT layout. Grab it now.
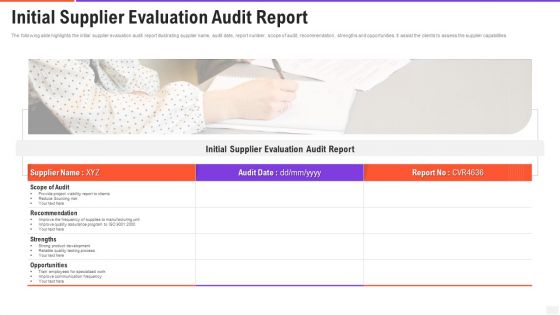
Initial Supplier Evaluation Audit Report Infographics PDF
The following slide highlights the initial supplier evaluation audit report illustrating supplier name, audit date, report number, scope of audit, recommendation, strengths and opportunities. It assist the clients to assess the supplier capabilities. Presenting initial supplier evaluation audit report infographics pdf to dispense important information. This template comprises one stages. It also presents valuable insights into the topics including scope of audit, recommendation, opportunities. This is a completely customizable PowerPoint theme that can be put to use immediately. So, download it and address the topic impactfully.

Cyberbacker Company Summary Company Values Infographics PDF
The following slide highlights the core values of Cyberbacker company to describe the work culture inside the organization. The principle values included are relationship, growth, fun, and wealth. This is a Cyberbacker Company Summary Company Values Infographics PDF template with various stages. Focus and dispense information on four stages using this creative set, that comes with editable features. It contains large content boxes to add your information on topics like Growth, Wealth, Relationship. You can also showcase facts, figures, and other relevant content using this PPT layout. Grab it now.

Scrum Task Project Management Board Infographics PDF
The following slide showcases task management board for scrum project teams. It contains details about backlog, to do, in progress, review and evaluation, done, task priority, task managers, etc. Persuade your audience using this Scrum Task Project Management Board Infographics PDF. This PPT design covers one stages, thus making it a great tool to use. It also caters to a variety of topics including Pricing Plans, Business, Payment Methods. Download this PPT design now to present a convincing pitch that not only emphasizes the topic but also showcases your presentation skills.
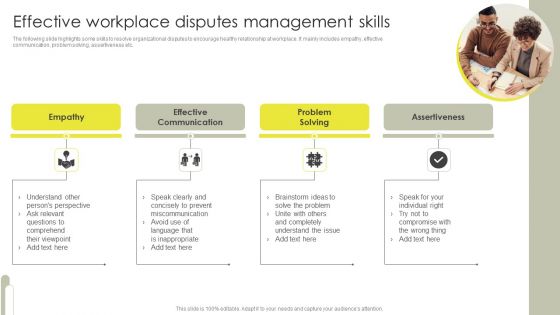
Effective Workplace Disputes Management Skills Infographics PDF
The following slide highlights some skills to resolve organizational disputes to encourage healthy relationship at workplace. It mainly includes empathy, effective communication, problem solving, assertiveness etc. Persuade your audience using this Effective Workplace Disputes Management Skills Infographics PDF. This PPT design covers four stages, thus making it a great tool to use. It also caters to a variety of topics including Effective Communication, Problem Solving, Assertiveness, Empathy. Download this PPT design now to present a convincing pitch that not only emphasizes the topic but also showcases your presentation skills.

Human Resource User Onboarding Procedure Infographics PDF
This slide represents the human resource onboarding workflow process stages for a smooth onboarding. The purpose of this slide is to demonstrate the HR onboarding process. The process stages include pre onboarding, introduction sessions, settling in the company, and taking the follow-up. Presenting Human Resource User Onboarding Procedure Infographics PDF to dispense important information. This template comprises four stages. It also presents valuable insights into the topics including Onboarding, Introductions, Settling In. This is a completely customizable PowerPoint theme that can be put to use immediately. So, download it and address the topic impactfully.
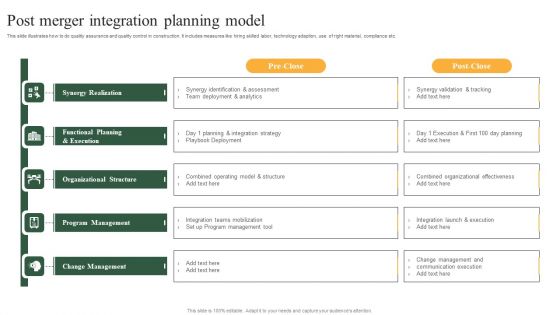
Post Merger Integration Planning Model Infographics PDF
This slide illustrates how to do quality assurance and quality control in construction. It includes measures like hiring skilled labor, technology adaption, use of right material, compliance etc. Presenting Post Merger Integration Planning Model Infographics PDF to dispense important information. This template comprises five stages. It also presents valuable insights into the topics including Synergy Realization, Functional Planning And Execution, Organizational Structure, Program Management, Change Management. This is a completely customizable PowerPoint theme that can be put to use immediately. So, download it and address the topic impactfully.

Volume Testing Overview And Objectives Infographics PDF
This slide depicts the volume testing overview and objectives, including the ability to detect issues while handling a large amount of data, an increase of data volume, etc. Slidegeeks has constructed Volume Testing Overview And Objectives Infographics PDF after conducting extensive research and examination. These presentation templates are constantly being generated and modified based on user preferences and critiques from editors. Here, you will find the most attractive templates for a range of purposes while taking into account ratings and remarks from users regarding the content. This is an excellent jumping-off point to explore our content and will give new users an insight into our top-notch PowerPoint Templates.
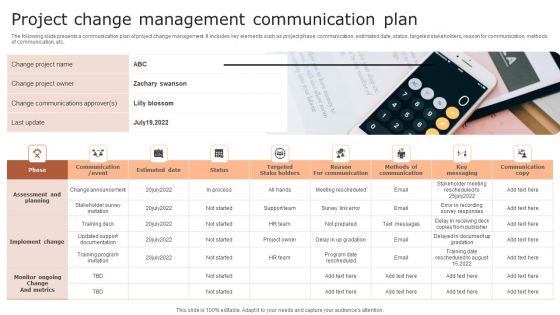
Project Change Management Communication Plan Infographics PDF
The following slide presents a communication plan of project change management. It includes key elements such as project phase, communication, estimated date, status, targeted stakeholders, reason for communication, methods of communication, etc. Persuade your audience using this Project Change Management Communication Plan Infographics PDF. This PPT design covers one stages, thus making it a great tool to use. It also caters to a variety of topics including Communication Plan, Project, Change. Download this PPT design now to present a convincing pitch that not only emphasizes the topic but also showcases your presentation skills.
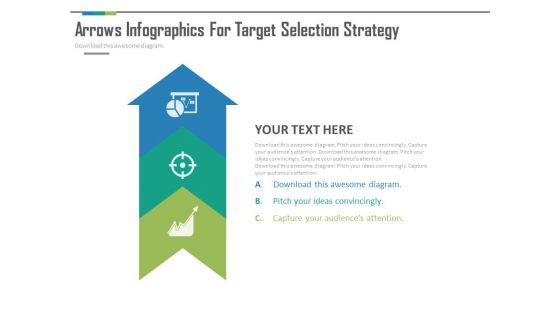
Arrow Infographics With Three Steps Powerpoint Slides
This PowerPoint template contains design of arrow infographic. Download this diagram slide to depict three steps of strategic analysis. Use this PPT slide to make impressive presentations.
Resource Requirement Management Plan Infographics PDF
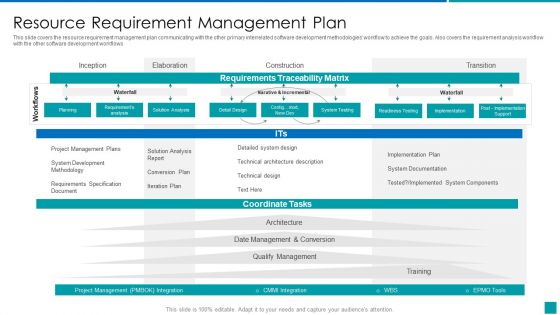
This slide covers the resource requirement management plan communicating with the other primary interrelated software development methodologies workflow to achieve the goals. Also covers the requirement analysis workflow with the other software development workflows. Deliver and pitch your topic in the best possible manner with this Resource Requirement Management Plan Infographics PDF. Use them to share invaluable insights on System Design, Implementation Plan, System Documentation, Requirements and impress your audience. This template can be altered and modified as per your expectations. So, grab it now.
4 Stages Of Data Mining Infographics PDF
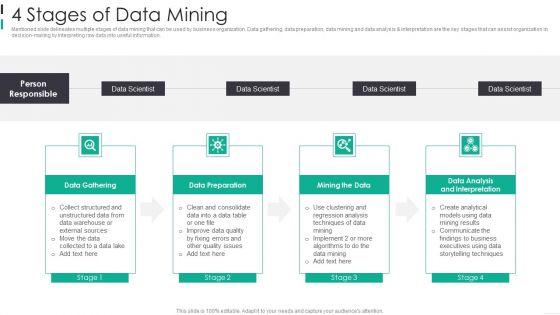
Mentioned slide delineates multiple stages of data mining that can be used by business organization. Data gathering, data preparation, data mining and data analysis and interpretation are the key stages that can assist organization in decision-making by interpreting raw data into useful information. Presenting 4 Stages Of Data Mining Infographics PDF to dispense important information. This template comprises four stages. It also presents valuable insights into the topics including Data Gathering, Data Preparation, Mining The Data This is a completely customizable PowerPoint theme that can be put to use immediately. So, download it and address the topic impactfully.

How Aiops Impacts Business Performance Infographics PDF
This slide represents the ways in which AIOps impacts business performance and its including intelligent alerting, root cause analysis, and threat detection. Slidegeeks has constructed How Aiops Impacts Business Performance Infographics PDF after conducting extensive research and examination. These presentation templates are constantly being generated and modified based on user preferences and critiques from editors. Here, you will find the most attractive templates for a range of purposes while taking into account ratings and remarks from users regarding the content. This is an excellent jumping-off point to explore our content and will give new users an insight into our top-notch PowerPoint Templates.

Sample Value Stream Mapping Diagram Ppt Infographics
This is a sample value stream mapping diagram ppt infographics. This is a four stage process. The stages in this process are supplier, monthly forecast, production control, market forecast, customer, weekly orders, weekly schedule, weekly, daily schedule, daily, shipping, receiving, milling, welding, painting, inspection, people, batch, uptime.
Security Analysis Ppt PowerPoint Presentation Infographics
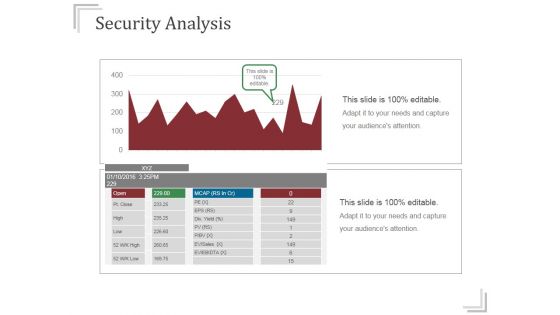
This is a security analysis ppt powerpoint presentation infographics. This is a two stage process. The stages in this process are business, finance, growth, analysis, success.
Timeline Analysis Ppt PowerPoint Presentation Ideas Infographics
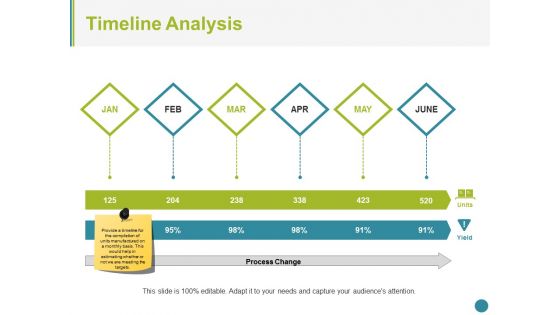
This is a timeline analysis ppt powerpoint presentation ideas infographics. This is a six stage process. The stages in this process are timeline, analysis, process, strategy, planning, success.

Morphological Analysis Ppt PowerPoint Presentation Infographics
This is a morphological analysis ppt powerpoint presentation infographics. This is a five stage process. The stages in this process are variation, element, business, marketing, success.

5S Analysis Ppt PowerPoint Presentation Infographics
This is a 5s analysis ppt powerpoint presentation infographics. This is a five stage process. The stages in this process are standardise, sustain, sort, straighten, shine.
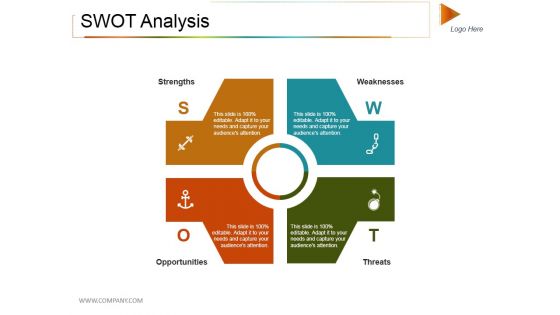
Swot Analysis Ppt PowerPoint Presentation Outline Infographics
This is a swot analysis ppt powerpoint presentation outline infographics. This is a four stage process. The stages in this process are strengths, weaknesses, opportunities, threats.

Competitive Analysis Ppt PowerPoint Presentation Show Infographics
This is a competitive analysis ppt powerpoint presentation show infographics. This is a two stage process. The stages in this process are strengths, weaknesses, own company, competitors.
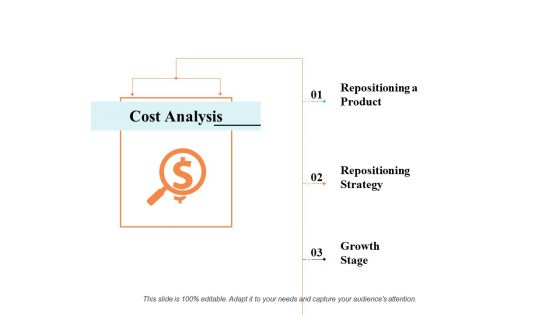
Cost Analysis Ppt PowerPoint Presentation Portfolio Infographics
This is a cost analysis ppt powerpoint presentation portfolio infographics. This is a three stage process. The stages in this process are business, management, marketing.
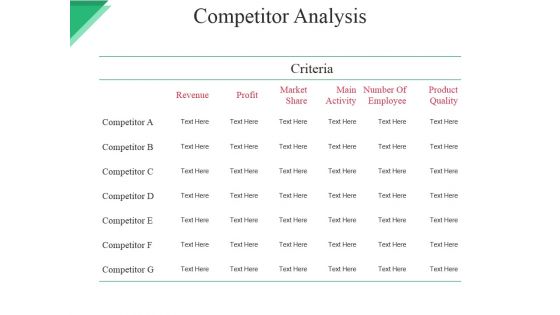
Competitor Analysis Ppt PowerPoint Presentation Show Infographics
This is a competitor analysis ppt powerpoint presentation show infographics. This is a seven stage process. The stages in this process are revenue, profit, market, share, main activity, number of employee.
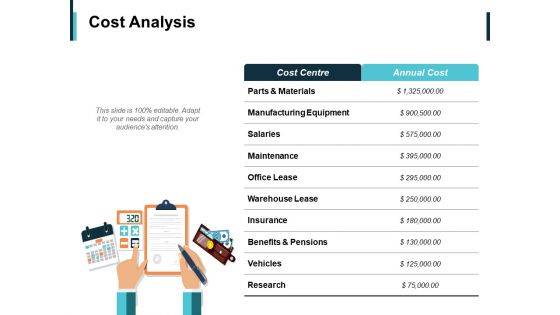
Cost Analysis Ppt PowerPoint Presentation Gallery Infographics
This is a cost analysis ppt powerpoint presentation gallery infographics. This is a two stage process. The stages in this process are maintenance, research, manufacturing equipment, warehouse lease, office lease.

Presentation Infographics For Business Statistics PowerPoint Templates
Define your ideas in a unique and inspiring manner using this template of 3d man standing with board. This pre-designed and appealing PowerPoint template offers an optimized possibility to illustrate your business strategy.
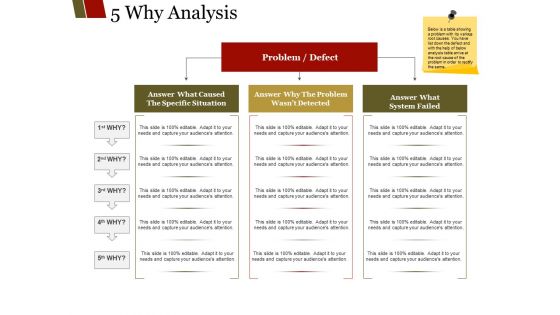
Why Analysis Ppt PowerPoint Presentation Outline Infographics
This is a why analysis ppt powerpoint presentation outline infographics. This is a three stage process. The stages in this process are answer what caused the specific situation, answer why the problem wasn t detected, answer what, system failed, problem defect.
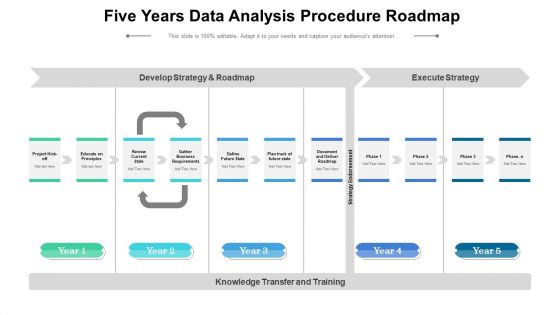
Five Years Data Analysis Procedure Roadmap Infographics
Introducing our five years data analysis procedure roadmap infographics. This PPT presentation is Google Slides compatible, therefore, you can share it easily with the collaborators for measuring the progress. Also, the presentation is available in both standard screen and widescreen aspect ratios. So edit the template design by modifying the font size, font type, color, and shapes as per your requirements. As this PPT design is fully editable it can be presented in PDF, JPG and PNG formats.

Quarterly Big Data Analysis Strategy Roadmap Infographics
Presenting our jaw-dropping quarterly big data analysis strategy roadmap infographics. You can alternate the color, font size, font type, and shapes of this PPT layout according to your strategic process. This PPT presentation is compatible with Google Slides and is available in both standard screen and widescreen aspect ratios. You can also download this well-researched PowerPoint template design in different formats like PDF, JPG, and PNG. So utilize this visually-appealing design by clicking the download button given below.
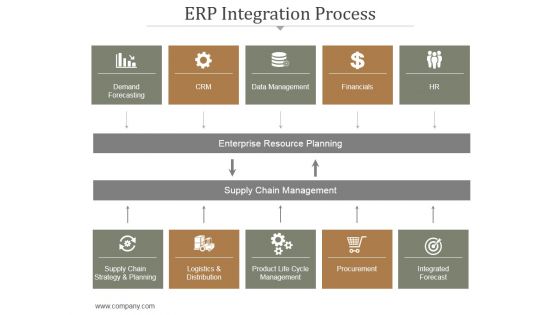
Erp Integration Process Ppt PowerPoint Presentation Infographics
This is a erp integration process ppt powerpoint presentation infographics. This is a five stage process. The stages in this process are demand forecasting, data management, financials, enterprise resource planning, supply chain management, supply chain strategy and planning, logistics and distribution, product life cycle management, procurement, integrated forecast.

Content Ppt PowerPoint Presentation Pictures Infographics
Presenting this set of slides with name content ppt powerpoint presentation pictures infographics. This is a five stage process. The stages in this process are overview, determining the environmental areas to monitor, environmental analysis, identifying the significant changes in environment, forecasting the impact. This is a completely editable PowerPoint presentation and is available for immediate download. Download now and impress your audience.
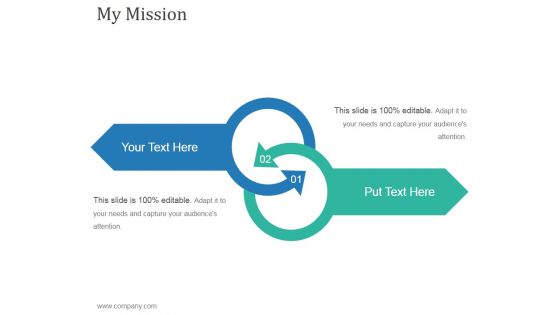
My Mission Ppt PowerPoint Presentation Infographics
This is a my mission ppt powerpoint presentation infographics. This is a two stage process. The stages in this process are business, strategy, analysis, marketing.

 Home
Home