Survey Infographic

Organization Change Readiness Checklist Ppt PowerPoint Presentation Infographics Background Image
This is a organization change readiness checklist ppt powerpoint presentation infographics background image. This is a four stage process. The stages in this process are compare, table, marketing, business, strategy.
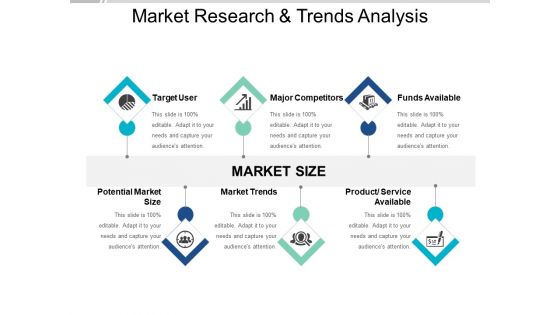
Market Research And Trends Analysis Ppt PowerPoint Presentation Infographics Portfolio
This is a market research and trends analysis ppt powerpoint presentation infographics portfolio. This is a six stage process. The stages in this process are market size, market forecast, market potential.

Poka Yoke Management Ppt PowerPoint Presentation Infographics Rules
This is a poka yoke management ppt powerpoint presentation infographics rules. This is a two stage process. The stages in this process are business, planning, strategy, marketing, management.
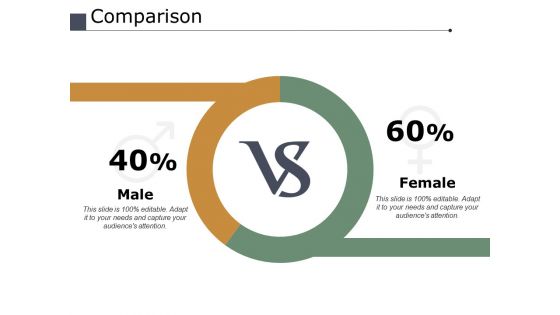
Comparison Male Female Ppt PowerPoint Presentation Infographics Diagrams
This is a comparison male female ppt powerpoint presentation infographics diagrams. This is a two stage process. The stages in this process are comparison, male, female, marketing, management.

Comparison Male Female Ppt PowerPoint Presentation Infographics Examples
This is a comparison male female ppt powerpoint presentation infographics examples. This is a two stage process. The stages in this process are comparison, male, female, marketing, management.

Proportion Circle Infographics For Financial Statement Analysis Mockup PDF
Pitch your topic with ease and precision using this proportion circle infographics for financial statement analysis mockup pdf. This layout presents information on proportion circle infographics for financial statement analysis. It is also available for immediate download and adjustment. So, changes can be made in the color, design, graphics or any other component to create a unique layout.
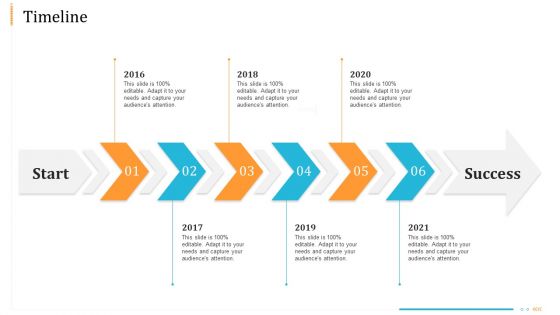
Enterprise Examination And Inspection Timeline Ppt Infographics Slides PDF
This is a enterprise examination and inspection timeline ppt infographics slides pdf template with various stages. Focus and dispense information on six stages using this creative set, that comes with editable features. It contains large content boxes to add your information on topics like timeline, 2016 to 2021. You can also showcase facts, figures, and other relevant content using this PPT layout. Grab it now.

Competitive Intelligence Ppt PowerPoint Presentation Infographics Visual Aids
This is a competitive intelligence ppt powerpoint presentation infographics visual aids. This is a seven stage process. The stages in this process are business, marketing, tables, data, analysis.
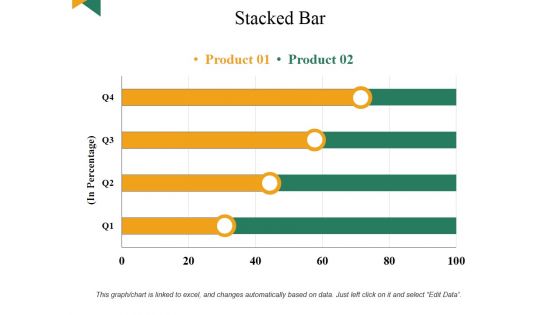
Stacked Bar Ppt PowerPoint Presentation Infographics Design Templates
This is a stacked bar ppt powerpoint presentation infographics design templates. This is a four stage process. The stages in this process are business, marketing, finance, analysis, planning.

High Low Close Chart Ppt PowerPoint Presentation Infographics Shapes
This is a high low close chart ppt powerpoint presentation infographics shapes. This is a five stage process. The stages in this process are close, volume, high, low.
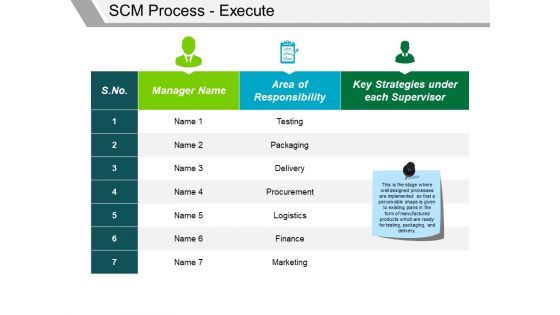
Scm Process Execute Ppt PowerPoint Presentation Infographics Guidelines
This is a scm process execute ppt powerpoint presentation infographics guidelines. This is a two stage process. The stages in this process are testing, packaging, delivery, procurement, logistics.
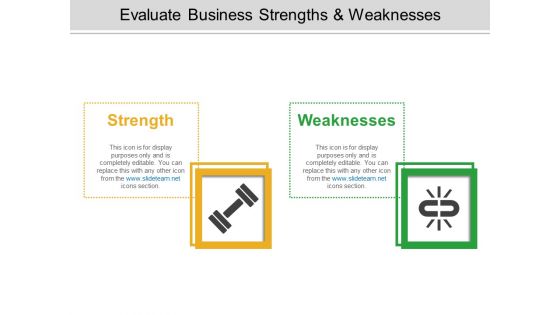
Evaluate Business Strengths And Weaknesses Ppt PowerPoint Presentation Infographics Files
This is a evaluate business strengths and weaknesses ppt powerpoint presentation infographics files. This is a two stage process. The stages in this process are strength, weakness.

Big Data Architecture Ppt PowerPoint Presentation Infographics Elements
This is a big data architecture ppt powerpoint presentation infographics elements. This is a four stage process. The stages in this process are business, management, planning, strategy, marketing.
Our Target Goals Ppt PowerPoint Presentation Infographics Slides
This is a our target goals ppt powerpoint presentation infographics slides. The stages in this process are our mission, target, goal, marketing, strategy.
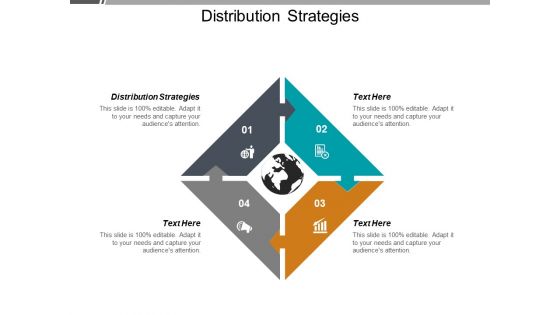
Distribution Strategies Ppt PowerPoint Presentation Infographics Skills Cpb
This is a distribution strategies ppt powerpoint presentation infographics skills cpb. This is a four stage process. The stages in this process are distribution strategies.
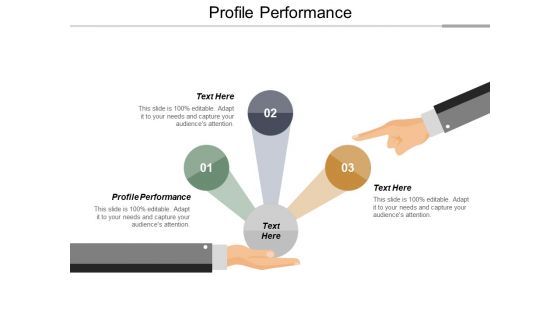
Profile Performance Ppt PowerPoint Presentation Infographics Shapes Cpb
This is a profile performance ppt powerpoint presentation infographics shapes cpb. This is a three stage process. The stages in this process are profile performance.

Recent Marketing Campaigns Ppt PowerPoint Presentation Infographics Vector
This is a recent marketing campaigns ppt powerpoint presentation infographics vector. This is a seven stage process. The stages in this process are recent marketing campaigns.

Budgeting Template 2 Ppt PowerPoint Presentation Infographics Outline
This is a budgeting template 2 ppt powerpoint presentation infographics outline. This is a five stage process. The stages in this process are budgeting, business, finance, marketing, analysis.

Logos Of Competitors Ppt PowerPoint Presentation Infographics Sample
This is a logos of competitors ppt powerpoint presentation infographics sample. This is a six stage process. The stages in this process are business, icons, marketing, strategy, analysis.

Magnifying Glass Ppt PowerPoint Presentation Infographics Example File
This is a magnifying glass ppt powerpoint presentation infographics example file. This is a five stage process. The stages in this process are technology, marketing, strategy, planning, analysis.
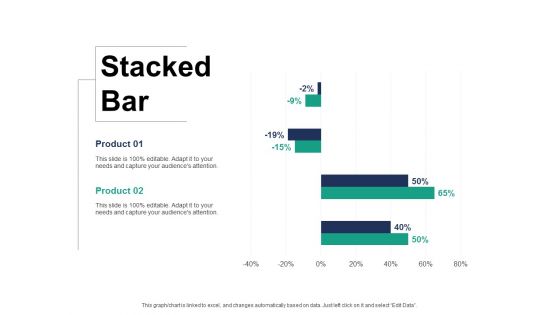
Stacked Bar Finance Ppt PowerPoint Presentation Infographics Grid
This is a stacked bar finance ppt powerpoint presentation infographics grid. This is a two stage process. The stages in this process are finance, marketing, management, investment, analysis.
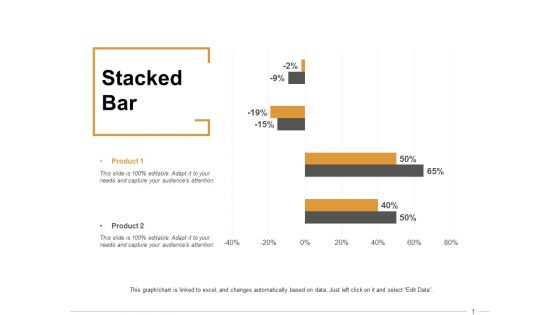
Stacked Bar Finance Ppt PowerPoint Presentation Infographics Outfit
This is a stacked bar finance ppt powerpoint presentation infographics outfit. This is a two stage process. The stages in this process are finance, marketing, management, investment, analysis.

Financial Process Improvement Ppt PowerPoint Presentation Infographics Model
This is a financial process improvement ppt powerpoint presentation infographics model. This is a three stage process. The stages in this process are financial, marketing, strategy, analysis, business.
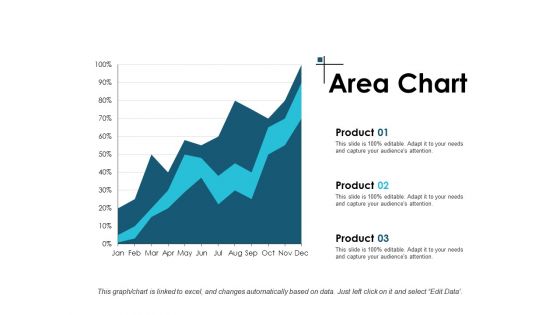
Area Chart Investment Ppt PowerPoint Presentation Infographics Summary
This is a area chart investment ppt powerpoint presentation infographics summary. This is a three stage process. The stages in this process are finance, marketing, management, investment, analysis.

Location Competitive Differentiation Ppt PowerPoint Presentation Infographics Summary
This is a location competitive differentiation ppt powerpoint presentation infographics summary. This is a four stage process. The stages in this process are business, management, icons, location, analysis.

Area Chart Finance Ppt PowerPoint Presentation Infographics Deck
This is a area chart finance ppt powerpoint presentation infographics deck. This is a three stage process. The stages in this process are finance, marketing, management, investment, analysis.
Clustered Bar Finance Ppt PowerPoint Presentation Infographics Example
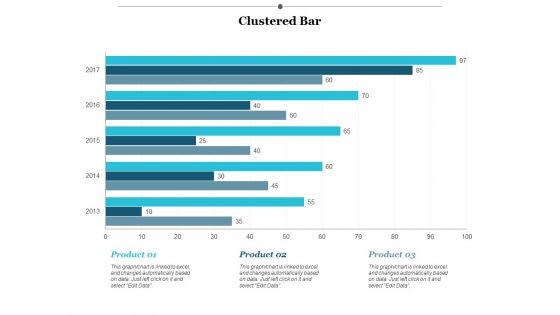
This is a clustered bar finance ppt powerpoint presentation infographics example. This is a three stage process. The stages in this process are finance, marketing, management, investment, analysis.

Stacked Bar Finance Ppt Powerpoint Presentation Infographics Example
This is a stacked bar finance ppt powerpoint presentation infographics example. This is a four stage process. The stages in this process are finance, marketing, management, investment, analysis.
Comparison Realty Management Ppt PowerPoint Presentation Infographics Outfit
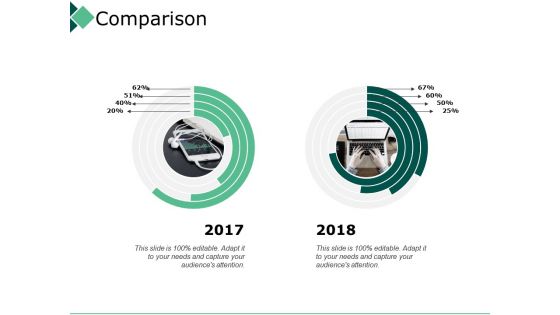
This is a comparison realty management ppt powerpoint presentation infographics outfit. This is a two stage process. The stages in this process are business, management, strategy, analysis, compare.
Puzzle Strategy Approaches Ppt PowerPoint Presentation Infographics Clipart
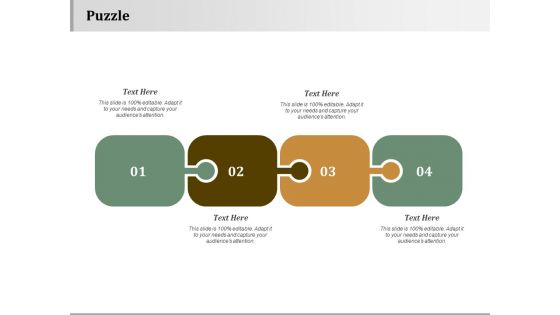
This is a puzzle strategy approaches ppt powerpoint presentation infographics clipart. This is a four stage process. The stages in this process are business, management, strategy, analysis, marketing.
Matrix Management Marketing Ppt PowerPoint Presentation Infographics Deck
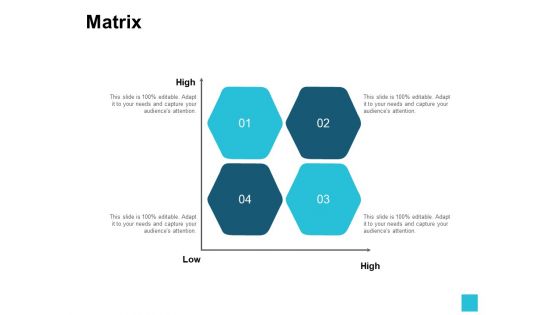
This is a matrix management marketing ppt powerpoint presentation infographics deck. This is a four stage process. The stages in this process are marketing, business, management, strategy, analysis.
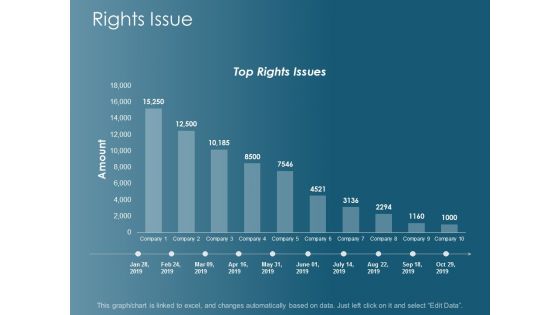
Rights Issue Finance Ppt Powerpoint Presentation Infographics Gallery
This is a rights issue finance ppt powerpoint presentation infographics gallery. This is a one stage process. The stages in this process are finance, marketing, management, investment, analysis.
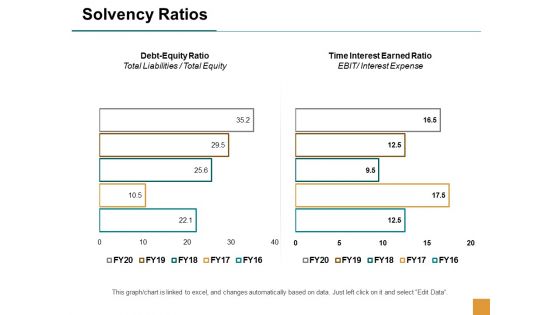
Solvency Ratios Marketing Ppt Powerpoint Presentation Infographics Template
This is a solvency ratios marketing ppt powerpoint presentation infographics template. This is a two stage process. The stages in this process are finance, marketing, management, investment, analysis.

Financial Medium Maximum Ppt Powerpoint Presentation Infographics Slides
This is a financial medium maximum ppt powerpoint presentation infographics slides. This is a three stage process. The stages in this process are finance, marketing, management, investment, analysis.
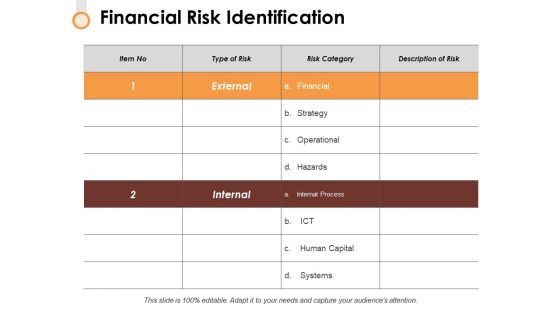
Financial Risk Identification Ppt PowerPoint Presentation Infographics Example
This is a financial risk identification ppt powerpoint presentation infographics example. This is a two stage process. The stages in this process are compare, business, analysis, strategy, marketing.
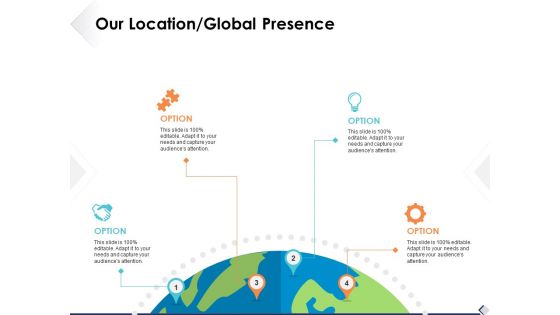
Our Location Global Presence Ppt PowerPoint Presentation Infographics Images
This is a our location global presence ppt powerpoint presentation infographics images. This is a four stage process. The stages in this process are location, strategy, analysis, marketing.

Our Major Markets Ppt PowerPoint Presentation Infographics Smartart
This is a our major markets ppt powerpoint presentation infographics smartart. This is a two stage process. The stages in this process are location, strategy, analysis, marketing.
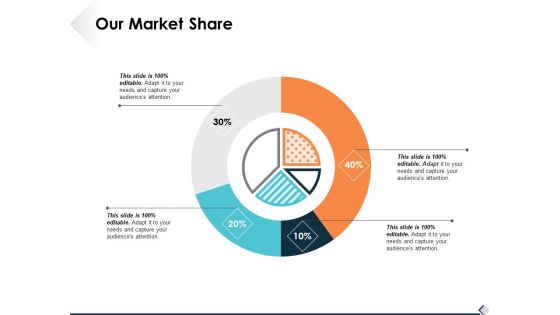
Our Market Share Ppt PowerPoint Presentation Infographics Inspiration
This is a our market share ppt powerpoint presentation infographics inspiration. This is a four stage process. The stages in this process are business, finance, strategy, analysis, marketing.

Work Breakdown Structure Ppt PowerPoint Presentation Infographics Brochure
This is a work breakdown structure ppt powerpoint presentation infographics brochure. This is a two stage process. The stages in this process are business, management, strategy, analysis, marketing.
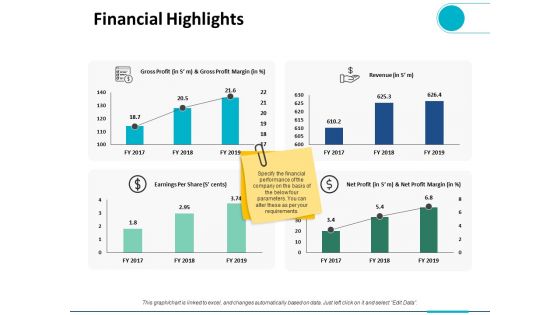
Financial Highlights Ppt PowerPoint Presentation Infographics Slide Portrait
This is a financial highlights ppt powerpoint presentation infographics slide portrait. This is a four stage process. The stages in this process are finance, analysis, business, investment, marketing.
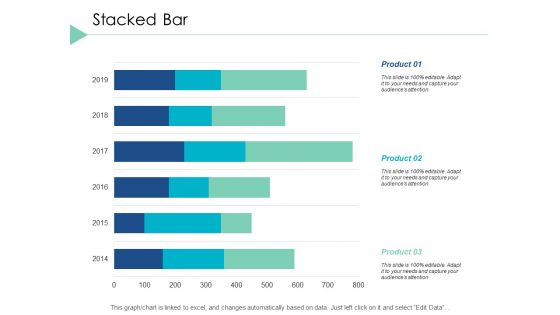
Stacked Bar Finance Ppt PowerPoint Presentation Infographics Guide
This is a stacked bar finance ppt powerpoint presentation infographics guide. This is a three stage process. The stages in this process are finance, marketing, analysis, investment, million.

Experience Curves Template Ppt PowerPoint Presentation Infographics Styles
This is a experience curves template ppt powerpoint presentation infographics styles. This is a two stage process. The stages in this process are finance, marketing, analysis, investment, million.
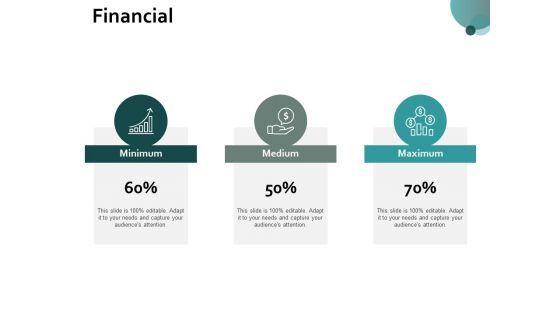
Financial Management Investment Ppt PowerPoint Presentation Infographics Objects
This is a financial management investment ppt powerpoint presentation infographics objects. This is a three stage process. The stages in this process are finance, marketing, management, investment, analysis.

Financial Management Ppt Powerpoint Presentation Infographics Graphics Cpb
This is a financial management ppt powerpoint presentation infographics graphics cpb. This is a three stage process. The stages in this process are finance, marketing, management, investment, analysis.
Strategic Business Planning And Budget Forecasting Icon Infographics PDF
Presenting Strategic Business Planning And Budget Forecasting Icon Infographics PDF to dispense important information. This template comprises three stages. It also presents valuable insights into the topics including Strategic Business, Planning, Budget Forecasting. This is a completely customizable PowerPoint theme that can be put to use immediately. So, download it and address the topic impactfully.
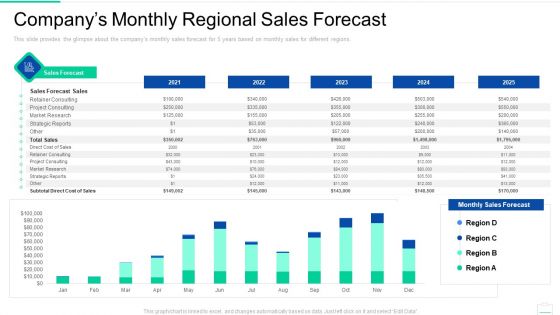
Market Area Analysis Companys Monthly Regional Sales Forecast Infographics PDF
This slide provides the glimpse about the companys monthly sales forecast for 5 years based on monthly sales for different regions.Deliver and pitch your topic in the best possible manner with this market area analysis companys monthly regional sales forecast infographics pdf. Use them to share invaluable insights on retainer consulting, market research, strategic reports and impress your audience. This template can be altered and modified as per your expectations. So, grab it now.
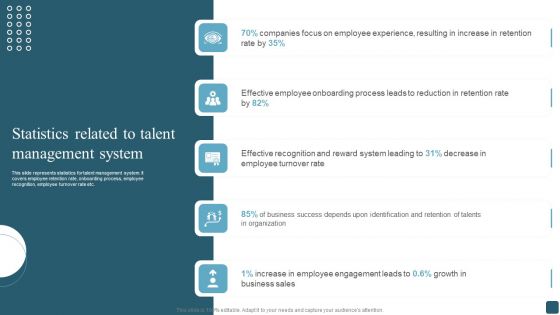
Statistics Related To Talent Management System Infographics PDF
This slide represents statistics for talent management system. It covers employee retention rate, onboarding process, employee recognition, employee turnover rate etc. Get a simple yet stunning designed Statistics Related To Talent Management System Infographics PDF. It is the best one to establish the tone in your meetings. It is an excellent way to make your presentations highly effective. So, download this PPT today from Slidegeeks and see the positive impacts. Our easy-to-edit Statistics Related To Talent Management System Infographics PDF can be your go-to option for all upcoming conferences and meetings. So, what are you waiting for Grab this template today.
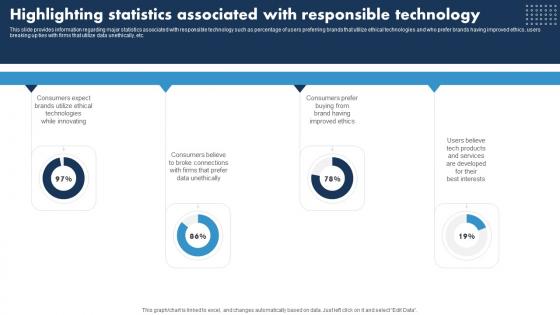
Highlighting Statistics Associated Esponsible Tech Guide To Manage Infographics Pdf
This slide provides information regarding major statistics associated with responsible technology such as percentage of users preferring brands that utilize ethical technologies and who prefer brands having improved ethics, users breaking up ties with firms that utilize data unethically, etc. Coming up with a presentation necessitates that the majority of the effort goes into the content and the message you intend to convey. The visuals of a PowerPoint presentation can only be effective if it supplements and supports the story that is being told. Keeping this in mind our experts created Highlighting Statistics Associated Esponsible Tech Guide To Manage Infographics Pdf to reduce the time that goes into designing the presentation. This way, you can concentrate on the message while our designers take care of providing you with the right template for the situation.

Forecasted Outcomes Achieved After Implementing New Strategies Infographics PDF
This slide shows the training plan providing for existing customer executives for enhancing skills and knowledge in their job area for achieving customer satisfaction. It includes training topic, date and time of training with details of each training material. Are you searching for a Forecasted Outcomes Achieved After Implementing New Strategies Infographics PDF that is uncluttered, straightforward, and original Its easy to edit, and you can change the colors to suit your personal or business branding. For a presentation that expresses how much effort you have put in, this template is ideal With all of its features, including tables, diagrams, statistics, and lists, its perfect for a business plan presentation. Make your ideas more appealing with these professional slides. Download Forecasted Outcomes Achieved After Implementing New Strategies Infographics PDF from Slidegeeks today.
Artificial Intelligence Trends In HR Statistical Icon Infographics PDF
Deliver and pitch your topic in the best possible manner with this Artificial Intelligence Trends In HR Statistical Icon Infographics PDF. Use them to share invaluable insights on Artificial Intelligence Trends, Hr Statistical Icon and impress your audience. This template can be altered and modified as per your expectations. So, grab it now.

Checklist To Monitor IT Infrastructure Functional Areas Infographics PDF
This slide provides information regarding the checklist to monitor IT infrastructure focus areas. The assessment checklist defines key activities for effective infrastructure management in terms of data and cloud storage, hardware and software capabilities, etc. There are so many reasons you need a Checklist To Monitor IT Infrastructure Functional Areas Infographics PDF. The first reason is you can not spend time making everything from scratch, Thus, Slidegeeks has made presentation templates for you too. You can easily download these templates from our website easily.
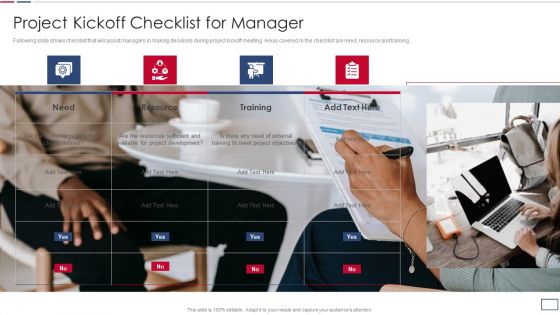
Software Developer Playbook Project Kickoff Checklist For Manager Infographics PDF
Following slide shows checklist that will assist managers in making decisions during project kickoff meeting. Areas covered in the checklist are need, resource and training. Presenting software developer playbook project kickoff checklist for manager infographics pdf to provide visual cues and insights. Share and navigate important information on one stages that need your due attention. This template can be used to pitch topics like resource, training, project objectives. In addtion, this PPT design contains high resolution images, graphics, etc, that are easily editable and available for immediate download.

Web Design Development Project Strategy Checklist Infographics PDF
The slide showcases a website development checklist highlighting key requirements the web developers to keep in mind while developing a reliable website for their business. It covers aspects such as requirements, assigned to and additional comments. Showcasing this set of slides titled Web Design Development Project Strategy Checklist Infographics PDF. The topics addressed in these templates are Accessibility, Project Strategy Checklist, Web Design Development. All the content presented in this PPT design is completely editable. Download it and make adjustments in color, background, font etc. as per your unique business setting.
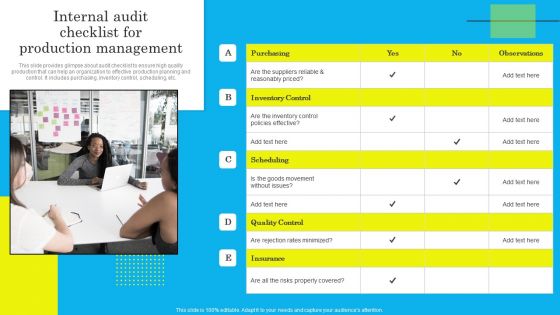
Internal Audit Checklist For Production Management Infographics PDF
This slide provides glimpse about audit checklist to ensure high quality production that can help an organization to effective production planning and control. It includes purchasing, inventory control, scheduling, etc. From laying roadmaps to briefing everything in detail, our templates are perfect for you. You can set the stage with your presentation slides. All you have to do is download these easy to edit and customizable templates. Internal Audit Checklist For Production Management Infographics PDF will help you deliver an outstanding performance that everyone would remember and praise you for. Do download this presentation today.
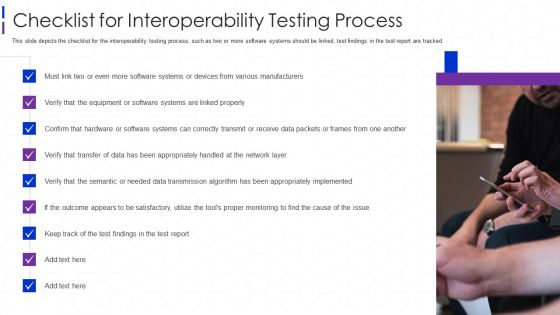
Software Interoperability Examination IT Checklist For Interoperability Testing Infographics PDF
This slide depicts the checklist for the interoperability testing process, such as two or more software systems should be linked, test findings in the test report are tracked. This is a software interoperability examination it checklist for interoperability testing infographics pdf template with various stages. Focus and dispense information on nine stages using this creative set, that comes with editable features. It contains large content boxes to add your information on topics like systems, devices, quipment, data, network. You can also showcase facts, figures, and other relevant content using this PPT layout. Grab it now.
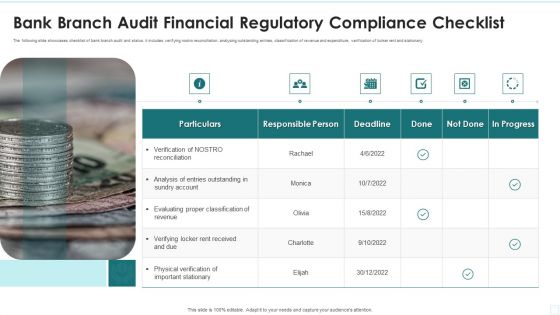
Bank Branch Audit Financial Regulatory Compliance Checklist Infographics PDF
The following slide showcases checklist of bank branch audit and status. it includes verifying nostro reconciliation, analyzing outstanding entries, classification of revenue and expenditure, verification of locker rent and stationary.Presenting Bank Branch Audit Financial Regulatory Compliance Checklist Infographics PDF to dispense important information. This template comprises one stage. It also presents valuable insights into the topics including Responsible Person, Verification Reconciliation, Evaluating Proper This is a completely customizable PowerPoint theme that can be put to use immediately. So, download it and address the topic impactfully.
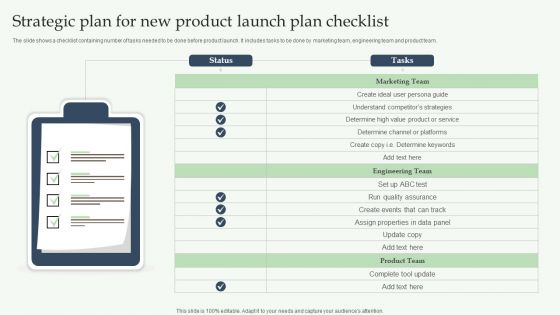
Strategic Plan For New Product Launch Plan Checklist Infographics PDF
The slide shows a checklist containing number of tasks needed to be done before product launch. It includes tasks to be done by marketing team, engineering team and product team. Presenting Strategic Plan For New Product Launch Plan Checklist Infographics PDF to dispense important information. This template comprises one stages. It also presents valuable insights into the topics including Marketing Team, Engineering Team, Product Team. This is a completely customizable PowerPoint theme that can be put to use immediately. So, download it and address the topic impactfully.
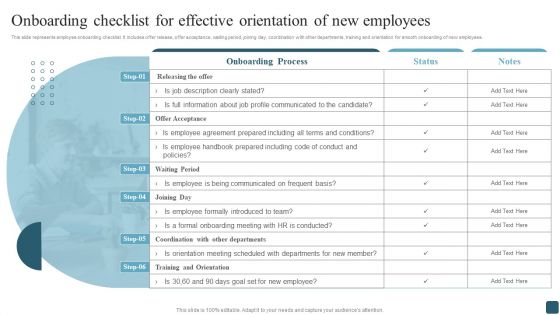
Onboarding Checklist For Effective Orientation Of New Employees Infographics PDF
This slide represents employee onboarding checklist. It includes offer release, offer acceptance, waiting period, joining day, coordination with other departments, training and orientation for smooth onboarding of new employees. Want to ace your presentation in front of a live audience Our Onboarding Checklist For Effective Orientation Of New Employees Infographics PDF can help you do that by engaging all the users towards you.. Slidegeeks experts have put their efforts and expertise into creating these impeccable powerpoint presentations so that you can communicate your ideas clearly. Moreover, all the templates are customizable, and easy-to-edit and downloadable. Use these for both personal and commercial use.

Website Needs Checklist To Enhance Ecommerce Company Infographics PDF
The slide showcases a checklist that assists in overseeing tasks and verifying if they are completed by the assigned employee or not. The slide represents the website requirements for an e-commerce businesss online store. The elements are tasks to be performed and assigned to, yes, no, etc. Showcasing this set of slides titled Website Needs Checklist To Enhance Ecommerce Company Infographics PDF. The topics addressed in these templates are Enhancing Ecommerce, Website Design, Management System. All the content presented in this PPT design is completely editable. Download it and make adjustments in color, background, font etc. as per your unique business setting.

Merger And Acquisition Due Diligence Checklist Challenges During Infographics PDF
This slide explains various possible challenges that can occur during M and A and corrective measures to overcome them. Challenges covered are overpaying, failed integration and manual documentation.This is a merger and acquisition due diligence checklist challenges during infographics pdf template with various stages. Focus and dispense information on two stages using this creative set, that comes with editable features. It contains large content boxes to add your information on topics like failed integration, manual documentation, overpaying You can also showcase facts, figures, and other relevant content using this PPT layout. Grab it now.

 Home
Home