Quarterly Dashboard

Growing Churn Rate In IT Organization Dashboard Employee Attrition Rate Report Topics PDF
Deliver an awe-inspiring pitch with this creative growing churn rate in it organization dashboard employee attrition rate report topics pdf bundle. Topics like period selection month, current month, annual fluctuation rate can be discussed with this completely editable template. It is available for immediate download depending on the needs and requirements of the user.

Vehicle Sales Plunge In An Automobile Firm Advanced Technology Vehicle Dashboard Inspiration PDF
Deliver and pitch your topic in the best possible manner with this vehicle sales plunge in an automobile firm advanced technology vehicle dashboard inspiration pdf. Use them to share invaluable insights on total sales, annual sales, top sales by atv sales, monthly sales and impress your audience. This template can be altered and modified as per your expectations. So, grab it now.
Customer Attrition Rate Dashboard For IBN Outsourcing Company Ppt Icon PDF
Deliver and pitch your topic in the best possible manner with this customer attrition rate dashboard for ibn outsourcing company ppt icon pdf. Use them to share invaluable insights on operational efficiency 2021, product service adoption rate 2021, annual growth rate 2021 and impress your audience. This template can be altered and modified as per your expectations. So, grab it now.

Income Assessment Report Employees Analytics Dashboard Showing Low Salary Concerns Inspiration PDF
Deliver an awe inspiring pitch with this creative Income Assessment Report Employees Analytics Dashboard Showing Low Salary Concerns Inspiration PDF bundle. Topics like Annual Salary, Total Bonus, Paid Employee can be discussed with this completely editable template. It is available for immediate download depending on the needs and requirements of the user.
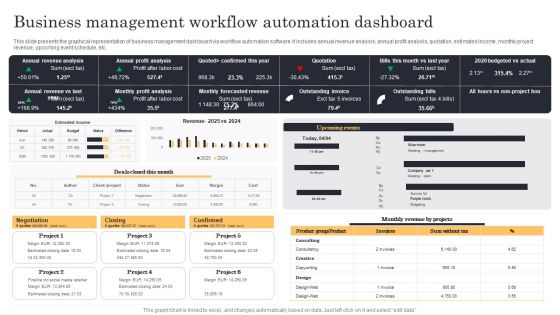
Streamlining Manufacturing Processes With Workflow Automation Business Management Workflow Automation Dashboard Portrait PDF
This slide presents the graphical representation of business management dashboard via workflow automation software. It includes annual revenue analysis, annual profit analysis, quotation, estimated income, monthly project revenue, upcoming event schedule, etc. Slidegeeks is one of the best resources for PowerPoint templates. You can download easily and regulate Streamlining Manufacturing Processes With Workflow Automation Business Management Workflow Automation Dashboard Portrait PDF for your personal presentations from our wonderful collection. A few clicks is all it takes to discover and get the most relevant and appropriate templates. Use our Templates to add a unique zing and appeal to your presentation and meetings. All the slides are easy to edit and you can use them even for advertisement purposes.

Hazard Administration Crisis Management Dashboard Showing Risk Heat Map Risk Score Guidelines PDF
Presenting this set of slides with name hazard administration crisis management dashboard showing risk heat map risk score guidelines pdf. The topics discussed in these slides are risk heat map, annualized cost of control, risk score current, grc risk history, risk compared to cost of controls. This is a completely editable PowerPoint presentation and is available for immediate download. Download now and impress your audience.
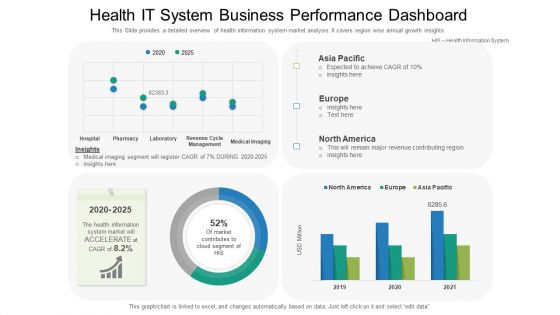
Health IT System Business Performance Dashboard Ppt Summary File Formats PDF
This Slide provides a detailed overview of health information system market analysis. It covers region wise annual growth insights. Showcasing this set of slides titled health it system business performance dashboard ppt summary file formats pdf. The topics addressed in these templates are market contributes, cloud segment, revenue contributing. All the content presented in this PPT design is completely editable. Download it and make adjustments in color, background, font etc. as per your unique business setting.

Improvement In Employee Turnover In Technology Industry Dashboard Employee Attrition Rate Diagrams PDF
This slide shows the various factors related to the employees attrition rate growth in the company. Deliver and pitch your topic in the best possible manner with this improvement in employee turnover in technology industry dashboard employee attrition rate diagrams pdf. Use them to share invaluable insights on annual fluctuation, fluctuation report, workforce and impress your audience. This template can be altered and modified as per your expectations. So, grab it now.
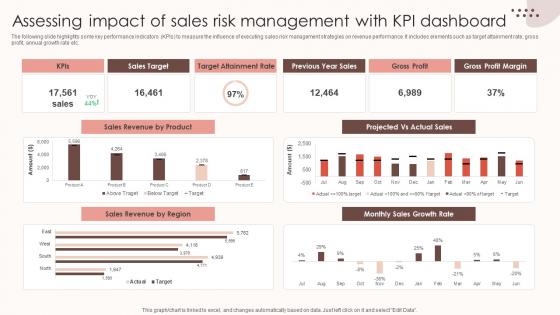
Assessing Sales Risks Assessing Impact Of Sales Risk Management With Kpi Dashboard Topics PDF
The following slide highlights some key performance indicators KPIs to measure the influence of executing sales risk management strategies on revenue performance. It includes elements such as target attainment rate, gross profit, annual growth rate etc. Create an editable Assessing Sales Risks Assessing Impact Of Sales Risk Management With Kpi Dashboard Topics PDF that communicates your idea and engages your audience. Whether you are presenting a business or an educational presentation, pre-designed presentation templates help save time. Assessing Sales Risks Assessing Impact Of Sales Risk Management With Kpi Dashboard Topics PDF is highly customizable and very easy to edit, covering many different styles from creative to business presentations. Slidegeeks has creative team members who have crafted amazing templates. So, go and get them without any delay.

Staff Succession Planning And Development Dashboard To Measure Employee Turnover Rate Mockup PDF
This slide shows a dashboard that can be used by a firm to measure its employee turnover rate at different locations. It also portraits details about annual fluctuation rate along with number of leavers.Slidegeeks is one of the best resources for PowerPoint templates. You can download easily and regulate Staff Succession Planning And Development Dashboard To Measure Employee Turnover Rate Mockup PDF for your personal presentations from our wonderful collection. A few clicks is all it takes to discover and get the most relevant and appropriate templates. Use our Templates to add a unique zing and appeal to your presentation and meetings. All the slides are easy to edit and you can use them even for advertisement purposes.

Internal Employee Succession Dashboard To Measure Employee Turnover Rate Rules PDF
This slide shows a dashboard that can be used by a firm to measure its employee turnover rate at different locations. It also portraits details about annual fluctuation rate along with number of leavers. This Internal Employee Succession Dashboard To Measure Employee Turnover Rate Rules PDF from Slidegeeks makes it easy to present information on your topic with precision. It provides customization options, so you can make changes to the colors, design, graphics, or any other component to create a unique layout. It is also available for immediate download, so you can begin using it right away. Slidegeeks has done good research to ensure that you have everything you need to make your presentation stand out. Make a name out there for a brilliant performance.
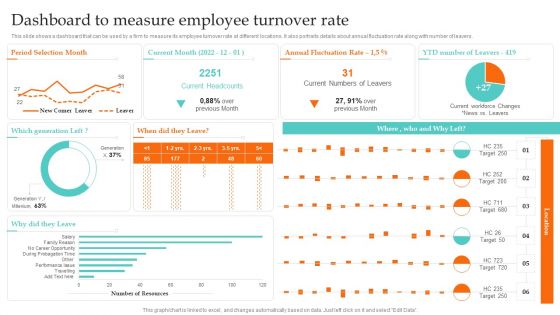
Dashboard To Measure Employee Turnover Rate Ultimate Guide To Employee Succession Planning Elements PDF
This slide shows a dashboard that can be used by a firm to measure its employee turnover rate at different locations. It also portraits details about annual fluctuation rate along with number of leavers.Do you know about Slidesgeeks Dashboard To Measure Employee Turnover Rate Ultimate Guide To Employee Succession Planning Elements PDF These are perfect for delivering any kind od presentation. Using it, create PowerPoint presentations that communicate your ideas and engage audiences. Save time and effort by using our pre-designed presentation templates that are perfect for a wide range of topic. Our vast selection of designs covers a range of styles, from creative to business, and are all highly customizable and easy to edit. Download as a PowerPoint template or use them as Google Slides themes.
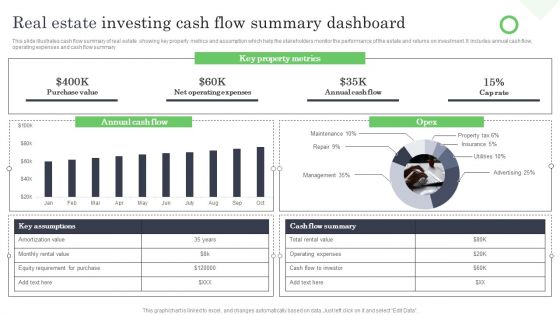
Real Estate Investing Cash Flow Summary Dashboard Ppt Model Design Ideas PDF
This slide illustrates cash flow summary of real estate showing key property metrics and assumption which help the stakeholders monitor the performance of the estate and returns on investment. It includes annual cash flow, operating expenses and cash flow summary. Showcasing this set of slides titled Real Estate Investing Cash Flow Summary Dashboard Ppt Model Design Ideas PDF. The topics addressed in these templates are Key Property Metrics, Cap Rate, Annual Cash Flow, Net Operating Expenses. All the content presented in this PPT design is completely editable. Download it and make adjustments in color, background, font etc. as per your unique business setting.

Post COVID 19 Automobile Market Insights With KPI Dashboard Ppt PowerPoint Presentation Slides Background Images PDF
The following slide highlights the impact of COVID 19 on automobile industry at global level. It includes KPAs such as expected CAGR, forecasted growth, annual growth rate, key insights etc. for the coming five years. Showcasing this set of slides titled Post COVID 19 Automobile Market Insights With KPI Dashboard Ppt PowerPoint Presentation Slides Background Images PDF. The topics addressed in these templates are Expected Compound, Annual Growth, Overall Impact. All the content presented in this PPT design is completely editable. Download it and make adjustments in color, background, font etc. as per your unique business setting.
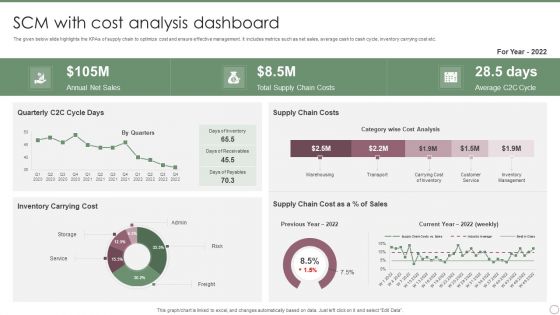
SCM With Cost Analysis Dashboard Ppt PowerPoint Presentation File Slides PDF
The given below slide highlights the KPAs of supply chain to optimize cost and ensure effective management. It includes metrics such as net sales, average cash to cash cycle, inventory carrying cost etc. Showcasing this set of slides titled SCM With Cost Analysis Dashboard Ppt PowerPoint Presentation File Slides PDF. The topics addressed in these templates are Annual Net Sales, Total Supply Chain, Costs, Average C2C Cycle. All the content presented in this PPT design is completely editable. Download it and make adjustments in color, background, font etc. as per your unique business setting.

Landing Page Leads And Revenue Generation Analytics For User Experience Optimization Dashboard Formats PDF
This slide covers website analytics based on revenue earned. It also included leads generated, bounce rates, customer churn stats, annual and monthly recurring revenue, etc. Pitch your topic with ease and precision using this Landing Page Leads And Revenue Generation Analytics For User Experience Optimization Dashboard Formats PDF. This layout presents information on Monthly Recurring Revenue, Bounce Rate, Gross Volume. It is also available for immediate download and adjustment. So, changes can be made in the color, design, graphics or any other component to create a unique layout.
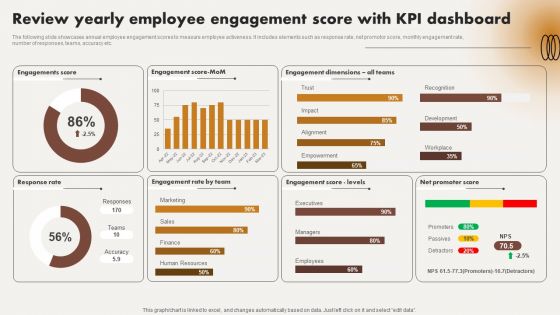
Review Yearly Employee Engagement Score With Kpi Dashboard Ppt Pictures Design Ideas PDF
The following slide showcases annual employee engagement scores to measure employee activeness. It includes elements such as response rate, net promotor score, monthly engagement rate, number of responses, teams, accuracy etc. From laying roadmaps to briefing everything in detail, our templates are perfect for you. You can set the stage with your presentation slides. All you have to do is download these easy to edit and customizable templates. Review Yearly Employee Engagement Score With Kpi Dashboard Ppt Pictures Design Ideas PDF will help you deliver an outstanding performance that everyone would remember and praise you for. Do download this presentation today.
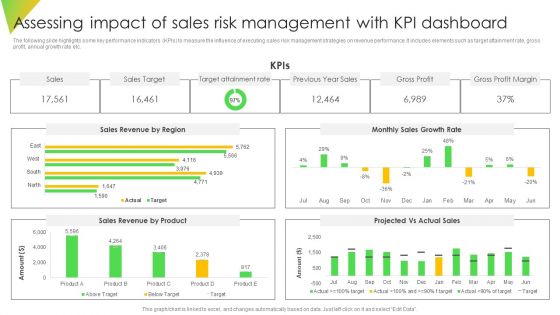
Assessing Impact Of Sales Risk Management With Kpi Dashboard Diagrams PDF
The following slide highlights some key performance indicators KPIs to measure the influence of executing sales risk management strategies on revenue performance. It includes elements such as target attainment rate, gross profit, annual growth rate etc. Boost your pitch with our creative Assessing Impact Of Sales Risk Management With Kpi Dashboard Diagrams PDF. Deliver an awe inspiring pitch that will mesmerize everyone. Using these presentation templates you will surely catch everyones attention. You can browse the ppts collection on our website. We have researchers who are experts at creating the right content for the templates. So you do not have to invest time in any additional work. Just grab the template now and use them.

Assessing Impact Of Sales Risk Management With KPI Dashboard Ppt Professional Graphics Pictures PDF
The following slide highlights some key performance indicators KPIs to measure the influence of executing sales risk management strategies on revenue performance. It includes elements such as target attainment rate, gross profit, annual growth rate etc. Are you in need of a template that can accommodate all of your creative concepts This one is crafted professionally and can be altered to fit any style. Use it with Google Slides or PowerPoint. Include striking photographs, symbols, depictions, and other visuals. Fill, move around, or remove text boxes as desired. Test out color palettes and font mixtures. Edit and save your work, or work with colleagues. Download Assessing Impact Of Sales Risk Management With KPI Dashboard Ppt Professional Graphics Pictures PDF and observe how to make your presentation outstanding. Give an impeccable presentation to your group and make your presentation unforgettable.
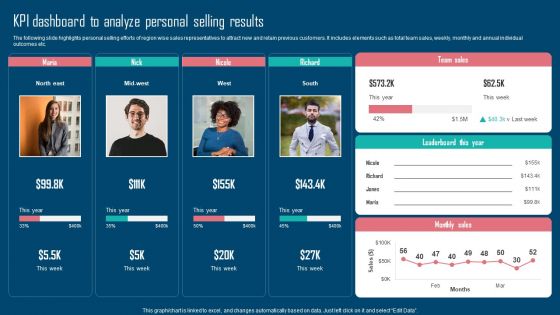
Adopting IMC Technique To Boost Brand Recognition Kpi Dashboard To Analyze Personal Selling Results Formats PDF
The following slide highlights personal selling efforts of region wise sales representatives to attract new and retain previous customers. It includes elements such as total team sales, weekly, monthly and annual individual outcomes etc. Coming up with a presentation necessitates that the majority of the effort goes into the content and the message you intend to convey. The visuals of a PowerPoint presentation can only be effective if it supplements and supports the story that is being told. Keeping this in mind our experts created Adopting IMC Technique To Boost Brand Recognition Kpi Dashboard To Analyze Personal Selling Results Formats PDF to reduce the time that goes into designing the presentation. This way, you can concentrate on the message while our designers take care of providing you with the right template for the situation.
Viral Marketing Techniques To Increase Annual Business Sales Dashboard For Tracking Viral Posts Across Digital Structure PDF
This slide showcases dashboard which can help marketers track viral posts across multiple platforms. It provides details about viral views, seed views, direct, searh, referrer, network, Facebook, Twitter, etc. Coming up with a presentation necessitates that the majority of the effort goes into the content and the message you intend to convey. The visuals of a PowerPoint presentation can only be effective if it supplements and supports the story that is being told. Keeping this in mind our experts created Viral Marketing Techniques To Increase Annual Business Sales Dashboard For Tracking Viral Posts Across Digital Structure PDF to reduce the time that goes into designing the presentation. This way, you can concentrate on the message while our designers take care of providing you with the right template for the situation.

Viral Marketing Techniques To Increase Annual Business Sales Social Media Analytics Dashboard To Track Viral Demonstration PDF
This slides showcases social media analytics dashboard to track viral keywords. It provides details about daily volume, keyword searches, keyword volume, etc. which can effectively guide digital marketers to craft potential campaigns Slidegeeks is one of the best resources for PowerPoint templates. You can download easily and regulate Viral Marketing Techniques To Increase Annual Business Sales Social Media Analytics Dashboard To Track Viral Demonstration PDF for your personal presentations from our wonderful collection. A few clicks is all it takes to discover and get the most relevant and appropriate templates. Use our Templates to add a unique zing and appeal to your presentation and meetings. All the slides are easy to edit and you can use them even for advertisement purposes.
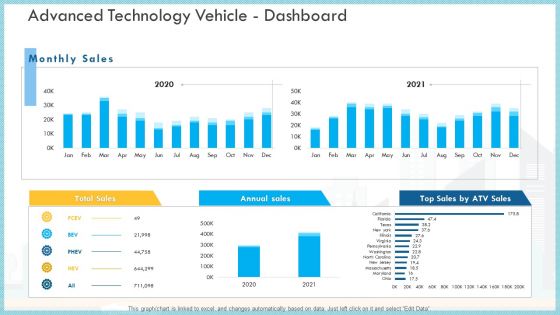
Loss Of Income And Financials Decline In An Automobile Organization Case Study Advanced Technology Vehicle Dashboard Infographics PDF
This graph or chart is linked to excel, and changes automatically based on data. Just left click on it and select Edit Data.Deliver an awe inspiring pitch with this creative loss of income and financials decline in an automobile organization case study advanced technology vehicle dashboard infographics pdf bundle. Topics like total sales, annual sales, monthly sales can be discussed with this completely editable template. It is available for immediate download depending on the needs and requirements of the user.

Sales Risk Assessment For Profit Maximization Assessing Impact Of Sales Risk Management With Kpi Dashboard Inspiration PDF
The following slide highlights some key performance indicators KPIs to measure the influence of executing sales risk management strategies on revenue performance. It includes elements such as target attainment rate, gross profit, annual growth rate etc. Find a pre designed and impeccable Sales Risk Assessment For Profit Maximization Assessing Impact Of Sales Risk Management With Kpi Dashboard Inspiration PDF. The templates can ace your presentation without additional effort. You can download these easy to edit presentation templates to make your presentation stand out from others. So, what are you waiting for Download the template from Slidegeeks today and give a unique touch to your presentation.
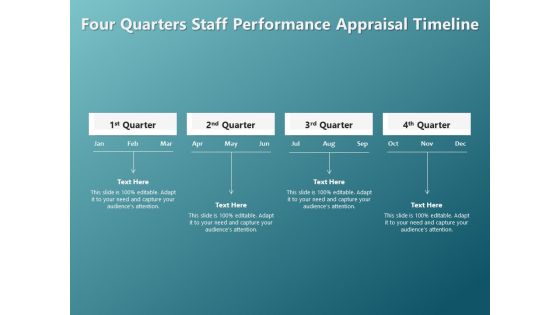
Four Quarters Staff Performance Appraisal Timeline Ppt PowerPoint Presentation Infographic Template Summary PDF
Presenting this set of slides with name four quarters staff performance appraisal timeline ppt powerpoint presentation infographic template summary pdf. This is a four stage process. The stages in this process are four quarters staff performance appraisal timeline. This is a completely editable PowerPoint presentation and is available for immediate download. Download now and impress your audience.
Sales Performance Ppt PowerPoint Presentation Visual Aids Icon
This is a sales performance ppt powerpoint presentation visual aids icon. This is a six stage process. The stages in this process are quarterly sales review, sales performance dashboard, sales by region, sales revenue by product.

Sales Performance Ppt PowerPoint Presentation Pictures Format Ideas
This is a sales performance ppt powerpoint presentation pictures format ideas. This is a six stage process. The stages in this process are quarterly sales review, sales by region, sales performance dashboard, sales revenue by product.

Sales Performance Ppt PowerPoint Presentation Portfolio Show
This is a sales performance ppt powerpoint presentation portfolio show. This is a six stage process. The stages in this process are sales performance dashboard, sales by region, sales revenue by product, quarterly sales review, sales budget vs actuals.
Employee Count Reporting And Tracking Roadmap Download Pdf
The following slide showcases reporting and tracking roadmap to help organizations understand workforce dynamics and engage in strategic planning. It covers activities undertaken quarterly employee classification, data management, clarity in objectives and dashboard Showcasing this set of slides titled Employee Count Reporting And Tracking Roadmap Download Pdf. The topics addressed in these templates are Employee Classification, Data Management, Clarify Objectives. All the content presented in this PPT design is completely editable. Download it and make adjustments in color, background, font etc. as per your unique business setting.
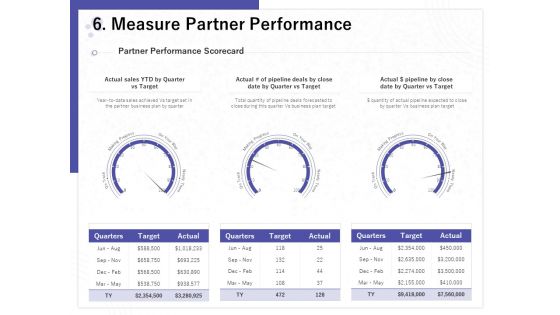
Determining Internalization Externalization Vendors Measure Partner Performance Ideas PDF
Presenting this set of slides with name determining internalization externalization vendors measure partner performance ideas pdf. This is a three stage process. The stages in this process are quarters, actual, target. This is a completely editable PowerPoint presentation and is available for immediate download. Download now and impress your audience.
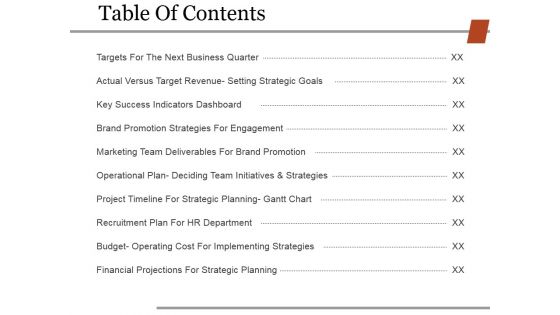
Table Of Contents Template 1 Ppt PowerPoint Presentation Infographic Template Gridlines
This is a table of contents template 1 ppt powerpoint presentation infographic template gridlines. This is a ten stage process. The stages in this process are targets for the next business quarter, actual versus target revenue setting strategic goals, key success indicators dashboard.

Sales Performance Ppt PowerPoint Presentation Summary Influencers
This is a sales performance ppt powerpoint presentation summary influencers. This is a six stage process. The stages in this process are sales performance dashboard, sales by region, sales revenue by product, sales kpi performance matrix, quarterly sales review.

Sales Performance Ppt PowerPoint Presentation Infographics Visuals
This is a sales performance ppt powerpoint presentation infographics visuals. This is a six stage process. The stages in this process are sales by region, sales revenue by product, sales kpi performance matrix, quarterly sales review, sales budget vs actuals.
Employee Performance Improvement Framework Determine Employee Performance Tracker Infographics PDF
This slide provides information about employee performance tracker dashboard which covers details in context to employee training, etc. Deliver an awe inspiring pitch with this creative employee performance improvement framework determine employee performance tracker infographics pdf bundle. Topics like outstanding, needs improvement sufficient, strong, current quarterly review can be discussed with this completely editable template. It is available for immediate download depending on the needs and requirements of the user.
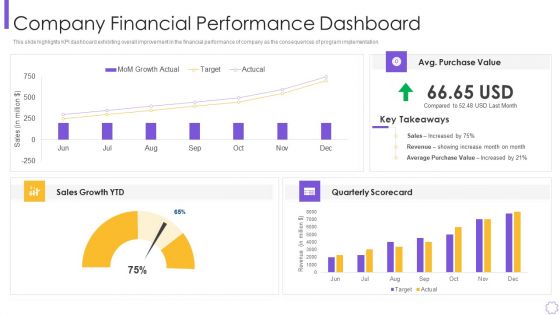
Process Optimization Through Product Life Process Management Techniques Company Brochure PDF
This slide highlights KPI dashboard exhibiting overall improvement in the financial performance of company as the consequences of program implementation. Deliver and pitch your topic in the best possible manner with this process optimization through product life process management techniques company brochure pdf Use them to share invaluable insights on showing increase, average purchase value, quarterly scorecard and impress your audience. This template can be altered and modified as per your expectations. So, grab it now.
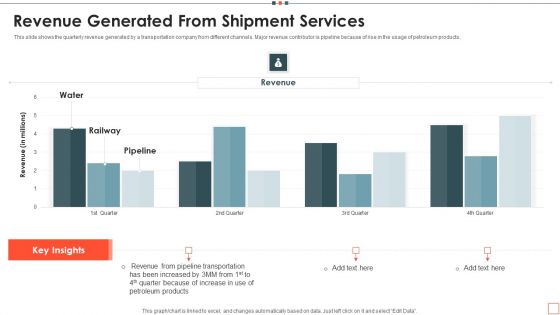
Revenue Generated From Shipment Services Topics PDF
This slide shows the quarterly revenue generated by a transportation company from different channels. Major revenue contributor is pipeline because of rise in the usage of petroleum products. Pitch your topic with ease and precision using this Shipment Services Company Monthly Dashboard Designs PDF. This layout presents information on Revenue Generated From Shipment Services. It is also available for immediate download and adjustment. So, changes can be made in the color, design, graphics or any other component to create a unique layout.
Organizations Yearly Marketing Operations Plan Icons PDF
The slide showcases an organizations yearly marketing operations plan. It covers activities, key initiatives, owners, KPIs and quarterly timeline. Showcasing this set of slides titled Organizations Yearly Marketing Operations Plan Icons PDF. The topics addressed in these templates are Sales And Operations Planning, Media Operations, Quarterly Advertising Campaign. All the content presented in this PPT design is completely editable. Download it and make adjustments in color, background, font etc. as per your unique business setting.

Financial Statement Ppt PowerPoint Presentation Outline File Formats
This is a financial statement ppt powerpoint presentation outline file formats. This is a five stage process. The stages in this process are trends of sales cycle times, quarter over quarter revenue growth, revenue trends, deal drop off by stage.
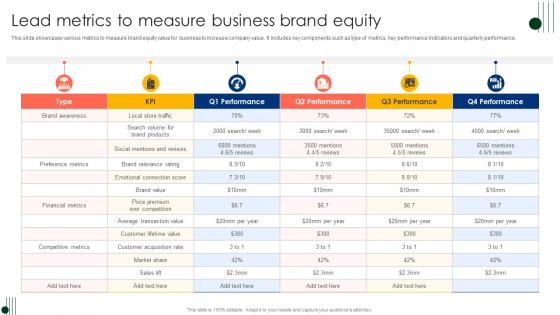
Lead Metrics To Measure Business Brand Equity Ppt Inspiration Model Pdf
This slide showcases various metrics to measure brand equity value for business to increase company value. It includes key components such as type of metrics, key performance indicators and quarterly performance. Showcasing this set of slides titled Lead Metrics To Measure Business Brand Equity Ppt Inspiration Model Pdf. The topics addressed in these templates are Key Performance Indicators, Quarterly Performance, KPI. All the content presented in this PPT design is completely editable. Download it and make adjustments in color, background, font etc. as per your unique business setting.
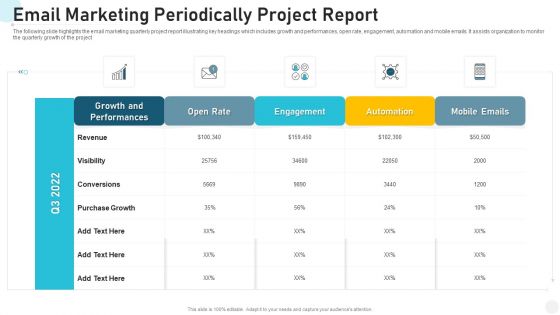
Email Marketing Periodically Project Report Structure PDF
The following slide highlights the email marketing quarterly project report illustrating key headings which includes growth and performances, open rate, engagement, automation and mobile emails. It assists organization to monitor the quarterly growth of the project Showcasing this set of slides titled email marketing periodically project report structure pdf. The topics addressed in these templates are email marketing periodically project report. All the content presented in this PPT design is completely editable. Download it and make adjustments in color, background, font etc. as per your unique business setting.
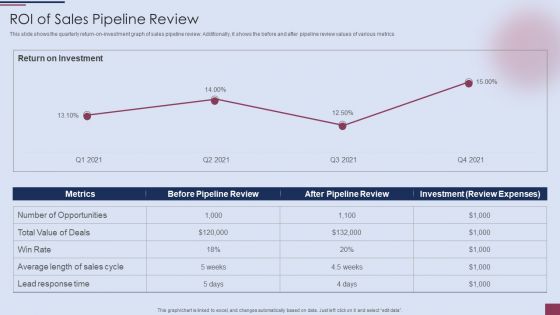
Sales Process Management To Boost Business Effectiveness ROI Of Sales Pipeline Review Rules PDF
This slide shows the quarterly return-on-investment graph of sales pipeline review. Additionally, it shows the before and after pipeline review values of various metrics.Deliver an awe inspiring pitch with this creative Sales Process Management To Boost Business Effectiveness ROI Of Sales Pipeline Review Rules PDF bundle. Topics like Logging All Interactions, Missing Information, Creating Dashboards can be discussed with this completely editable template. It is available for immediate download depending on the needs and requirements of the user.

Financial Summary Ppt PowerPoint Presentation Information
This is a financial summary ppt powerpoint presentation information. This is a two stage process. The stages in this process are revenue and gross profit, quarterly revenue split, revenue spilt by geography, revenue split by product mix, revenue split by segment sector.
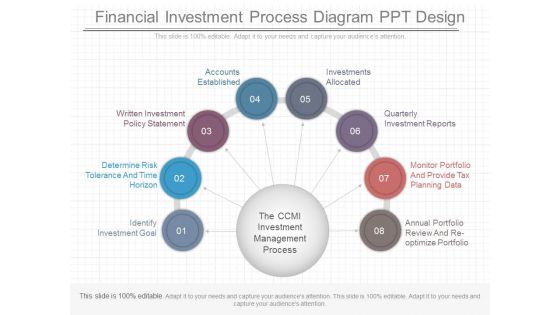
Financial Investment Process Diagram Ppt Design
This is a financial investment process diagram ppt design. This is a eight stage process. The stages in this process are identify investment goal, determine risk tolerance and time horizon, written investment policy statement, accounts established, investments allocated, quarterly investment reports, monitor portfolio and provide tax planning data, annual portfolio review and re optimize portfolio.

Monthly Staff Attrition Report Ppt PowerPoint Presentation Professional Display PDF
Presenting this set of slides with name monthly staff attrition report ppt powerpoint presentation professional display pdf. The topics discussed in these slides are opening count, new joinees, resignee, closing count, attrition percent, quarterly attrition. This is a completely editable PowerPoint presentation and is available for immediate download. Download now and impress your audience.
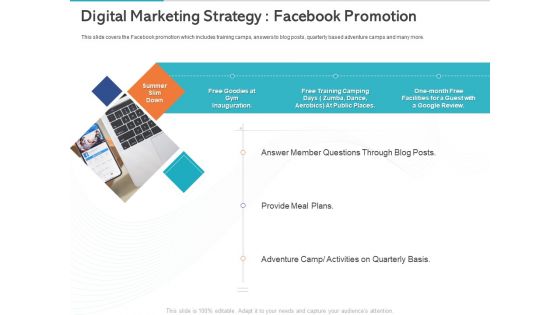
Gym Health And Fitness Market Industry Report Digital Marketing Strategy Facebook Promotion Information PDF
Presenting this set of slides with name gym health and fitness market industry report digital marketing strategy facebook promotion information pdf. This is a one stage process. The stages in this process are summer slim down, blog posts, provide meal plans, quarterly basis. This is a completely editable PowerPoint presentation and is available for immediate download. Download now and impress your audience.

Overview Of Periodic Financial Indicators Performance Designs PDF
This slide presents the result variance of different key financials between two quarters of a organization. It includes revenue, gross margin, operating profit, operating margin quarterly performance variation. Showcasing this set of slides titled Overview Of Periodic Financial Indicators Performance Designs PDF. The topics addressed in these templates are Overview Of Periodic, Financial Indicators Performance. All the content presented in this PPT design is completely editable. Download it and make adjustments in color, background, font etc. as per your unique business setting.
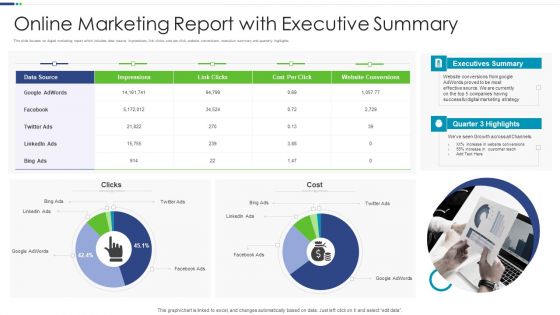
Online Marketing Report With Executive Summary Designs PDF
This slide focuses on digital marketing report which includes data source, impressions, link clicks, cost per click, website conversions, executive summary and quarterly highlights.Pitch your topic with ease and precision using this Online Marketing Report With Executive Summary Designs PDF This layout presents information on Executives Summary, Digital Marketing, Conversions It is also available for immediate download and adjustment. So, changes can be made in the color, design, graphics or any other component to create a unique layout.

Adjusting Financial Strategies And Planning Measuring Business Earnings With Profitability Ratios Download PDF
This slide provides glimpse about profitability ratio analysis for calculating our firms business earnings and net profit margin. It includes quarterly gross profit margin, quarterly net profit margin, key insights, etc. The Adjusting Financial Strategies And Planning Measuring Business Earnings With Profitability Ratios Download PDF is a compilation of the most recent design trends as a series of slides. It is suitable for any subject or industry presentation, containing attractive visuals and photo spots for businesses to clearly express their messages. This template contains a variety of slides for the user to input data, such as structures to contrast two elements, bullet points, and slides for written information. Slidegeeks is prepared to create an impression.
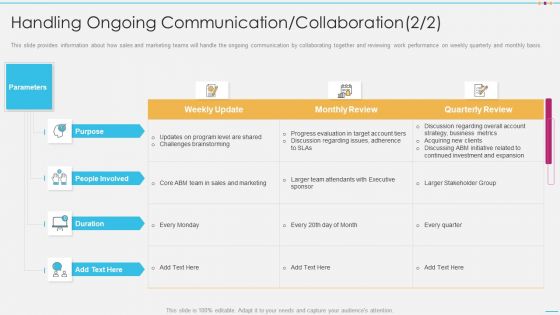
Handling Ongoing Communication Collaboration Infographics PDF
This slide provides information about how sales and marketing teams will handle the ongoing communication by collaborating together and reviewing work performance on weekly quarterly and monthly basis. Deliver an awe inspiring pitch with this creative handling ongoing communication collaboration infographics pdf bundle. Topics like progress evaluation, target account, metrics, business, strategy can be discussed with this completely editable template. It is available for immediate download depending on the needs and requirements of the user.
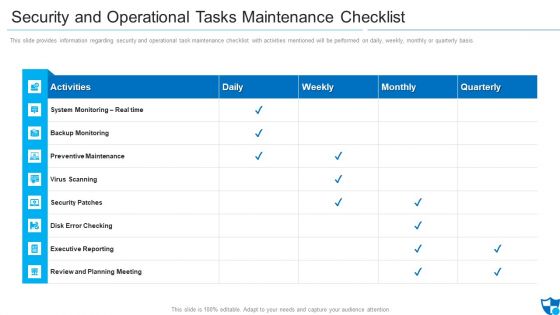
Security And Operational Tasks Maintenance Checklist Infographics PDF
This slide provides information regarding security and operational task maintenance checklist with activities mentioned will be performed on daily, weekly, monthly or quarterly basis.Deliver an awe inspiring pitch with this creative security and operational tasks maintenance checklist infographics pdf bundle. Topics like preventive maintenance, security patches, review and planning meeting can be discussed with this completely editable template. It is available for immediate download depending on the needs and requirements of the user.
Business Performance Review Report Highlighting Results Of Marketing Campaign Icons PDF
The following slide highlights a quarterly business review QBR report which can be used by the manager to review marketing campaign results. The QBR report covers information about strategic objectives, KPIs, target and result in various quarters. Pitch your topic with ease and precision using this Business Performance Review Report Highlighting Results Of Marketing Campaign Icons PDF. This layout presents information on Strategic Objectives, Engage Community, Increase Revenue. It is also available for immediate download and adjustment. So, changes can be made in the color, design, graphics or any other component to create a unique layout.

Business Performance Review Report To Evaluate Performance Of Sales Rep Infographics PDF
The following slide highlights quarterly business review QBR report which can be used by firm to evaluate the efficiency of sales rep. information covered in this slide is related to total sales by employees in different quarters, number of calls made. Pitch your topic with ease and precision using this Business Performance Review Report To Evaluate Performance Of Sales Rep Infographics PDF. This layout presents information on Revenue Sales, Tim Paine, Number Colds Calls. It is also available for immediate download and adjustment. So, changes can be made in the color, design, graphics or any other component to create a unique layout.

Activity Sheet For Sales Performance Monitoring Forecasts Ppt Infographic Template Information PDF
This slide illustrates working process of leads tracking system. It contains information about lead capture, qualification, scoring, distribution and sales tracking. Presenting Activity Sheet For Sales Performance Monitoring Forecasts Ppt Infographic Template Information PDF to dispense important information. This template comprises two stages. It also presents valuable insights into the topics including Quarter One, Quarter Two, Deal Size. This is a completely customizable PowerPoint theme that can be put to use immediately. So, download it and address the topic impactfully.
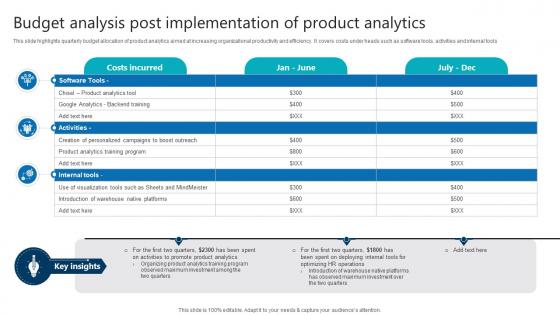
Budget Analysis Post Implementation Of Product Analytics Product Analytics Implementation Data Analytics V
This slide highlights quarterly budget allocation of product analytics aimed at increasing organizational productivity and efficiency. It covers costs under heads such as software tools, activities and internal tools From laying roadmaps to briefing everything in detail, our templates are perfect for you. You can set the stage with your presentation slides. All you have to do is download these easy-to-edit and customizable templates. Budget Analysis Post Implementation Of Product Analytics Product Analytics Implementation Data Analytics V will help you deliver an outstanding performance that everyone would remember and praise you for. Do download this presentation today.
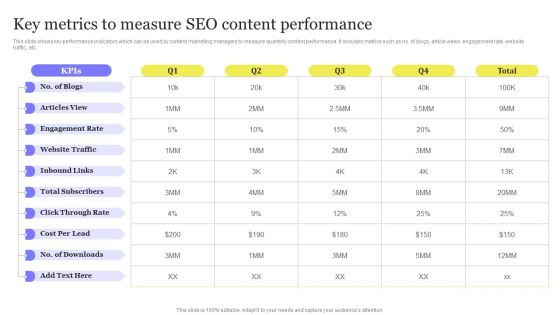
Enhancing Digital Visibility Using SEO Content Strategy Key Metrics To Measure SEO Content Performance Guidelines PDF
This slide shows key performance indicators which can be used by content marketing managers to measure quarterly content performance. It includes metrics such as no. of blogs, article views, engagement rate, website traffic, etc. Make sure to capture your audiences attention in your business displays with our gratis customizable Enhancing Digital Visibility Using SEO Content Strategy Key Metrics To Measure SEO Content Performance Guidelines PDF. These are great for business strategies, office conferences, capital raising or task suggestions. If you desire to acquire more customers for your tech business and ensure they stay satisfied, create your own sales presentation with these plain slides.

Yearly Sales Assessment With Key Performance Indicator Matrix Introduction PDF
This slide covers quarterly product units sold through out a financial year in an organization with growth in revenue, profit and number of customer from previous years sales. It includes product sold and growth rate. Presenting Yearly Sales Assessment With Key Performance Indicator Matrix Introduction PDF to dispense important information. This template comprises four stages. It also presents valuable insights into the topics including Sold Growth Rate, Customers, Growth In Profit. This is a completely customizable PowerPoint theme that can be put to use immediately. So, download it and address the topic impactfully.
Digital Sales Metrics Showing Enhancement Icons PDF
The following slide represents statistics of online sales key performance indicators KPIs which can assist marketing manager to review their performance and take necessary steps. It include different metrics such as add to cart rate, conversion rate, and revenue per session. Showcasing this set of slides titled Digital Sales Metrics Showing Enhancement Icons PDF. The topics addressed in these templates are Quarterly Online Sales Metrics, Targeted Right Customers, Offered Product Recommendations. All the content presented in this PPT design is completely editable. Download it and make adjustments in color, background, font etc. as per your unique business setting.
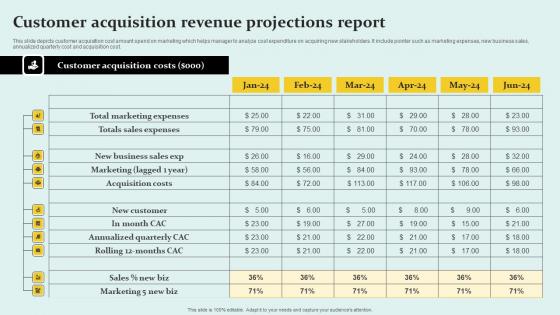
Customer Acquisition Revenue Projections Report Professional Pdf
This slide depicts customer acquisition cost amount spend on marketing which helps manager to analyze cost expenditure on acquiring new stakeholders. It include pointer such as marketing expenses, new business sales, annualized quarterly cost and acquisition cost. Pitch your topic with ease and precision using this Customer Acquisition Revenue Projections Report Professional Pdf This layout presents information on Marketing Expenses, Sales Expenses, Business Sales It is also available for immediate download and adjustment. So, changes can be made in the color, design, graphics or any other component to create a unique layout.
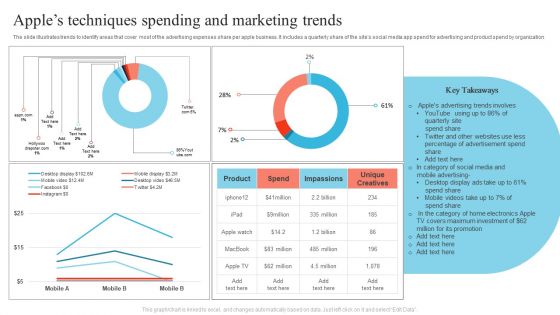
Apples Techniques Spending And Marketing Trends Mockup PDF
The slide illustrates trends to identify areas that cover most of the advertising expenses share per apple business. It includes a quarterly share of the sites social media app spend for advertising and product spend by organization. Showcasing this set of slides titled Apples Techniques Spending And Marketing Trends Mockup PDF. The topics addressed in these templates are Desktop Display, Mobile Videos, Advertisement Spend Share. All the content presented in this PPT design is completely editable. Download it and make adjustments in color, background, font etc. as per your unique business setting.
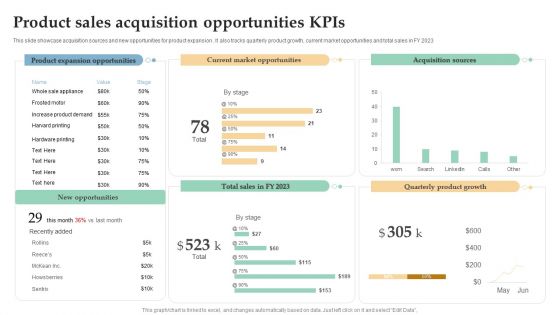
Product Sales Acquisition Opportunities Kpis Ppt Pictures Slide PDF
This slide showcase acquisition sources and new opportunities for product expansion . It also tracks quarterly product growth, current market opportunities and total sales in FY 2023. Pitch your topic with ease and precision using this Product Sales Acquisition Opportunities Kpis Ppt Pictures Slide PDF. This layout presents information on Product Expansion Opportunities, Current Market Opportunities, Acquisition Sources. It is also available for immediate download and adjustment. So, changes can be made in the color, design, graphics or any other component to create a unique layout.

 Home
Home