Financial Quarter Dashboard
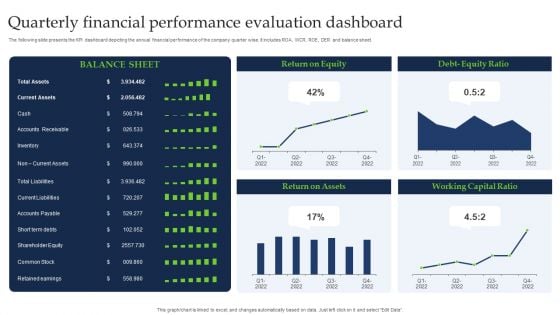
Quarterly Financial Performance Evaluation Dashboard Guidelines PDF
The following slide presents the KPI dashboard depicting the annual financial performance of the company quarter wise. It includes ROA, WCR, ROE, DER and balance sheet. Pitch your topic with ease and precision using this Quarterly Financial Performance Evaluation Dashboard Guidelines PDF. This layout presents information on Current Assets, Shareholder Equity, Common Stock. It is also available for immediate download and adjustment. So, changes can be made in the color, design, graphics or any other component to create a unique layout.

Quarterly Financial Performance Dashboard By Power BI Ppt Sample SS
This slide represents the pyramid showing the asset performance management. It includes details related to APM-centric, predictive, condition-based, preventive and reactive maintenance. Find a pre-designed and impeccable Quarterly Financial Performance Dashboard By Power BI Ppt Sample SS The templates can ace your presentation without additional effort. You can download these easy-to-edit presentation templates to make your presentation stand out from others. So, what are you waiting for Download the template from Slidegeeks today and give a unique touch to your presentation.

Annual Business Financial Summary Dashboard Themes PDF
This slide shows annual financial report dashboard of company to monitor yearly business performance. It includes various indicators such as revenue, net profits, costs and breakdown of cost. Showcasing this set of slides titled Annual Business Financial Summary Dashboard Themes PDF. The topics addressed in these templates are Revenue, Costs, Net Profit. All the content presented in this PPT design is completely editable. Download it and make adjustments in color, background, font etc. as per your unique business setting.
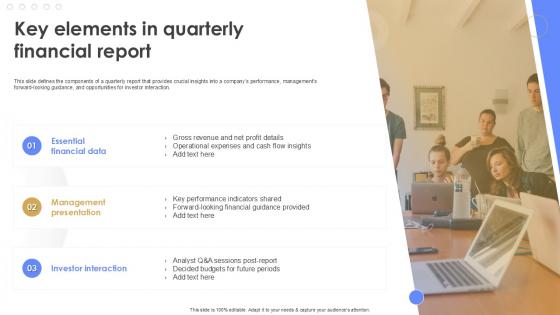
Key Elements In Quarterly Financial Report Quarterly Report Ppt Sample
This slide defines the components of a quarterly report that provides crucial insights into a companys performance, managements forward-looking guidance, and opportunities for investor interaction. Create an editable Key Elements In Quarterly Financial Report Quarterly Report Ppt Sample that communicates your idea and engages your audience. Whether you are presenting a business or an educational presentation, pre-designed presentation templates help save time. Key Elements In Quarterly Financial Report Quarterly Report Ppt Sample is highly customizable and very easy to edit, covering many different styles from creative to business presentations. Slidegeeks has creative team members who have crafted amazing templates. So, go and get them without any delay.
Annual Financial Data Insights Dashboard Icon Introduction PDF
Showcasing this set of slides titled Annual Financial Data Insights Dashboard Icon Introduction PDF. The topics addressed in these templates are Annual Financial, Data Insights, Dashboard. All the content presented in this PPT design is completely editable. Download it and make adjustments in color, background, font etc. as per your unique business setting.
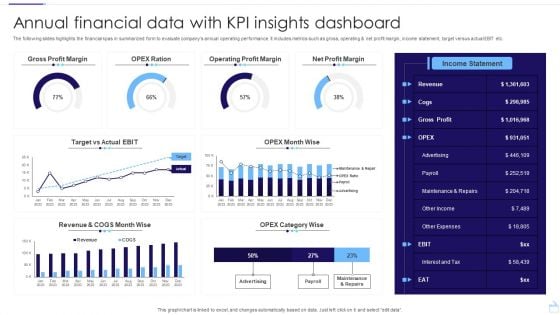
Annual Financial Data With KPI Insights Dashboard Structure PDF
The following slides highlights the financial kpas in summarized form to evaluate companys annual operating performance. It includes metrics such as gross, operating and net profit margin, income statement, target versus actual EBIT etc. Pitch your topic with ease and precision using this Annual Financial Data With KPI Insights Dashboard Structure PDF. This layout presents information on Gross Profit Margin, Operating Profit Margin, Net Profit Margin. It is also available for immediate download and adjustment. So, changes can be made in the color, design, graphics or any other component to create a unique layout.
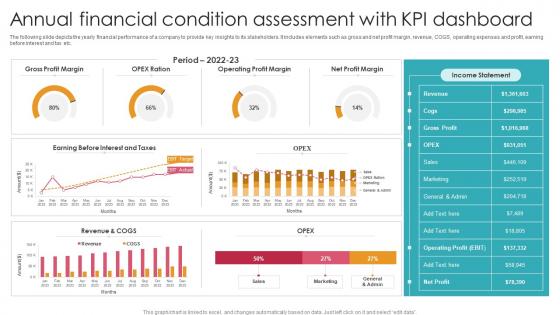
Annual Financial Condition Assessment With KPI Dashboard Ideas Pdf
The following slide depicts the yearly financial performance of a company to provide key insights to its stakeholders. It includes elements such as gross and net profit margin, revenue, COGS, operating expenses and profit, earning before interest and tax etc. Showcasing this set of slides titled Annual Financial Condition Assessment With KPI Dashboard Ideas Pdf. The topics addressed in these templates are Gross Profit Margin, Operating Profit Margin, Net Profit Margin. All the content presented in this PPT design is completely editable. Download it and make adjustments in color, background, font etc. as per your unique business setting.
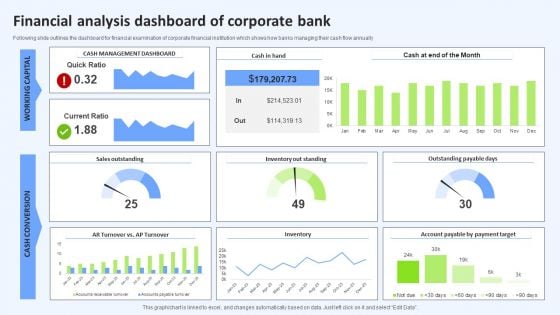
Financial Analysis Dashboard Of Corporate Bank Mockup PDF
Following slide outlines the dashboard for financial examination of corporate financial institution which shows how banks managing their cash flow annually Pitch your topic with ease and precision using this Financial Analysis Dashboard Of Corporate Bank Mockup PDF. This layout presents information on Month, Current Ratio, Inventory. It is also available for immediate download and adjustment. So, changes can be made in the color, design, graphics or any other component to create a unique layout.
KPI Dashboard For Tracking Financial Management Challenges Download PDF
Following slide demonstrates KPI dashboard for monitoring business cash flow management pain points to improve organisation financial performance. It includes elements such as quick ratio, current ration, annual cash balance, monthly cash balance, accounts receivable and payables, etc. Showcasing this set of slides titled KPI Dashboard For Tracking Financial Management Challenges Download PDF. The topics addressed in these templates are Monthly Cash Flow, Account Payable By Days, Annual Revenue, Annual Cost, Annual Net Profits. All the content presented in this PPT design is completely editable. Download it and make adjustments in color, background, font etc. as per your unique business setting.
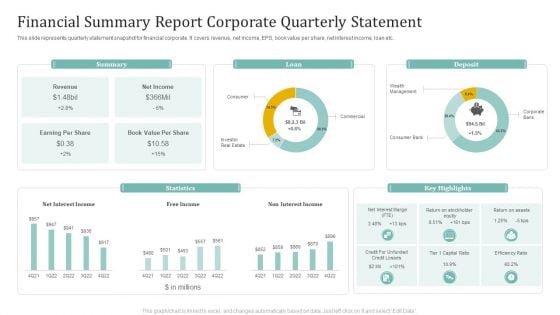
Financial Summary Report Corporate Quarterly Statement Ppt Slides Ideas PDF
This slide represents quarterly statement snapshot for financial corporate. It covers revenue, net income, EPS, book value per share, net interest income, loan etc. Showcasing this set of slides titled Financial Summary Report Corporate Quarterly Statement Ppt Slides Ideas PDF. The topics addressed in these templates are Summary, Loan, Deposit, Statistics. All the content presented in this PPT design is completely editable. Download it and make adjustments in color, background, font etc. as per your unique business setting.
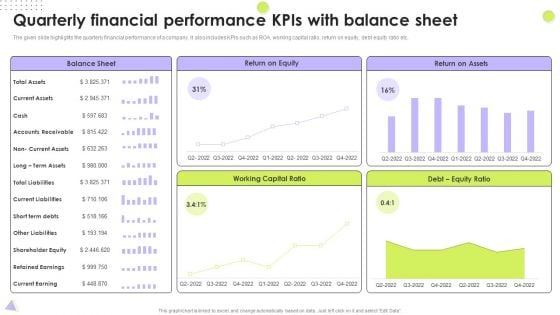
Quarterly Financial Performance Kpis With Balance Sheet Designs PDF
The given slide highlights the quarterly financial performance of a company. It also includes KPIs such as ROA, working capital ratio, return on equity, debt equity ratio etc. Pitch your topic with ease and precision using this Quarterly Financial Performance Kpis With Balance Sheet Designs PDF. This layout presents information on Total Liabilities, Return On Equity, Working Capital Ratio. It is also available for immediate download and adjustment. So, changes can be made in the color, design, graphics or any other component to create a unique layout.
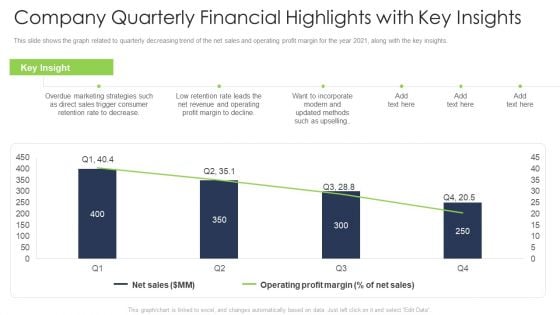
Company Quarterly Financial Highlights With Key Insights Information PDF
This slide shows the graph related to quarterly decreasing trend of the net sales and operating profit margin for the year 2021, along with the key insights. Deliver and pitch your topic in the best possible manner with this company quarterly financial highlights with key insights information pdf. Use them to share invaluable insights on strategies, sales, marketing, revenue, operating profit, methods and impress your audience. This template can be altered and modified as per your expectations. So, grab it now.
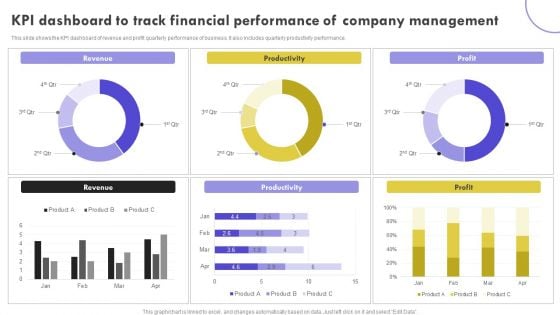
KPI Dashboard To Track Financial Performance Of Company Management Clipart PDF
This slide shows the KPI dashboard of revenue and profit quarterly performance of business. It also includes quarterly productivity performance. Pitch your topic with ease and precision using this KPI Dashboard To Track Financial Performance Of Company Management Clipart PDF. This layout presents information on Revenue, Productivity, Profit. It is also available for immediate download and adjustment. So, changes can be made in the color, design, graphics or any other component to create a unique layout.
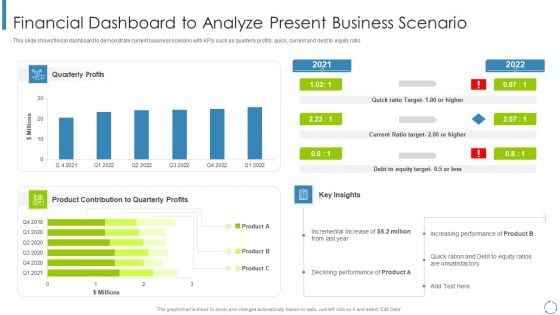
Internal And External Business Environment Analysis Financial Dashboard To Analyze Present Business Scenario Topics PDF
This slide shows finical dashboard to demonstrate current business scenario with KPIs such as quarterly profits, quick, current and debt to equity ratio Deliver and pitch your topic in the best possible manner with this internal and external business environment analysis financial dashboard to analyze present business scenario topics pdf Use them to share invaluable insights on product contribution to quarterly, incremental increase, declining performance and impress your audience. This template can be altered and modified as per your expectations. So, grab it now.
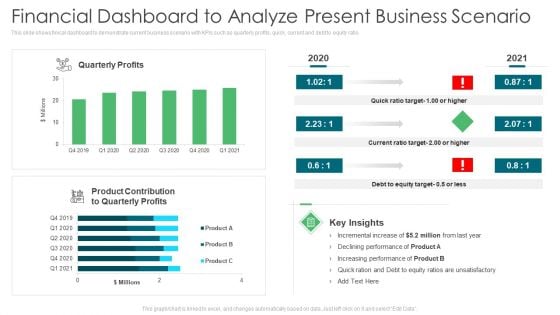
Environmental Assessment Financial Dashboard To Analyze Present Business Scenario Ppt Infographics Ideas PDF
This slide shows finical dashboard to demonstrate current business scenario with KPIs such as quarterly profits, quick, current and debt to equity ratio. Deliver an awe inspiring pitch with this creative environmental assessment financial dashboard to analyze present business scenario ppt infographics ideas pdf bundle. Topics like product contribution, increasing performance, equity target can be discussed with this completely editable template. It is available for immediate download depending on the needs and requirements of the user.
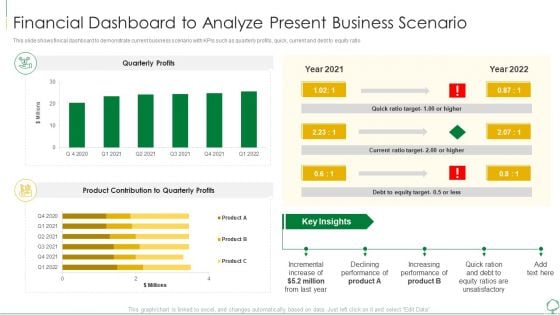
Environmental Examination Tools And Approaches Financial Dashboard To Analyze Sample PDF
This slide shows finical dashboard to demonstrate current business scenario with KPIs such as quarterly profits, quick, current and debt to equity ratio. Deliver and pitch your topic in the best possible manner with this environmental examination tools and approaches financial dashboard to analyze sample pdf. Use them to share invaluable insights on performance, product, equity and impress your audience. This template can be altered and modified as per your expectations. So, grab it now.
Icon For Annual Financial Performance Dashboard For Capital Fund Raising Ppt Layouts Layout PDF
Presenting Icon For Annual Financial Performance Dashboard For Capital Fund Raising Ppt Layouts Layout PDF to dispense important information. This template comprises three stages. It also presents valuable insights into the topics including Icon, Annual Financial ,Performance Dashboard, Capital Fund Raising. This is a completely customizable PowerPoint theme that can be put to use immediately. So, download it and address the topic impactfully.
Annual Financial Performance Administration Dashboard With Key Metrics Ppt PowerPoint Presentation Icon Visual Aids PDF
Showcasing this set of slides titled Annual Financial Performance Administration Dashboard With Key Metrics Ppt PowerPoint Presentation Icon Visual Aids PDF. The topics addressed in these templates are Accounts Receivable, Accounts Payable, Planned Profit Margin. All the content presented in this PPT design is completely editable. Download it and make adjustments in color, background, font etc. as per your unique business setting.
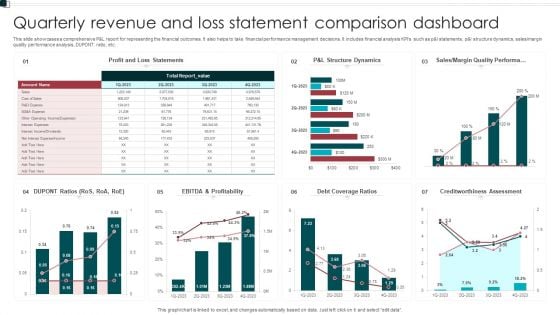
Quarterly Revenue And Loss Statement Comparison Dashboard Portrait PDF
This slide showcases a comprehensive P and L report for representing the financial outcomes. It also helps to take financial performance management decisions. It includes financial analysis KPIs such as p and l statements, p and l structure dynamics, sales or margin quality performance analysis, DUPONT ratio, etc. Showcasing this set of slides titled Quarterly Revenue And Loss Statement Comparison Dashboard Portrait PDF. The topics addressed in these templates are Profitability, Debt Coverage Ratios, Margin Quality Performa. All the content presented in this PPT design is completely editable. Download it and make adjustments in color, background, font etc. as per your unique business setting.
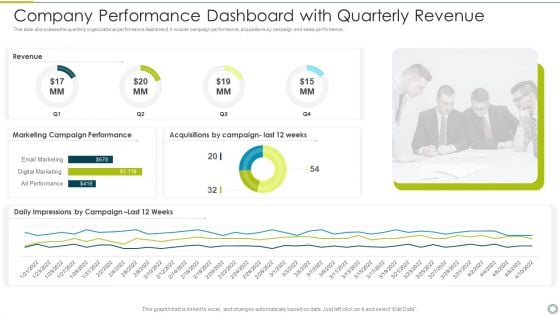
Company Performance Dashboard With Quarterly Revenue Download PDF
This slide showcases the quarterly organizational performance dashboard. It include campaign performance, acquisitions by campaign and sales performance. Showcasing this set of slides titled company performance dashboard with quarterly revenue download pdf. The topics addressed in these templates are marketing, performance. All the content presented in this PPT design is completely editable. Download it and make adjustments in color, background, font etc. as per your unique business setting.
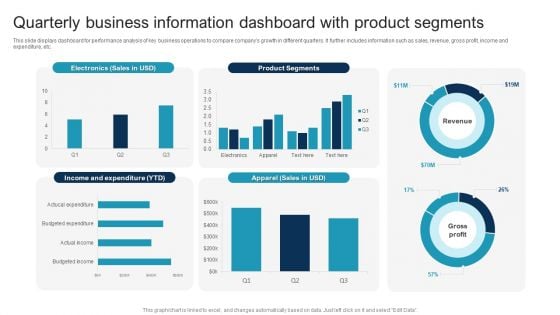
Quarterly Business Information Dashboard With Product Segments Slides PDF
This slide displays dashboard for performance analysis of key business operations to compare companys growth in different quarters. It further includes information such as sales, revenue, gross profit, income and expenditure, etc. Showcasing this set of slides titled Quarterly Business Information Dashboard With Product Segments Slides PDF. The topics addressed in these templates are Quarterly Business Information, Dashboard With Product Segments. All the content presented in this PPT design is completely editable. Download it and make adjustments in color, background, font etc. as per your unique business setting.
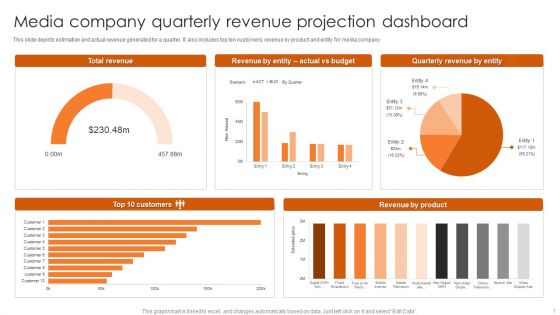
Media Company Quarterly Revenue Projection Dashboard Mockup PDF
This slide depicts estimation and actual revenue generated for a quarter. It also includes top ten customers, revenue by product and entity for media company. Pitch your topic with ease and precision using this Media Company Quarterly Revenue Projection Dashboard Mockup PDF. This layout presents information on Total Revenue, Quarterly Revenue Entity, Top 10 Customers. It is also available for immediate download and adjustment. So, changes can be made in the color, design, graphics or any other component to create a unique layout.
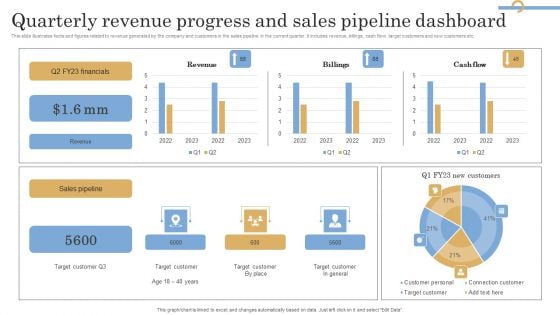
Quarterly Revenue Progress And Sales Pipeline Dashboard Information PDF
This slide illustrates facts and figures related to revenue generated by the company and customers in the sales pipeline in the current quarter. It includes revenue, billings, cash flow, target customers and new customers etc. Showcasing this set of slides titled Quarterly Revenue Progress And Sales Pipeline Dashboard Information PDF. The topics addressed in these templates are Financials, Revenue, Sales Pipeline. All the content presented in this PPT design is completely editable. Download it and make adjustments in color, background, font etc. as per your unique business setting.
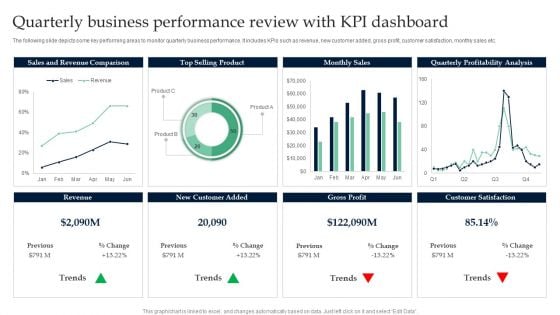
Quarterly Business Performance Review With KPI Dashboard Infographics PDF
Pitch your topic with ease and precision using this Quarterly Business Performance Review With KPI Dashboard Infographics PDF. This layout presents information on Sales And Revenue Comparison, Top Selling Product. It is also available for immediate download and adjustment. So, changes can be made in the color, design, graphics or any other component to create a unique layout.
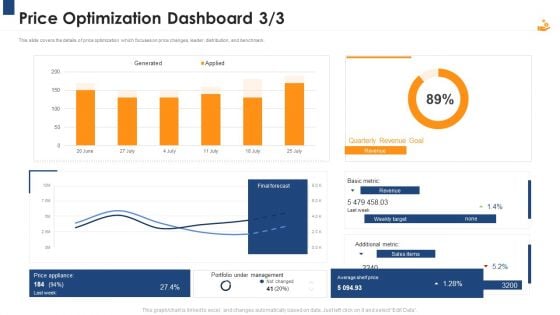
Income Management Tool Price Optimization Dashboard Quarterly Structure PDF
price changes, leader, distribution, and benchmark. Deliver and pitch your topic in the best possible manner with this income management tool price optimization dashboard quarterly structure pdf. Use them to share invaluable insights on revenue, target, sales, management, portfolio and impress your audience. This template can be altered and modified as per your expectations. So, grab it now.
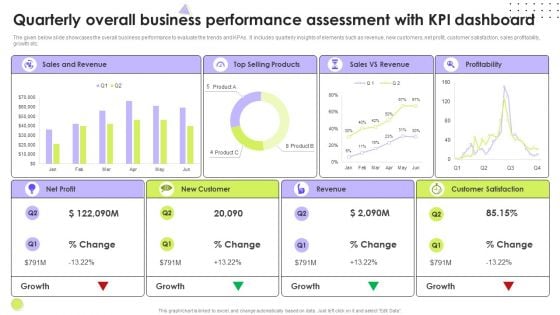
Quarterly Overall Business Performance Assessment With Kpi Dashboard Microsoft PDF
The given below slide showcases the overall business performance to evaluate the trends and KPAs. It includes quarterly insights of elements such as revenue, new customers, net profit, customer satisfaction, sales profitability, growth etc. Pitch your topic with ease and precision using this Quarterly Overall Business Performance Assessment With Kpi Dashboard Microsoft PDF. This layout presents information on Revenue, Customer Satisfaction, Net Profit. It is also available for immediate download and adjustment. So, changes can be made in the color, design, graphics or any other component to create a unique layout.
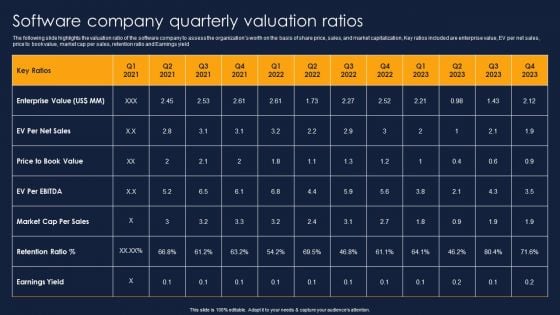
Software Company Quarterly Valuation Ratios Financial Performance Report Of Software Firm Demonstration PDF
The following slide highlights the valuation ratio of the software company to assess the organizations worth on the basis of share price, sales, and market capitalization, Key ratios included are enterprise value, EV per net sales, price to book value, market cap per sales, retention ratio and Earnings yield. Formulating a presentation can take up a lot of effort and time, so the content and message should always be the primary focus. The visuals of the PowerPoint can enhance the presenters message, so our Software Company Quarterly Valuation Ratios Financial Performance Report Of Software Firm Demonstration PDF was created to help save time. Instead of worrying about the design, the presenter can concentrate on the message while our designers work on creating the ideal templates for whatever situation is needed. Slidegeeks has experts for everything from amazing designs to valuable content, we have put everything into Software Company Quarterly Valuation Ratios Financial Performance Report Of Software Firm Demonstration PDF
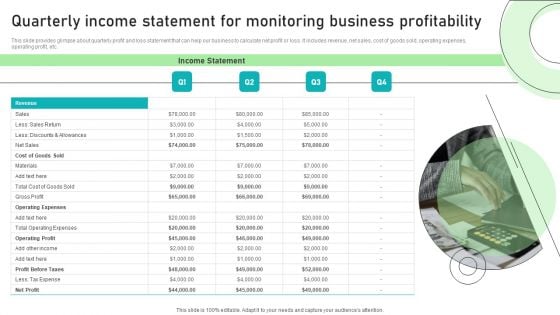
Adjusting Financial Strategies And Planning Quarterly Income Statement For Monitoring Business Profitability Infographics PDF
This slide provides glimpse about quarterly profit and loss statement that can help our business to calculate net profit or loss. It includes revenue, net sales, cost of goods sold, operating expenses, operating profit, etc. The Adjusting Financial Strategies And Planning Quarterly Income Statement For Monitoring Business Profitability Infographics PDF is a compilation of the most recent design trends as a series of slides. It is suitable for any subject or industry presentation, containing attractive visuals and photo spots for businesses to clearly express their messages. This template contains a variety of slides for the user to input data, such as structures to contrast two elements, bullet points, and slides for written information. Slidegeeks is prepared to create an impression.
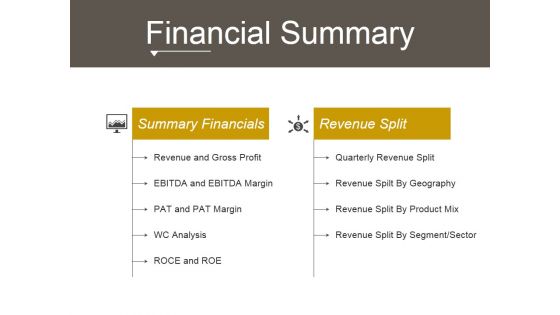
Financial Summary Ppt PowerPoint Presentation Information
This is a financial summary ppt powerpoint presentation information. This is a two stage process. The stages in this process are revenue and gross profit, quarterly revenue split, revenue spilt by geography, revenue split by product mix, revenue split by segment sector.
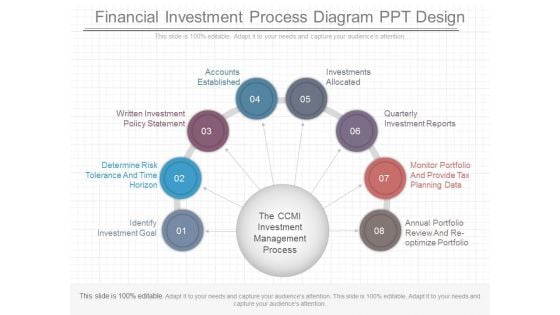
Financial Investment Process Diagram Ppt Design
This is a financial investment process diagram ppt design. This is a eight stage process. The stages in this process are identify investment goal, determine risk tolerance and time horizon, written investment policy statement, accounts established, investments allocated, quarterly investment reports, monitor portfolio and provide tax planning data, annual portfolio review and re optimize portfolio.
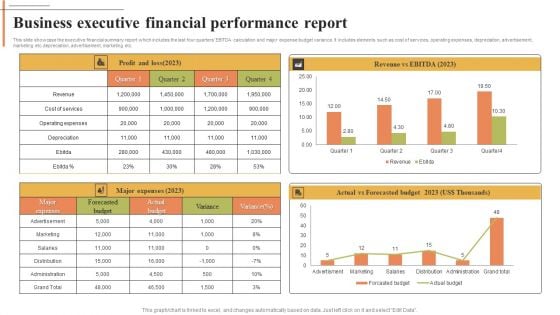
Business Executive Financial Performance Report Download PDF
This slide showcase the executive financial summary report which includes the last four quarters EBITDA calculation and major expense budget variance. It includes elements such as cost of services, operating expenses, depreciation, advertisement, marketing etc.depreciation, advertisement, marketing etc. Showcasing this set of slides titled Business Executive Financial Performance Report Download PDF. The topics addressed in these templates are Revenue, Cost Services, Operating Expenses. All the content presented in this PPT design is completely editable. Download it and make adjustments in color, background, font etc. as per your unique business setting.
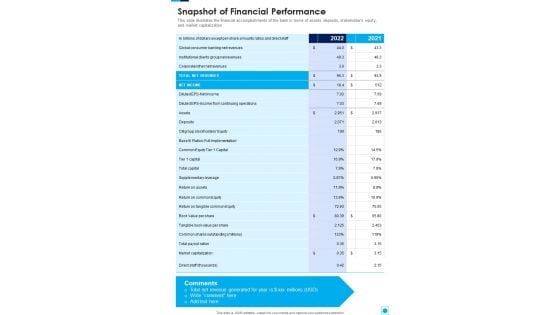
Snapshot Of Financial Performance One Pager Documents
This slide illustrates the financial accomplishments of the bank in terms of assets, deposits, stakeholders equity, and market capitalization. Presenting you a fantastic Snapshot Of Financial Performance One Pager Documents. This piece is crafted on hours of research and professional design efforts to ensure you have the best resource. It is completely editable and its design allow you to rehash its elements to suit your needs. Get this Snapshot Of Financial Performance One Pager Documents A4 One-pager now.
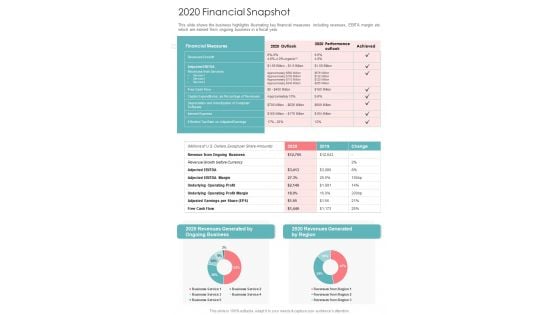
2020 Financial Snapshot One Pager Documents
This slide shows the business highlights illustrating key financial measures including revenues, EBITA margin etc. which are earned from ongoing business in a fiscal year. Presenting you a fantastic 2020 Financial Snapshot One Pager Documents. This piece is crafted on hours of research and professional design efforts to ensure you have the best resource. It is completely editable and its design allow you to rehash its elements to suit your needs. Get this 2020 Financial Snapshot One Pager Documents A4 One-pager now.
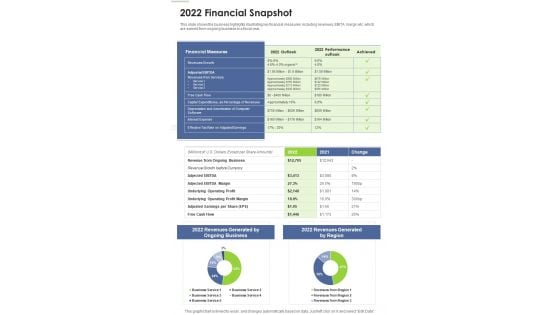
2022 Financial Snapshot One Pager Documents
This slide shows the business highlights illustrating key financial measures including revenues, EBITA margin etc. which are earned from ongoing business in a fiscal year.Presenting you a fantastic 2022 Financial Snapshot One Pager Documents. This piece is crafted on hours of research and professional design efforts to ensure you have the best resource. It is completely editable and its design allow you to rehash its elements to suit your needs. Get this 2022 Financial Snapshot One Pager Documents A4 One-pager now.
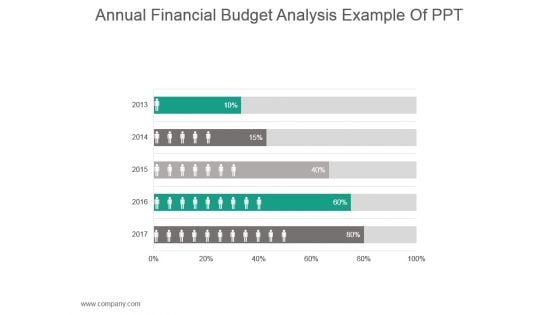
Annual Financial Budget Analysis Example Of Ppt
This is a annual financial budget analysis example of ppt. This is a five stage process. The stages in this process are business, strategy, finance, planning, compare.
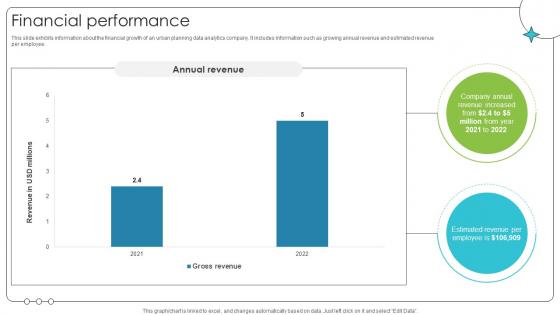
Financial Performance Investor Oriented Urbanlogiq Fundraising Deck
This slide exhibits information about the financial growth of an urban planning data analytics company. It includes information such as growing annual revenue and estimated revenue per employee. Present like a pro with Financial Performance Investor Oriented Urbanlogiq Fundraising Deck. Create beautiful presentations together with your team, using our easy-to-use presentation slides. Share your ideas in real-time and make changes on the fly by downloading our templates. So whether you are in the office, on the go, or in a remote location, you can stay in sync with your team and present your ideas with confidence. With Slidegeeks presentation got a whole lot easier. Grab these presentations today.
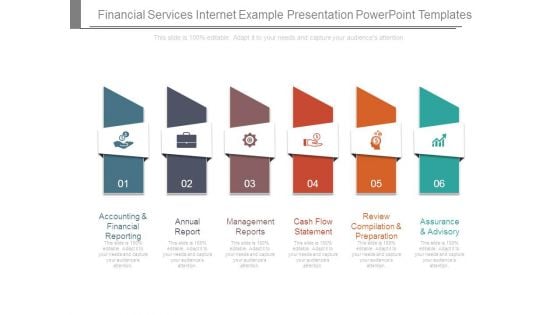
Financial Services Internet Example Presentation Powerpoint Templates
This is a financial services internet example presentation powerpoint templates. This is a six stage process. The stages in this process are accounting and financial reporting, annual report, management reports, cash flow statement, review compilation and preparation, assurance and advisory.
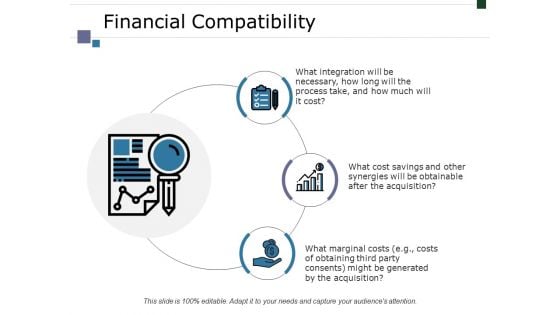
Financial Compatibility Ppt PowerPoint Presentation Portfolio Template
This is a financial compatibility ppt powerpoint presentation portfolio template. This is a three stage process. The stages in this process are business, marketing, icons, strategy, management.

Annual Financial Planning Cycle Diagram Ppt Summary
This is a annual financial planning cycle diagram ppt summary. This is a six stage process. The stages in this process are annual report, risk management, strategy objectives, budget, strategy invectives, evaluate alternatives.
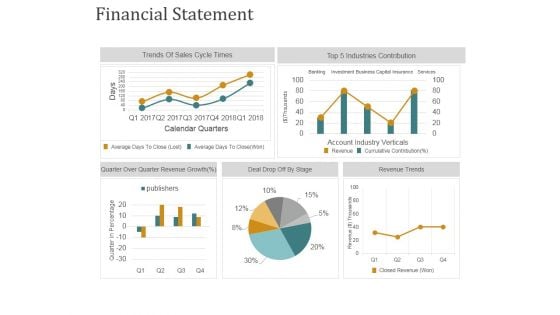
Financial Statement Ppt PowerPoint Presentation Outline File Formats
This is a financial statement ppt powerpoint presentation outline file formats. This is a five stage process. The stages in this process are trends of sales cycle times, quarter over quarter revenue growth, revenue trends, deal drop off by stage.
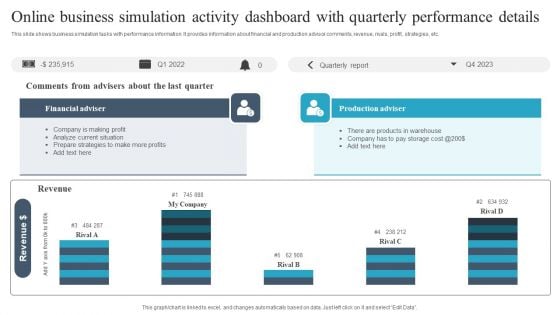
Online Business Simulation Activity Dashboard With Quarterly Performance Details Guidelines PDF
This slide shows business simulation tasks with performance information. It provides information about financial and production advisor comments, revenue, rivals, profit, strategies, etc. Pitch your topic with ease and precision using this Online Business Simulation Activity Dashboard With Quarterly Performance Details Guidelines PDF. This layout presents information on Financial Adviser, Production Adviser, Revenue. It is also available for immediate download and adjustment. So, changes can be made in the color, design, graphics or any other component to create a unique layout.
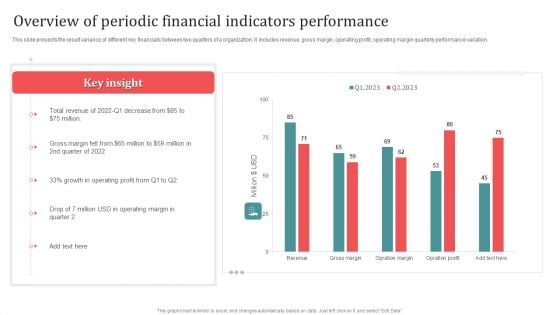
Overview Of Periodic Financial Indicators Performance Designs PDF
This slide presents the result variance of different key financials between two quarters of a organization. It includes revenue, gross margin, operating profit, operating margin quarterly performance variation. Showcasing this set of slides titled Overview Of Periodic Financial Indicators Performance Designs PDF. The topics addressed in these templates are Overview Of Periodic, Financial Indicators Performance. All the content presented in this PPT design is completely editable. Download it and make adjustments in color, background, font etc. as per your unique business setting.
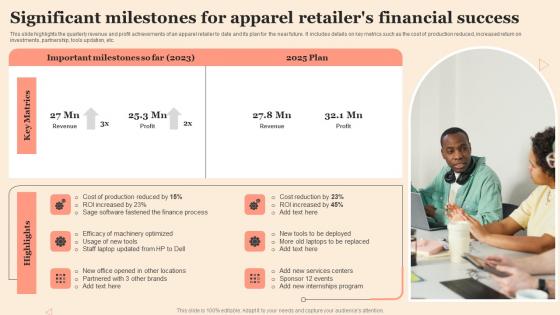
Significant Milestones For Apparel Retailers Financial Success Professional Pdf
This slide highlights the quarterly revenue and profit achievements of an apparel retailer to date and its plan for the near future. It includes details on key metrics such as the cost of production reduced, increased return on investments, partnership, tools updation, etc. Showcasing this set of slides titled Significant Milestones For Apparel Retailers Financial Success Professional Pdf The topics addressed in these templates are Software Fastened, Laptop Updated, Services Centers All the content presented in this PPT design is completely editable. Download it and make adjustments in color, background, font etc. as per your unique business setting.

Retail Expenditure Dashboard And Performance Dashboard Formats PDF
This slide enables to track quarterly performance and return on marketing expenditure of online marketing executed by an organization. It includes source wise performance report , return on investment, sales funnel, average order value report etc. Pitch your topic with ease and precision using this Retail Expenditure Dashboard And Performance Dashboard Formats PDF. This layout presents information on Return On Investment, Product Sales, Revenue. It is also available for immediate download and adjustment. So, changes can be made in the color, design, graphics or any other component to create a unique layout.
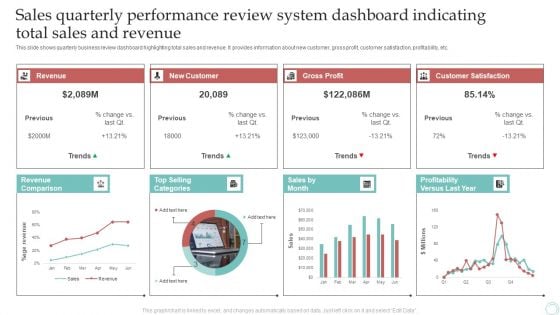
Sales Quarterly Performance Review System Dashboard Indicating Total Sales And Revenue Download PDF
This slide shows quarterly business review dashboard highlighting total sales and revenue. It provides information about new customer, gross profit, customer satisfaction, profitability, etc. Pitch your topic with ease and precision using this Sales Quarterly Performance Review System Dashboard Indicating Total Sales And Revenue Download PDF. This layout presents information on Revenue, New Customer, Gross Profit. It is also available for immediate download and adjustment. So, changes can be made in the color, design, graphics or any other component to create a unique layout.
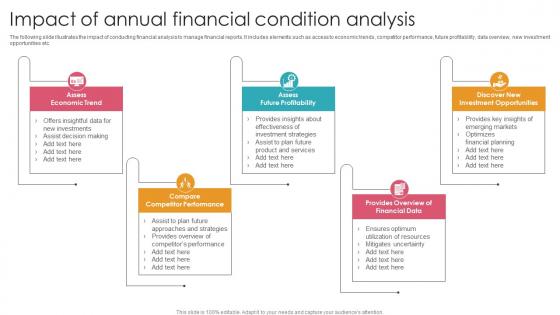
Impact Of Annual Financial Condition Analysis Template Pdf
The following slide illustrates the impact of conducting financial analysis to manage financial reports. It includes elements such as access to economic trends, competitor performance, future profitability, data overview, new investment opportunities etc. Showcasing this set of slides titled Impact Of Annual Financial Condition Analysis Template Pdf. The topics addressed in these templates are Assess Economic Trend, Assess Future Profitability, Discover Investment Opportunities. All the content presented in this PPT design is completely editable. Download it and make adjustments in color, background, font etc. as per your unique business setting.
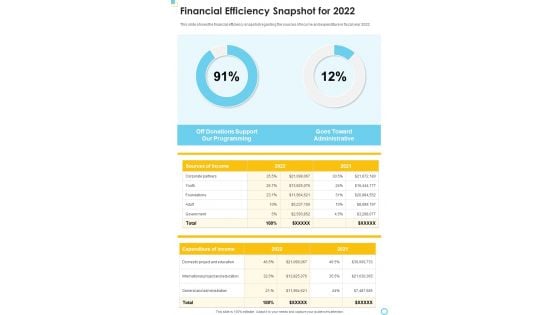
Financial Efficiency Snapshot For 2022 One Pager Documents
This slide shows the financial efficiency snapshot regarding the sources of income and expenditure in fiscal year 2022. Presenting you an exemplary Financial Efficiency Snapshot For 2022 One Pager Documents. Our one-pager comprises all the must-have essentials of an inclusive document. You can edit it with ease, as its layout is completely editable. With such freedom, you can tweak its design and other elements to your requirements. Download this Financial Efficiency Snapshot For 2022 One Pager Documents brilliant piece now.
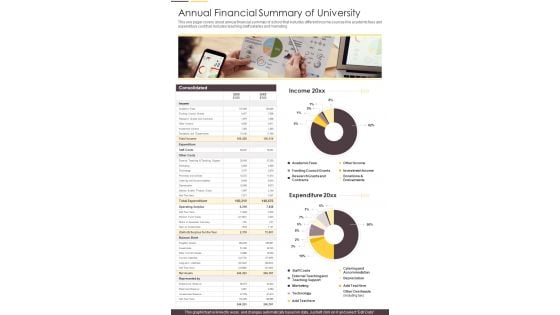
Annual Financial Summary Of University One Pager Documents
This one pager covers about annual financial summary of school that includes different income sources like academic fees and expenditure cost that includes teaching staff salaries and marketing. Presenting you an exemplary Annual Financial Summary Of University One Pager Documents. Our one-pager comprises all the must-have essentials of an inclusive document. You can edit it with ease, as its layout is completely editable. With such freedom, you can tweak its design and other elements to your requirements. Download this Annual Financial Summary Of University One Pager Documents brilliant piece now.
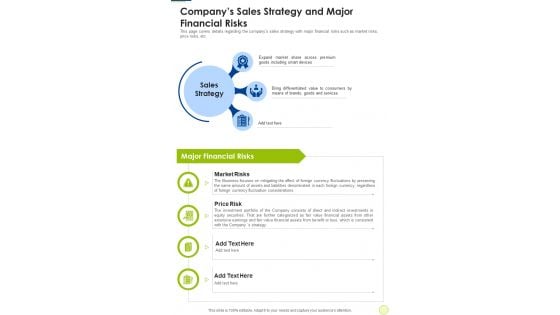
Companys Sales Strategy And Major Financial Risks One Pager Documents
This page covers details regarding the companys sales strategy with major financial risks such as market risks, price risks, etc. Presenting you a fantastic Companys Sales Strategy And Major Financial Risks One Pager Documents. This piece is crafted on hours of research and professional design efforts to ensure you have the best resource. It is completely editable and its design allow you to rehash its elements to suit your needs. Get this Companys Sales Strategy And Major Financial Risks One Pager Documents A4 One-pager now.
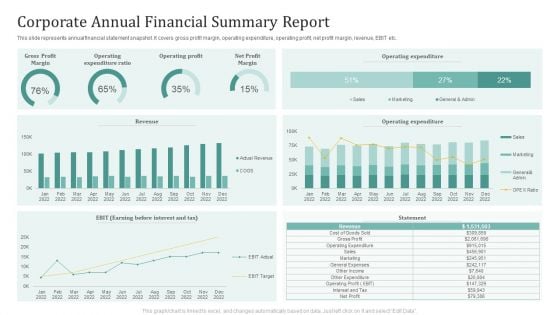
Corporate Annual Financial Summary Report Ppt Portfolio Skills PDF
This slide represents annual financial statement snapshot. It covers gross profit margin, operating expenditure, operating profit, net profit margin, revenue, EBIT etc. Pitch your topic with ease and precision using this Corporate Annual Financial Summary Report Ppt Portfolio Skills PDF. This layout presents information on Operating Expenditure Ratio, Operating Profit, Net Profit Margin. It is also available for immediate download and adjustment. So, changes can be made in the color, design, graphics or any other component to create a unique layout.
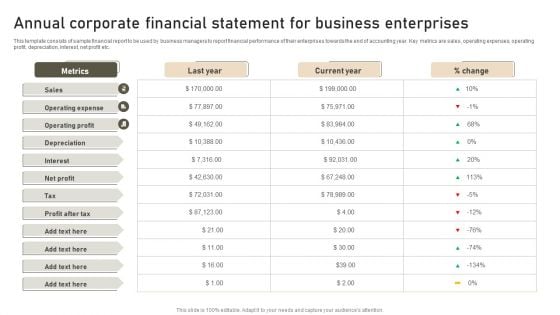
Annual Corporate Financial Statement For Business Enterprises Designs PDF
This template consists of sample financial report to be used by business managers to report financial performance of their enterprises towards the end of accounting year. Key metrics are sales, operating expenses, operating profit, depreciation, interest, net profit etc. Showcasing this set of slides titled Annual Corporate Financial Statement For Business Enterprises Designs PDF. The topics addressed in these templates are Operating Expense, Operating Profit, Depreciation. All the content presented in this PPT design is completely editable. Download it and make adjustments in color, background, font etc. as per your unique business setting.
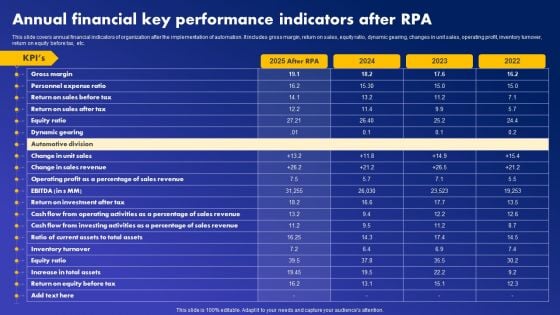
Annual Financial Key Performance Indicators After RPA Guidelines PDF
This slide covers annual financial indicators of organization after the implementation of automation. It includes gross margin, return on sales, equity ratio, dynamic gearing, changes in unit sales, operating profit, inventory turnover, return on equity before tax, etc. Create an editable Annual Financial Key Performance Indicators After RPA Guidelines PDF that communicates your idea and engages your audience. Whether you are presenting a business or an educational presentation, pre-designed presentation templates help save time. Annual Financial Key Performance Indicators After RPA Guidelines PDF is highly customizable and very easy to edit, covering many different styles from creative to business presentations. Slidegeeks has creative team members who have crafted amazing templates. So, go and get them without any delay.

Financial Due Diligence Ppt PowerPoint Presentation Inspiration Design Inspiration
This is a financial due diligence ppt powerpoint presentation inspiration design inspiration. This is a one stage process. The stages in this process are Business, Management, Marketing, Due Diligence, Agenda.
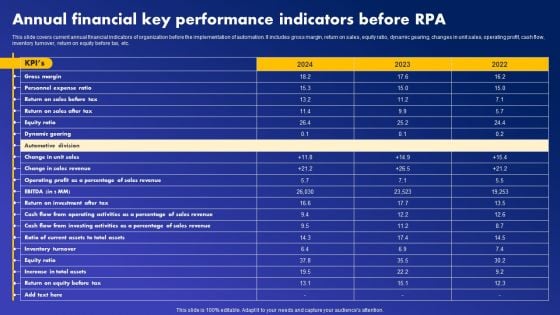
Annual Financial Key Performance Indicators Before RPA Download PDF
This slide covers current annual financial indicators of organization before the implementation of automation. It includes gross margin, return on sales, equity ratio, dynamic gearing, changes in unit sales, operating profit, cash flow, inventory turnover, return on equity before tax, etc. Slidegeeks is one of the best resources for PowerPoint templates. You can download easily and regulate Annual Financial Key Performance Indicators Before RPA Download PDF for your personal presentations from our wonderful collection. A few clicks is all it takes to discover and get the most relevant and appropriate templates. Use our Templates to add a unique zing and appeal to your presentation and meetings. All the slides are easy to edit and you can use them even for advertisement purposes.
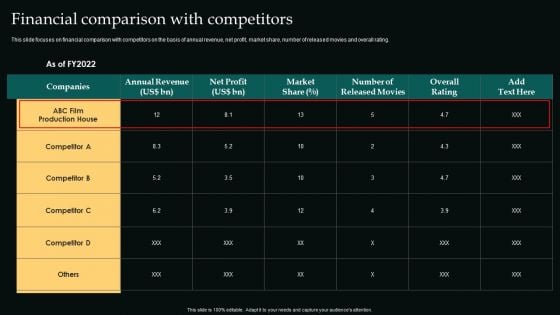
Financial Comparison With Competitors Movie Editing Company Outline Microsoft PDF
This slide focuses on financial comparison with competitors on the basis of annual revenue, net profit, market share, number of released movies and overall rating.The Financial Comparison With Competitors Movie Editing Company Outline Microsoft PDF is a compilation of the most recent design trends as a series of slides. It is suitable for any subject or industry presentation, containing attractive visuals and photo spots for businesses to clearly express their messages. This template contains a variety of slides for the user to input data, such as structures to contrast two elements, bullet points, and slides for written information. Slidegeeks is prepared to create an impression.
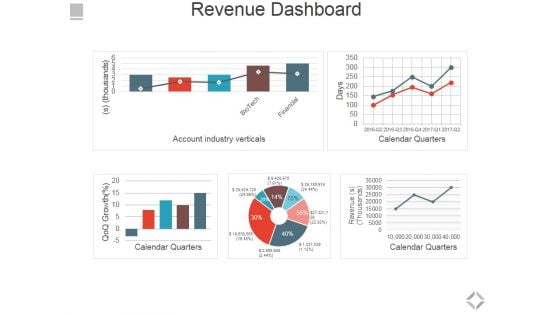
Revenue Dashboard Ppt PowerPoint Presentation Summary Brochure
This is a revenue dashboard ppt powerpoint presentation summary brochure. This is a five stage process. The stages in this process are account industry verticals, calendar quarters.
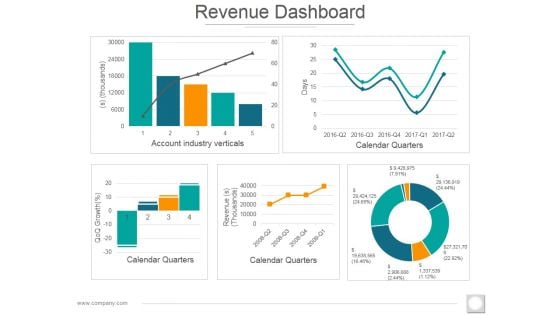
Revenue Dashboard Ppt PowerPoint Presentation Professional Microsoft
This is a revenue dashboard ppt powerpoint presentation professional microsoft. This is a five stage process. The stages in this process are account industry verticals, calendar quarters, revenue thousand, thousands.
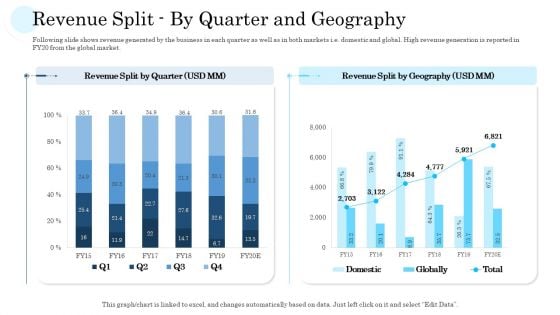
Revenue Split By Quarter And Geography Ppt PowerPoint Presentation File Guidelines PDF
Following slide shows revenue generated by the business in each quarter as well as in both markets i.e. domestic and global. High revenue generation is reported in FY20 from the global market.Deliver an awe-inspiring pitch with this creative revenue split by quarter and geography ppt powerpoint presentation file guidelines pdf. bundle. Topics like revenue split by quarter, revenue split by geography can be discussed with this completely editable template. It is available for immediate download depending on the needs and requirements of the user.
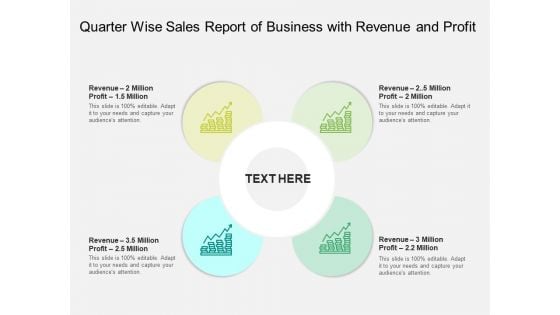
Quarter Wise Sales Report Of Business With Revenue And Profit Ppt PowerPoint Presentation File Guidelines PDF
Persuade your audience using this quarter wise sales report of business with revenue and profit ppt powerpoint presentation file guidelines pdf. This PPT design covers four stages, thus making it a great tool to use. It also caters to a variety of topics including revenue, profit, million. Download this PPT design now to present a convincing pitch that not only emphasizes the topic but also showcases your presentation skills.
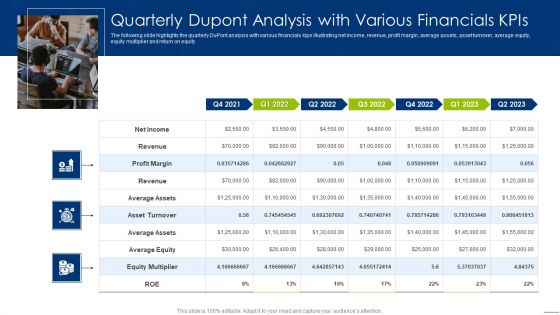
Quarterly Dupont Analysis With Various Financials Kpis Mockup PDF
Pitch your topic with ease and precision using this Quarterly Dupont Analysis With Various Financials Kpis Mockup PDF. This layout presents information on Revenue, Average Assets, Average Equity. It is also available for immediate download and adjustment. So, changes can be made in the color, design, graphics or any other component to create a unique layout.

 Home
Home