Quarterly Dashboard
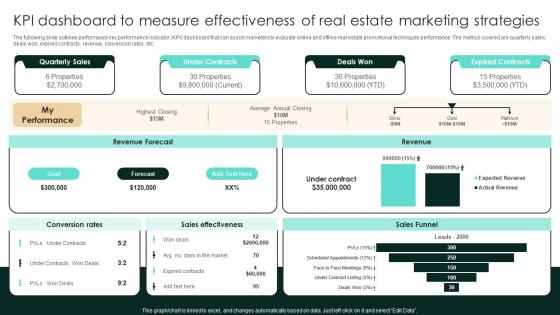
KPI Dashboard To Measure Effectiveness Of Real Estate Marketing Strategic Real Estate Structure Pdf
The following slide outlines performance key performance indicator KPI dashboard that can assist marketers to evaluate online and offline real estate promotional techniques performance. The metrics covered are quarterly sales, deals won, expired contracts, revenue, conversion rates, etc. Here you can discover an assortment of the finest PowerPoint and Google Slides templates. With these templates, you can create presentations for a variety of purposes while simultaneously providing your audience with an eye-catching visual experience. Download KPI Dashboard To Measure Effectiveness Of Real Estate Marketing Strategic Real Estate Structure Pdf to deliver an impeccable presentation. These templates will make your job of preparing presentations much quicker, yet still, maintain a high level of quality. Slidegeeks has experienced researchers who prepare these templates and write high-quality content for you. Later on, you can personalize the content by editing the KPI Dashboard To Measure Effectiveness Of Real Estate Marketing Strategic Real Estate Structure Pdf
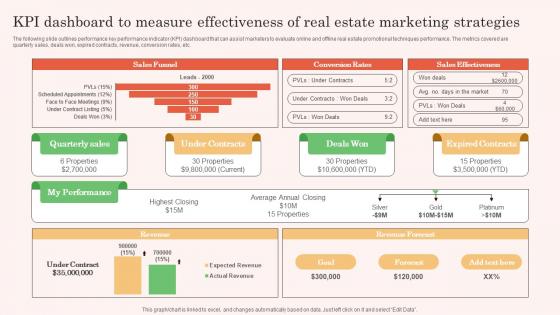
KPI Dashboard To Measure Effectivenesss Real Estate Property Marketing Themes Pdf
The following slide outlines performance key performance indicator KPI dashboard that can assist marketers to evaluate online and offline real estate promotional techniques performance. The metrics covered are quarterly sales, deals won, expired contracts, revenue, conversion rates, etc. Take your projects to the next level with our ultimate collection of KPI Dashboard To Measure Effectivenesss Real Estate Property Marketing Themes Pdf. Slidegeeks has designed a range of layouts that are perfect for representing task or activity duration, keeping track of all your deadlines at a glance. Tailor these designs to your exact needs and give them a truly corporate look with your own brand colors they all make your projects stand out from the rest.

KPI Dashboard To Measure Effectiveness Of Real Estate Marketing Strategies Inspiration PDF
The following slide outlines performance key performance indicator KPI dashboard that can assist marketers to evaluate online and offline real estate promotional techniques performance. The metrics covered are quarterly sales, deals won, expired contracts, revenue, conversion rates, etc. Coming up with a presentation necessitates that the majority of the effort goes into the content and the message you intend to convey. The visuals of a PowerPoint presentation can only be effective if it supplements and supports the story that is being told. Keeping this in mind our experts created KPI Dashboard To Measure Effectiveness Of Real Estate Marketing Strategies Inspiration PDF to reduce the time that goes into designing the presentation. This way, you can concentrate on the message while our designers take care of providing you with the right template for the situation.
SAC Planning And Implementation SAP Analytics Cloud Dashboard For Product Sales Analysis Icons PDF
This slide illustrates the SAP Analytics Cloud dashboard to monitor product sales performance. It provides information regarding the gross margin and net revenue earned, product performance state wise and year wise. Deliver and pitch your topic in the best possible manner with this SAC Planning And Implementation SAP Analytics Cloud Dashboard For Product Sales Analysis Icons PDF. Use them to share invaluable insights on Gross Margin, Earned Quarter Wise, Gross Margin, Net Revenue and impress your audience. This template can be altered and modified as per your expectations. So, grab it now.

Actual And Planned Partner Executive Performance Dashboard Ppt Show Outline PDF
This slide covers the partner executive dashboard that focuses on revenues, pipeline, capability scoreboard, along with actual and planned values quarterly. Deliver an awe inspiring pitch with this creative actual and planned partner executive performance dashboard ppt show outline pdf bundle. Topics like actual and planned partner executive performance dashboard can be discussed with this completely editable template. It is available for immediate download depending on the needs and requirements of the user.

Logistics KPI Status Dashboard With Monthly KPI Ppt Infographic Template Layout PDF
The following slide highlights the transportation status dashboard with monthly KPI illustrating order status with customer, order date and delivery date. It shows financial performance for four quarters as well as todays order, inventory and monthly KPI with Inventory, shipping cost for past 30 days. Pitch your topic with ease and precision using this Logistics KPI Status Dashboard With Monthly KPI Ppt Infographic Template Layout PDF. This layout presents information on Order Status, Today Order, Inventory, Monthly KPI. It is also available for immediate download and adjustment. So, changes can be made in the color, design, graphics or any other component to create a unique layout.

Customer Attrition Rate Dashboard For IBN Outsourcing Company PPT Template SS
This slide shows a Customer Attrition Rate Dashboard with KPIs such as Company Revenue , Customer Attrition Rate in 2021 , Annual Growth Rate , Average Customer Queue Time , Onboarding Process Effectiveness etc. There are so many reasons you need a Customer Attrition Rate Dashboard For IBN Outsourcing Company PPT Template SS. The first reason is you can not spend time making everything from scratch, Thus, Slidegeeks has made presentation templates for you too. You can easily download these templates from our website easily.

PRM To Streamline Business Processes Actual And Planned Partner Executive Performance Dashboard Demonstration PDF
This slide covers the partner executive dashboard that focuses on revenues, pipeline, capability scoreboard, along with actual and planned values quarterly. Deliver an awe inspiring pitch with this creative prm to streamline business processes actual and planned partner executive performance dashboard demonstration pdf bundle. Topics like revenue, plan, target can be discussed with this completely editable template. It is available for immediate download depending on the needs and requirements of the user.
Employees Performance Assessment And Appraisal Determine Employee Performance Tracker Dashboard Diagrams PDF
This slide provides information about employee performance tracker dashboard which covers details in context to employee training, etc.Deliver and pitch your topic in the best possible manner with this Employees Performance Assessment And Appraisal Determine Employee Performance Tracker Dashboard Diagrams PDF Use them to share invaluable insights on Needs Improvement, Current Quarterly, Outstanding and impress your audience. This template can be altered and modified as per your expectations. So, grab it now.
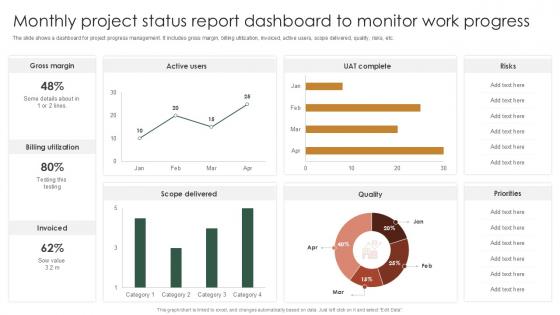
Monthly Project Status Report Dashboard To Monitor Work Progress PPT Template SS
The slide shows a dashboard for project progress management. It includes gross margin, billing utilization, invoiced, active users, scope delivered, quality, risks, etc. There are so many reasons you need a Monthly Project Status Report Dashboard To Monitor Work Progress PPT Template SS. The first reason is you can not spend time making everything from scratch, Thus, Slidegeeks has made presentation templates for you too. You can easily download these templates from our website easily.
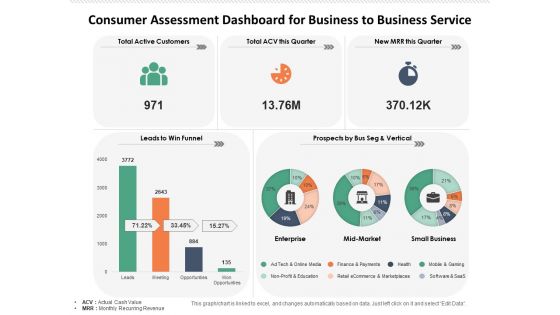
Consumer Assessment Dashboard For Business To Business Service Ppt PowerPoint Presentation Professional Smartart PDF
Presenting this set of slides with name consumer assessment dashboard for business to business service ppt powerpoint presentation professional smartart pdf. The topics discussed in these slides are total active customers, total acv this quarter, new mrr this quarter, leads to win funnel, prospects by bus seg and vertical, enterprise, mid market, small business. This is a completely editable PowerPoint presentation and is available for immediate download. Download now and impress your audience.

Time To Hire Recruitment And Selection Dashboard Workforce Procurement And Aptitude Evaluation Ppt Template
This slide shows time to hire new candidate in organization for various departments. It include hiring status for technical department and no-technical department, current hiring pipeline and top hiring sources for one quarter, etc. From laying roadmaps to briefing everything in detail, our templates are perfect for you. You can set the stage with your presentation slides. All you have to do is download these easy-to-edit and customizable templates. Time To Hire Recruitment And Selection Dashboard Workforce Procurement And Aptitude Evaluation Ppt Template will help you deliver an outstanding performance that everyone would remember and praise you for. Do download this presentation today.
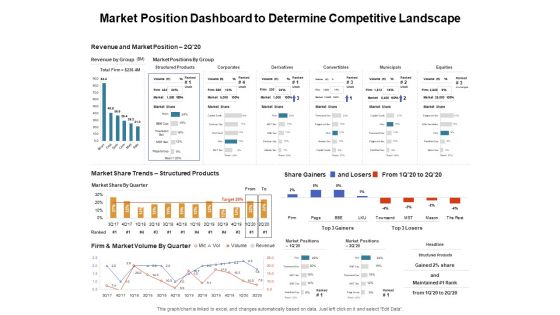
Venture Capitalist Control Board Market Position Dashboard To Determine Competitive Landscape Download PDF
Presenting this set of slides with name venture capitalist control board market position dashboard to determine competitive landscape download pdf. The topics discussed in these slides are revenue and market position, market share trends, firm and market volume by quarter. This is a completely editable PowerPoint presentation and is available for immediate download. Download now and impress your audience.

Incident Management Dashboard With Severity And Category Ppt PowerPoint Presentation Ideas Skills PDF
Presenting this set of slides with name incident management dashboard with severity and category ppt powerpoint presentation ideas skills pdf. The topics discussed in these slides are incidents by category, incidents by quarter, incidents by severity, internal fraud, external fraud, business disruption and system failures. This is a completely editable PowerPoint presentation and is available for immediate download. Download now and impress your audience.

Customer Relationship Management Action Plan CRM Application Dashboard Funnel Sample PDF
Deliver an awe inspiring pitch with this creative customer relationship management action plan crm application dashboard funnel sample pdf bundle. Topics like marketing funnel, opportunity generation by quarter, opportunities can be discussed with this completely editable template. It is available for immediate download depending on the needs and requirements of the user.
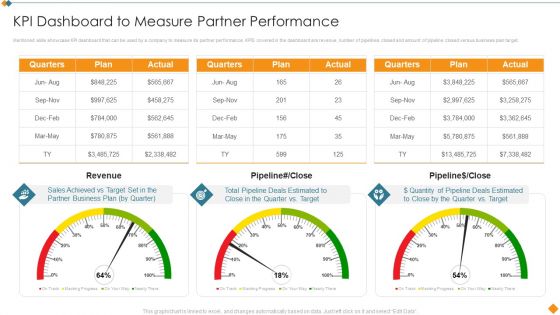
Maintaining Partner Relationships KPI Dashboard To Measure Partner Performance Structure PDF
Mentioned slide showcase KPI dashboard that can be used by a company to measure its partner performance. KPIS covered in the dashboard are revenue, number of pipelines closed and amount of pipeline closed versus business plan target. Deliver an awe inspiring pitch with this creative Maintaining Partner Relationships KPI Dashboard To Measure Partner Performance Structure PDF bundle. Topics like Quarters, Plan, Actual, Revenue, Pipeline can be discussed with this completely editable template. It is available for immediate download depending on the needs and requirements of the user.
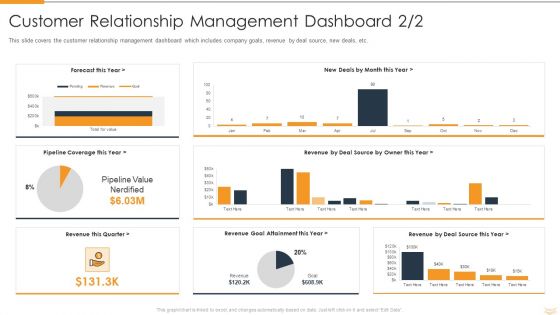
Strategic Partnership Management Plan Customer Relationship Management Dashboard Value Demonstration PDF
This slide covers the customer relationship management dashboard which includes company goals, revenue by deal source, new deals, etc. Deliver and pitch your topic in the best possible manner with this strategic partnership management plan customer relationship management dashboard value demonstration pdf. Use them to share invaluable insights on revenue this quarter, revenue goal attainment this year, revenue by deal source this year, revenue by deal source by owner this year, pipeline coverage this year, forecast this year, new deals by month this year and impress your audience. This template can be altered and modified as per your expectations. So, grab it now.

Talent Retention Initiatives For New Hire Onboarding Performance Dashboard Monitoring Download PDF
This slide presents a dashboard illustrating the impact of effective employee onboarding. It includes information about, employee turnover, turnover rate, average years tenure, turnovers per quarter, turnover percentage per department and type of turnover- voluntary or involuntary. There are so many reasons you need a Talent Retention Initiatives For New Hire Onboarding Performance Dashboard Monitoring Download PDF. The first reason is you cannot spend time making everything from scratch, Thus, Slidegeeks has made presentation templates for you too. You can easily download these templates from our website easily.
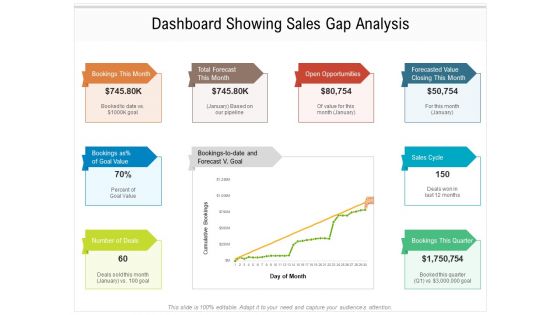
Dashboard Showing Sales Gap Analysis Ppt PowerPoint Presentation Infographic Template Graphics Pictures PDF
Presenting this set of slides with name dashboard showing sales gap analysis ppt powerpoint presentation infographic template graphics pictures pdf. The topics discussed in these slides are bookings month, total forecast month open opportumities, forecasted value closing number deals month, sales cycle, bookings this quarter, goal. This is a completely editable PowerPoint presentation and is available for immediate download. Download now and impress your audience.

Sales Management Dashboard With Win Rate Ppt PowerPoint Presentation Show Demonstration PDF
Presenting this set of slides with name sales management dashboard with win rate ppt powerpoint presentation show demonstration pdf. The topics discussed in these slides are team quota attainment for quarter, current sales content, team closed deals qtd, win rate, closed business by type, pipeline top deals. This is a completely editable PowerPoint presentation and is available for immediate download. Download now and impress your audience.

Economic Facts And Insights Dashboard With Sales Performance Ppt PowerPoint Presentation Show Gallery PDF
Showcasing this set of slides titled economic facts and insights dashboard with sales performance ppt powerpoint presentation show gallery pdf. The topics addressed in these templates are sales performance, increase in earnings per month, revenues by quarter, earnings per month. All the content presented in this PPT design is completely editable. Download it and make adjustments in color, background, font etc. as per your unique business setting.
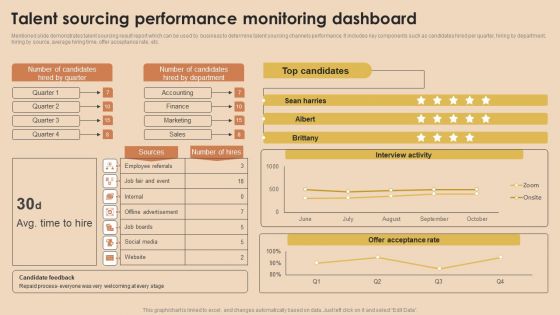
Detailed Guide For Talent Acquisition Talent Sourcing Performance Monitoring Dashboard Infographics PDF
Mentioned slide demonstrates talent sourcing result report which can be used by business to determine talent sourcing channels performance. It includes key components such as candidates hired per quarter, hiring by department, hiring by source, average hiring time, offer acceptance rate, etc. Whether you have daily or monthly meetings, a brilliant presentation is necessary. Detailed Guide For Talent Acquisition Talent Sourcing Performance Monitoring Dashboard Infographics PDF can be your best option for delivering a presentation. Represent everything in detail using Detailed Guide For Talent Acquisition Talent Sourcing Performance Monitoring Dashboard Infographics PDF and make yourself stand out in meetings. The template is versatile and follows a structure that will cater to your requirements. All the templates prepared by Slidegeeks are easy to download and edit. Our research experts have taken care of the corporate themes as well. So, give it a try and see the results.
KPI Dashboard For Tracking Business Investment Portfolio Investment Fund PPT Example
Mentioned slide demonstrates the key performance indicator dashboard of the business financial portfolio.It includes key elements such as portfolio value, yield cost ratio, annual dividends, unrealized gains, investment style, investment allocation by sectors, etc. Here you can discover an assortment of the finest PowerPoint and Google Slides templates. With these templates, you can create presentations for a variety of purposes while simultaneously providing your audience with an eye catching visual experience. Download KPI Dashboard For Tracking Business Investment Portfolio Investment Fund PPT Example to deliver an impeccable presentation. These templates will make your job of preparing presentations much quicker, yet still, maintain a high level of quality. Slidegeeks has experienced researchers who prepare these templates and write high quality content for you. Later on, you can personalize the content by editing the KPI Dashboard For Tracking Business Investment Portfolio Investment Fund PPT Example.
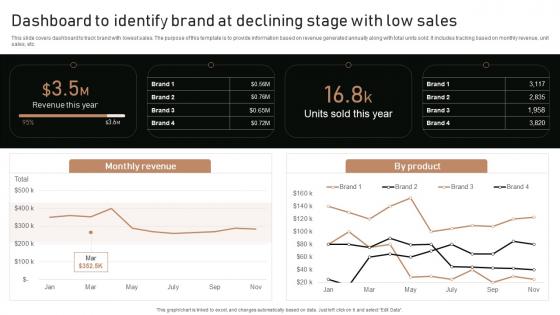
Execution Of Product Lifecycle Dashboard To Identify Brand At Declining Stage Ideas Pdf
This slide covers dashboard to track brand with lowest sales. The purpose of this template is to provide information based on revenue generated annually along with total units sold. It includes tracking based on monthly revenue, unit sales, etc. Get a simple yet stunning designed Execution Of Product Lifecycle Dashboard To Identify Brand At Declining Stage Ideas Pdf. It is the best one to establish the tone in your meetings. It is an excellent way to make your presentations highly effective. So, download this PPT today from Slidegeeks and see the positive impacts. Our easy-to-edit Execution Of Product Lifecycle Dashboard To Identify Brand At Declining Stage Ideas Pdf can be your go-to option for all upcoming conferences and meetings. So, what are you waiting for Grab this template today.
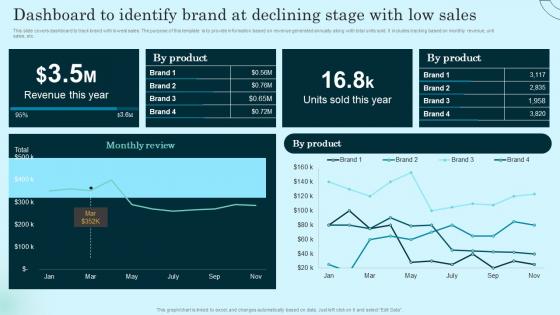
Dashboard To Identify Brand At Declining Stage Comprehensive Guide To Product Lifecycle Template Pdf
This slide covers dashboard to track brand with lowest sales. The purpose of this template is to provide information based on revenue generated annually along with total units sold. It includes tracking based on monthly revenue, unit sales, etc. From laying roadmaps to briefing everything in detail, our templates are perfect for you. You can set the stage with your presentation slides. All you have to do is download these easy to edit and customizable templates. Dashboard To Identify Brand At Declining Stage Comprehensive Guide To Product Lifecycle Template Pdf will help you deliver an outstanding performance that everyone would remember and praise you for. Do download this presentation today.
Icon For Annual Financial Performance Dashboard For Capital Fund Raising Ppt Layouts Layout PDF
Presenting Icon For Annual Financial Performance Dashboard For Capital Fund Raising Ppt Layouts Layout PDF to dispense important information. This template comprises three stages. It also presents valuable insights into the topics including Icon, Annual Financial ,Performance Dashboard, Capital Fund Raising. This is a completely customizable PowerPoint theme that can be put to use immediately. So, download it and address the topic impactfully.
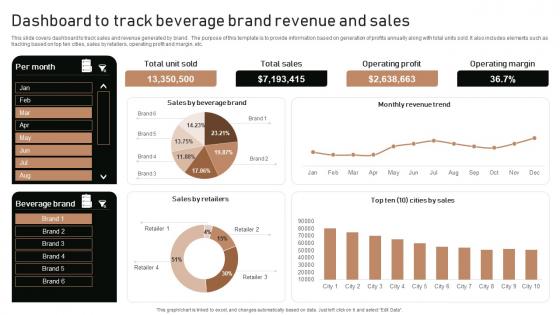
Execution Of Product Lifecycle Dashboard To Track Beverage Brand Revenue And Sales Ideas Pdf
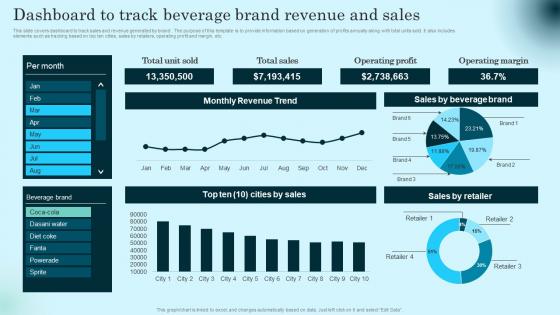
This slide covers dashboard to track sales and revenue generated by brand . The purpose of this template is to provide information based on generation of profits annually along with total units sold. It also includes elements such as tracking based on top ten cities, sales by retailers, operating profit and margin, etc. From laying roadmaps to briefing everything in detail, our templates are perfect for you. You can set the stage with your presentation slides. All you have to do is download these easy-to-edit and customizable templates. Execution Of Product Lifecycle Dashboard To Track Beverage Brand Revenue And Sales Ideas Pdf will help you deliver an outstanding performance that everyone would remember and praise you for. Do download this presentation today.
Dashboard To Track Beverage Brand Revenue Comprehensive Guide To Product Lifecycle Graphics Pdf
This slide covers dashboard to track sales and revenue generated by brand . The purpose of this template is to provide information based on generation of profits annually along with total units sold. It also includes elements such as tracking based on top ten cities, sales by retailers, operating profit and margin, etc. Present like a pro with Dashboard To Track Beverage Brand Revenue Comprehensive Guide To Product Lifecycle Graphics Pdf Create beautiful presentations together with your team, using our easy to use presentation slides. Share your ideas in real time and make changes on the fly by downloading our templates. So whether you are in the office, on the go, or in a remote location, you can stay in sync with your team and present your ideas with confidence. With Slidegeeks presentation got a whole lot easier. Grab these presentations today.
Food Service Delivery And Management Dashboard With Annual Sales Brochure PDF
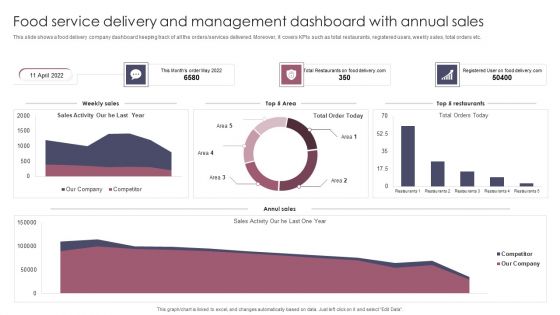
This slide shows a food delivery company dashboard keeping track of all the orders or services delivered. Moreover, it covers KPIs such as total restaurants, registered users, weekly sales, total orders etc. Showcasing this set of slides titled Food Service Delivery And Management Dashboard With Annual Sales Brochure PDF. The topics addressed in these templates are Food Service Delivery, Management Dashboard, Annual Sales. All the content presented in this PPT design is completely editable. Download it and make adjustments in color, background, font etc. as per your unique business setting.
Customer Satisfaction Dashboard Showing Improvement Of Service Template 290 One Pager Documents
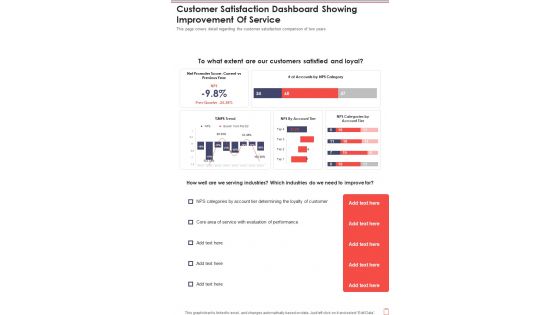
This page covers detail regarding the customer satisfaction comparison of two years. Presenting you a fantastic Customer Satisfaction Dashboard Showing Improvement Of Service Template 290 One Pager Documents. This piece is crafted on hours of research and professional design efforts to ensure you have the best resource. It is completely editable and its design allow you to rehash its elements to suit your needs. Get this Customer Satisfaction Dashboard Showing Improvement Of Service Template 290 One Pager Documents A4 One-pager now.
Implementing Annual Brand Marketing Strategy Dashboard Highlighting Effect Of Brand Marketing Plan Background PDF
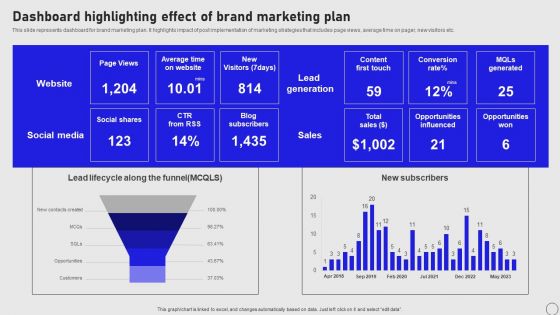
This slide represents dashboard for brand marketing plan. It highlights impact of post implementation of marketing strategies that includes page views, average time on pager, new visitors etc. There are so many reasons you need a Implementing Annual Brand Marketing Strategy Dashboard Highlighting Effect Of Brand Marketing Plan Background PDF. The first reason is you cannot spend time making everything from scratch, Thus, Slidegeeks has made presentation templates for you too. You can easily download these templates from our website easily.
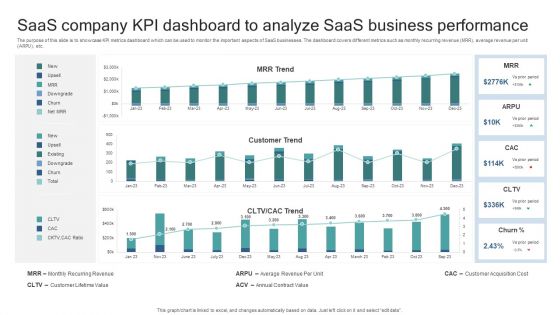
Saas Company KPI Dashboard To Analyze Saas Business Performance Elements PDF
The purpose of this slide is to showcase KPI metrics dashboard which can be used to monitor the important aspects of SaaS businesses. The dashboard covers different metrics such as monthly recurring revenue MRR, average revenue per unit ARPU, etc. Pitch your topic with ease and precision using this Saas Company KPI Dashboard To Analyze Saas Business Performance Elements PDF. This layout presents information on Monthly Recurring Revenue, Customer Lifetime Value, Average Revenue Per Unit, Annual Contract Value, Customer Acquisition Cost. It is also available for immediate download and adjustment. So, changes can be made in the color, design, graphics or any other component to create a unique layout.
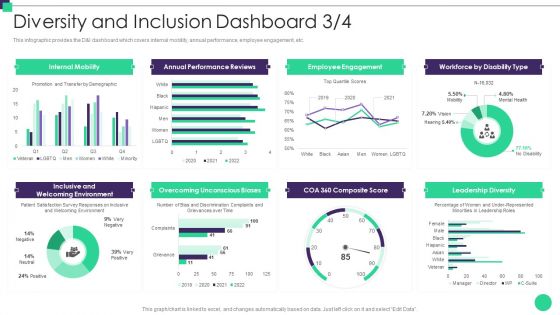
Organizational Diversity And Inclusion Preferences Diversity And Inclusion Dashboard Background PDF
This infographic provides the D andI dashboard which covers internal mobility, annual performance, employee engagement, etc. Deliver an awe inspiring pitch with this creative organizational diversity and inclusion preferences diversity and inclusion dashboard background pdf bundle. Topics like internal mobility, annual performance reviews, employee engagement, leadership diversity can be discussed with this completely editable template. It is available for immediate download depending on the needs and requirements of the user.
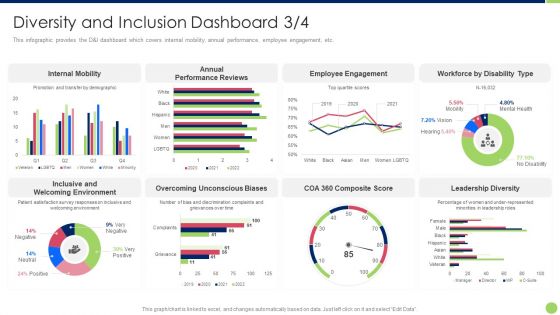
Workspace Diversification And Inclusion Strategy Diversity And Inclusion Dashboard Engagement Inspiration PDF
This infographic provides the DandI dashboard which covers internal mobility, annual performance, employee engagement, etc. Deliver an awe inspiring pitch with this creative workspace diversification and inclusion strategy diversity and inclusion dashboard engagement inspiration pdf bundle. Topics like gender distribution, hires by gender, ethnicity distribution, hire by ethnicity, turnover by gender, turnover by ethnicity can be discussed with this completely editable template. It is available for immediate download depending on the needs and requirements of the user.
Optimizing Logistics Management Process Dashboard To Track Inventory Management Status Icons PDF
This slide focuses on the dashboard to track inventory management status which covers annual stock conversion into sales, inventory turnover, inventory carrying cost and accuracy. Deliver an awe inspiring pitch with this creative optimizing logistics management process dashboard to track inventory management status icons pdf bundle. Topics like inventory carrying cost, inventory turnover, inventory accuracy, stock conversion into sales can be discussed with this completely editable template. It is available for immediate download depending on the needs and requirements of the user.
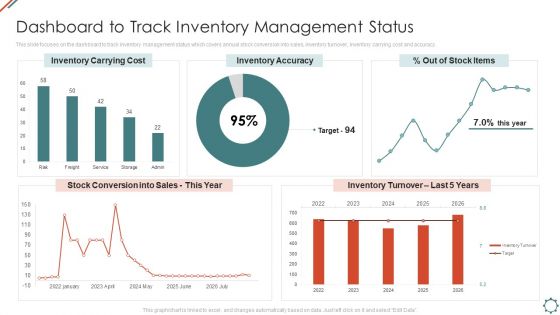
Administering Logistics Activities In SCM Dashboard To Track Inventory Management Status Background PDF
This slide focuses on the dashboard to track inventory management status which covers annual stock conversion into sales, inventory turnover, inventory carrying cost and accuracy. Deliver an awe inspiring pitch with this creative Administering Logistics Activities In SCM Dashboard To Track Inventory Management Status Background PDF bundle. Topics like Inventory Carrying, Inventory Accuracy, Inventory Turnover can be discussed with this completely editable template. It is available for immediate download depending on the needs and requirements of the user.
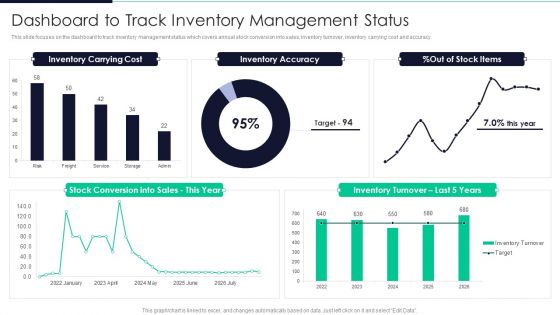
Developing Excellence In Logistics Operations Dashboard To Track Inventory Management Status Information PDF
This slide focuses on the dashboard to track inventory management status which covers annual stock conversion into sales, inventory turnover, inventory carrying cost and accuracy.Deliver and pitch your topic in the best possible manner with this Developing Excellence In Logistics Operations Dashboard To Track Inventory Management Status Information PDF Use them to share invaluable insights on Inventory Accuracy, Inventory Carrying, Inventory Turnover and impress your audience. This template can be altered and modified as per your expectations. So, grab it now.

Continual Improvement Procedure In Supply Chain Dashboard To Track Inventory Management Status Designs PDF
This slide focuses on the dashboard to track inventory management status which covers annual stock conversion into sales, inventory turnover, inventory carrying cost and accuracy.Deliver an awe inspiring pitch with this creative Continual Improvement Procedure In Supply Chain Dashboard To Track Inventory Management Status Designs PDF bundle. Topics like Stock Conversion, Inventory Turnover, Inventory Accuracy can be discussed with this completely editable template. It is available for immediate download depending on the needs and requirements of the user.
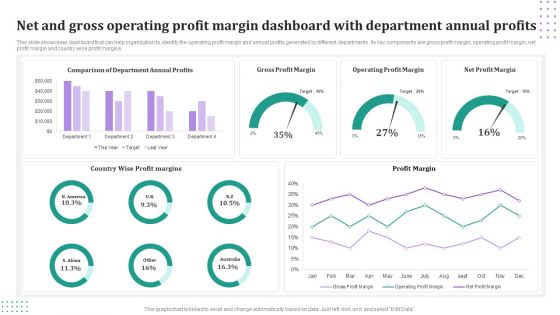
Net And Gross Operating Profit Margin Dashboard With Department Annual Profits Mockup PDF
This slide showcases dashboard that can help organization to identify the operating profit margin and annual profits generated by different departments. Its key components are gross profit margin, operating profit margin, net profit margin and country wise profit margins. Pitch your topic with ease and precision using this Net And Gross Operating Profit Margin Dashboard With Department Annual Profits Mockup PDF. This layout presents information on Gross Profit Margin, Operating Profit Margin, Net Profit Margin. It is also available for immediate download and adjustment. So, changes can be made in the color, design, graphics or any other component to create a unique layout.
Annual Financial Performance Administration Dashboard With Key Metrics Ppt PowerPoint Presentation Icon Visual Aids PDF
Showcasing this set of slides titled Annual Financial Performance Administration Dashboard With Key Metrics Ppt PowerPoint Presentation Icon Visual Aids PDF. The topics addressed in these templates are Accounts Receivable, Accounts Payable, Planned Profit Margin. All the content presented in this PPT design is completely editable. Download it and make adjustments in color, background, font etc. as per your unique business setting.

Business Sales Annual Performance And Success Rate Dashboard Ppt PowerPoint Presentation File Gridlines PDF
Presenting this set of slides with name business sales annual performance and success rate dashboard ppt powerpoint presentation file gridlines pdf. The topics discussed in these slides are performance, analysis, quantity. This is a completely editable PowerPoint presentation and is available for immediate download. Download now and impress your audience.
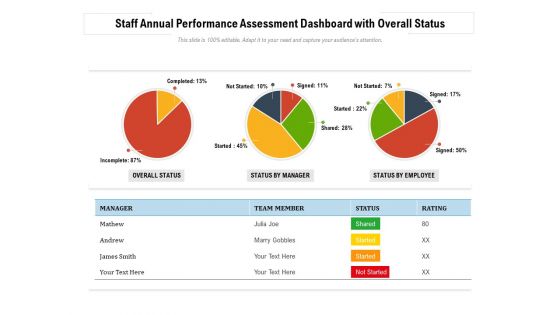
Staff Annual Performance Assessment Dashboard With Overall Status Ppt PowerPoint Presentation Gallery Design Inspiration PDF
Presenting this set of slides with name staff annual performance assessment dashboard with overall status ppt powerpoint presentation gallery design inspiration pdf. The topics discussed in these slides are overall status, status by manager, status by employee. This is a completely editable PowerPoint presentation and is available for immediate download. Download now and impress your audience.
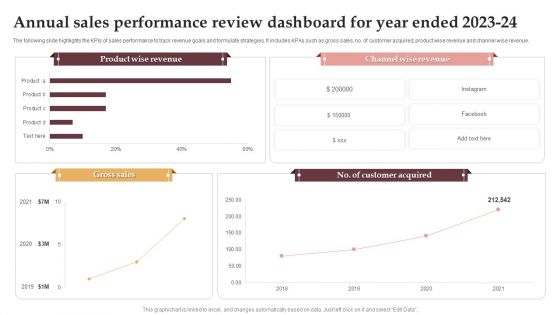
Annual Sales Performance Review Dashboard For Year Ended 2023 24 Formats PDF
Showcasing this set of slides titled Annual Sales Performance Review Dashboard For Year Ended 2023 24 Formats PDF. The topics addressed in these templates are Product Wise Revenue, Channel Wise Revenue, Gross Sales. All the content presented in this PPT design is completely editable. Download it and make adjustments in color, background, font etc. as per your unique business setting.
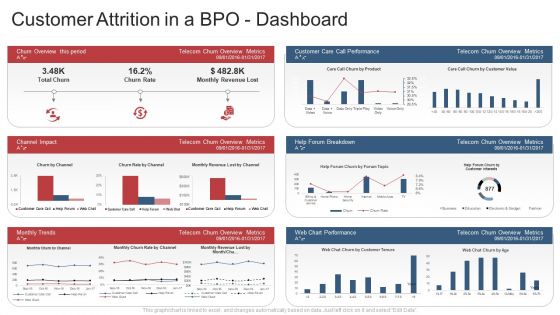
Customer Attrition In A Bpo Dashboard Rate Ppt Slides Designs Download PDF
This slide shows a Customer Attrition Rate Dashboard with KPIs such as Company Revenue , Customer Attrition Rate in 2021 , Annual Growth Rate , Average Customer Queue Time , Onboarding Process Effectiveness etc. Deliver an awe-inspiring pitch with this creative customer attrition in a bpo dashboard rate ppt slides designs download pdf. bundle. Topics like company revenue, customer attrition rate, annual growth rate, customer satisfaction, rate, operational efficiency can be discussed with this completely editable template. It is available for immediate download depending on the needs and requirements of the user.

Customer Attrition Rate Dashboard For IBN Outsourcing Company Ppt Ideas Samples PDF
This slide shows a Customer Attrition Rate Dashboard with KPIs such as Company Revenue , Customer Attrition Rate in 2021 , Annual Growth Rate , Average Customer Queue Time , Onboarding Process Effectiveness etc. Deliver and pitch your topic in the best possible manner with this customer attrition rate dashboard for IBN outsourcing company ppt ideas samples pdf. Use them to share invaluable insights on revenue, operational efficiency, product service, onboarding process effectiveness, annual growth and impress your audience. This template can be altered and modified as per your expectations. So, grab it now.
You Tube Advertising Campaign Performance Analytics Dashboard Ppt Icon Diagrams PDF
This slide represents dashboard showing analytics of performance of you tube marketing campaign. It includes data related to no. of visitors, qualified leads, customers and annual recurring revenue, lifetime value, gross volume etc generated through the campaign. Showcasing this set of slides titled You Tube Advertising Campaign Performance Analytics Dashboard Ppt Icon Diagrams PDF. The topics addressed in these templates are Monthly Recurring Revenue, Bounce Rate, Customer Churn Rate. All the content presented in this PPT design is completely editable. Download it and make adjustments in color, background, font etc. as per your unique business setting.
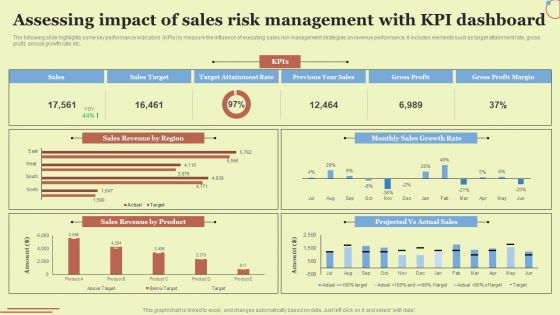
Assessing Impact Of Sales Risk Management With KPI Dashboard Ideas PDF
The following slide highlights some key performance indicators KPIs to measure the influence of executing sales risk management strategies on revenue performance. It includes elements such as target attainment rate, gross profit, annual growth rate etc. Presenting this PowerPoint presentation, titled Assessing Impact Of Sales Risk Management With KPI Dashboard Ideas PDF, with topics curated by our researchers after extensive research. This editable presentation is available for immediate download and provides attractive features when used. Download now and captivate your audience. Presenting this Assessing Impact Of Sales Risk Management With KPI Dashboard Ideas PDF. Our researchers have carefully researched and created these slides with all aspects taken into consideration. This is a completely customizable Assessing Impact Of Sales Risk Management With KPI Dashboard Ideas PDF that is available for immediate downloading. Download now and make an impact on your audience. Highlight the attractive features available with our PPTs.
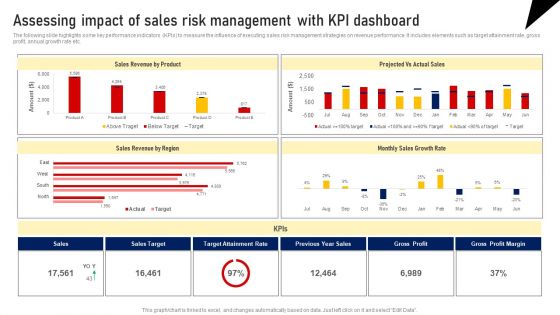
Assessing Impact Of Sales Risk Management With Kpi Dashboard Formats PDF
The following slide highlights some key performance indicators KPIs to measure the influence of executing sales risk management strategies on revenue performance. It includes elements such as target attainment rate, gross profit, annual growth rate etc. Presenting this PowerPoint presentation, titled Assessing Impact Of Sales Risk Management With Kpi Dashboard Formats PDF, with topics curated by our researchers after extensive research. This editable presentation is available for immediate download and provides attractive features when used. Download now and captivate your audience. Presenting this Assessing Impact Of Sales Risk Management With Kpi Dashboard Formats PDF. Our researchers have carefully researched and created these slides with all aspects taken into consideration. This is a completely customizable Assessing Impact Of Sales Risk Management With Kpi Dashboard Formats PDF that is available for immediate downloading. Download now and make an impact on your audience. Highlight the attractive features available with our PPTs.
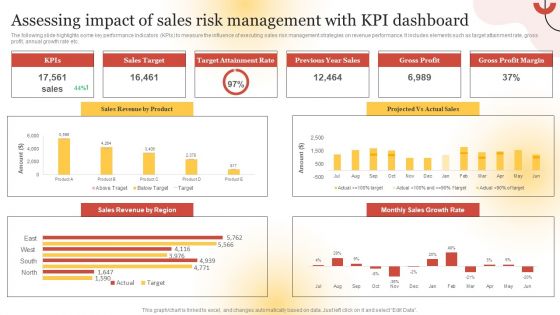
Assessing Impact Of Sales Risk Management With KPI Dashboard Guidelines PDF
The following slide highlights some key performance indicators KPIs to measure the influence of executing sales risk management strategies on revenue performance. It includes elements such as target attainment rate, gross profit, annual growth rate etc. Presenting this PowerPoint presentation, titled Assessing Impact Of Sales Risk Management With KPI Dashboard Guidelines PDF, with topics curated by our researchers after extensive research. This editable presentation is available for immediate download and provides attractive features when used. Download now and captivate your audience. Presenting this Assessing Impact Of Sales Risk Management With KPI Dashboard Guidelines PDF. Our researchers have carefully researched and created these slides with all aspects taken into consideration. This is a completely customizable Assessing Impact Of Sales Risk Management With KPI Dashboard Guidelines PDF that is available for immediate downloading. Download now and make an impact on your audience. Highlight the attractive features available with our PPTs.

Talent Administration And Succession Dashboard To Measure Employee Turnover Rate Demonstration PDF
This slide shows a dashboard that can be used by a firm to measure its employee turnover rate at different locations. It also portraits details about annual fluctuation rate along with number of leavers. Do you have to make sure that everyone on your team knows about any specific topic I yes, then you should give Talent Administration And Succession Dashboard To Measure Employee Turnover Rate Demonstration PDF a try. Our experts have put a lot of knowledge and effort into creating this impeccable Talent Administration And Succession Dashboard To Measure Employee Turnover Rate Demonstration PDF. You can use this template for your upcoming presentations, as the slides are perfect to represent even the tiniest detail. You can download these templates from the Slidegeeks website and these are easy to edit. So grab these today.

Crystal Methods In Agile Framework Crystal Methodology Implementation Dashboard Introduction PDF
This slide represents the crystal methodology implementation dashboard by covering annual gross revenue, product type comparison, sales rep comparison and top 10 clients. Here you can discover an assortment of the finest PowerPoint and Google Slides templates. With these templates, you can create presentations for a variety of purposes while simultaneously providing your audience with an eye catching visual experience. Download Crystal Methods In Agile Framework Crystal Methodology Implementation Dashboard Introduction PDF to deliver an impeccable presentation. These templates will make your job of preparing presentations much quicker, yet still, maintain a high level of quality. Slidegeeks has experienced researchers who prepare these templates and write high quality content for you. Later on, you can personalize the content by editing the Crystal Methods In Agile Framework Crystal Methodology Implementation Dashboard Introduction PDF.

Dashboard To Identify Brand At Declining Stage With Low Sales Demonstration PDF
This slide covers dashboard to track brand with lowest sales. The purpose of this template is to provide information based on revenue generated annually along with total units sold. It includes tracking based on monthly revenue, unit sales, etc. If you are looking for a format to display your unique thoughts, then the professionally designed Dashboard To Identify Brand At Declining Stage With Low Sales Demonstration PDF is the one for you. You can use it as a Google Slides template or a PowerPoint template. Incorporate impressive visuals, symbols, images, and other charts. Modify or reorganize the text boxes as you desire. Experiment with shade schemes and font pairings. Alter, share or cooperate with other people on your work. Download Dashboard To Identify Brand At Declining Stage With Low Sales Demonstration PDF and find out how to give a successful presentation. Present a perfect display to your team and make your presentation unforgettable.

KPI Dashboard To Measure Investment Portfolio Development Ppt Inspiration Gallery PDF
This slide signifies the key performance indicator dashboard to evaluate investment portfolio development. It covers information about yield cost ratio, total annual dividends, sector summary and country exposure. Showcasing this set of slides titled KPI Dashboard To Measure Investment Portfolio Development Ppt Inspiration Gallery PDF. The topics addressed in these templates are Portfolio Activity Summary, Investment Styles Shares, Country Exposure. All the content presented in this PPT design is completely editable. Download it and make adjustments in color, background, font etc. as per your unique business setting.

Inspecting Sales Optimization Areas Sales Analysis Dashboard To Measure Performance Demonstration PDF
This slide showcases a dashboard presenting various metrics to measure and analyze sales performance for revenue growth. It includes key components such as number of annual new customer, sales revenue, customer satisfaction, customer acquisition cost, product wise sales, month wise sales and sales comparison. From laying roadmaps to briefing everything in detail, our templates are perfect for you. You can set the stage with your presentation slides. All you have to do is download these easy-to-edit and customizable templates. Inspecting Sales Optimization Areas Sales Analysis Dashboard To Measure Performance Demonstration PDF will help you deliver an outstanding performance that everyone would remember and praise you for. Do download this presentation today.
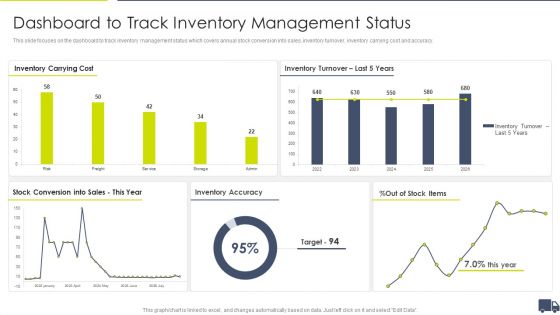
Enhancing Logistics Customer Service Dashboard To Track Inventory Management Status Microsoft PDF
This slide focuses on the dashboard to track inventory management status which covers annual stock conversion into sales, inventory turnover, inventory carrying cost and accuracy. Deliver and pitch your topic in the best possible manner with this Enhancing Logistics Customer Service Dashboard To Track Inventory Management Status Microsoft PDF. Use them to share invaluable insights on Inventory Carrying Cost, Inventory Turnover Last, 5 Years Stock, Conversion Into Sales, and impress your audience. This template can be altered and modified as per your expectations. So, grab it now.
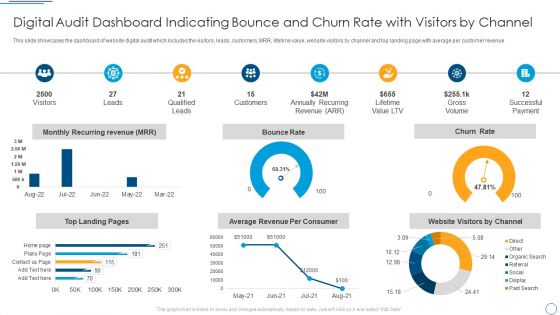
Digital Audit Dashboard Indicating Bounce And Churn Rate With Visitors By Channel Demonstration PDF
This slide showcases the dashboard of website digital audit which includes the visitors, leads, customers, MRR, lifetime value, website visitors by channel and top landing page with average per customer revenue.Deliver and pitch your topic in the best possible manner with this Digital Audit Dashboard Indicating Bounce And Churn Rate With Visitors By Channel Demonstration PDF. Use them to share invaluable insights on Qualified Leads, Annually Recurring, Successful Payment and impress your audience. This template can be altered and modified as per your expectations. So, grab it now.
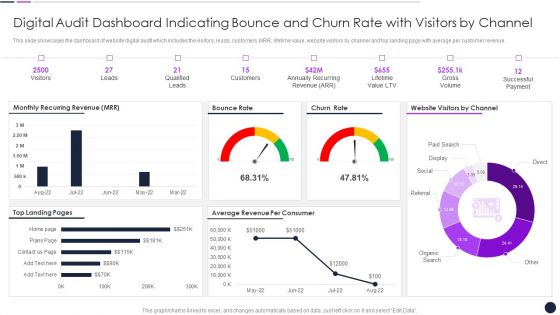
Digital Audit Dashboard Indicating Bounce And Churn Rate With Visitors By Channel Inspiration PDF
This slide showcases the dashboard of website digital audit which includes the visitors, leads, customers, MRR, lifetime value, website visitors by channel and top landing page with average per customer revenue.Deliver and pitch your topic in the best possible manner with this Digital Audit Dashboard Indicating Bounce And Churn Rate With Visitors By Channel Inspiration PDF. Use them to share invaluable insights on Qualified Leads, Annually Recurring, Lifetime Value and impress your audience. This template can be altered and modified as per your expectations. So, grab it now.
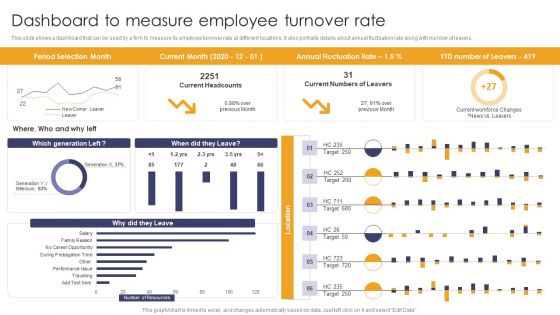
Implementing Succession Planning Dashboard To Measure Employee Turnover Rate Mockup PDF
This slide shows a dashboard that can be used by a firm to measure its employee turnover rate at different locations. It also portraits details about annual fluctuation rate along with number of leavers. There are so many reasons you need a Implementing Succession Planning Dashboard To Measure Employee Turnover Rate Mockup PDF. The first reason is you cant spend time making everything from scratch, Thus, Slidegeeks has made presentation templates for you too. You can easily download these templates from our website easily.

Business Vendor Performance Dashboard KPI With Top Supplier For Manufacturing Business Information PDF
Following slide contains executive dashboard which provide managers to track and monitor trends over a period of time. This include elements such as revenue, top products, top supplier, top customer, revenue trends annually, etc. Showcasing this set of slides titled Business Vendor Performance Dashboard KPI With Top Supplier For Manufacturing Business Information PDF. The topics addressed in these templates are Customers, Product, Sales. All the content presented in this PPT design is completely editable. Download it and make adjustments in color, background, font etc. as per your unique business setting.
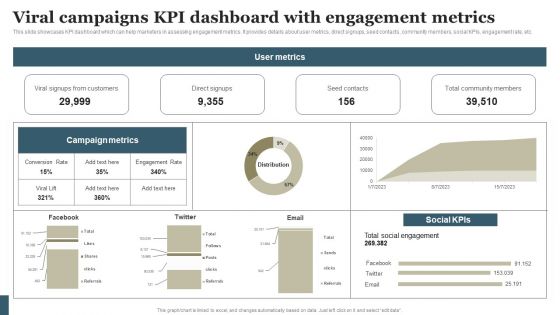
Viral Marketing Techniques To Increase Annual Business Sales Viral Campaigns KPI Dashboard With Engagement Guidelines PDF
This slide showcases KPI dashboard which can help marketers in assessing engagement metrics. It provides details about user metrics, direct signups, seed contacts, community members, social KPIs, engagement rate, etc. Present like a pro with Viral Marketing Techniques To Increase Annual Business Sales Viral Campaigns KPI Dashboard With Engagement Guidelines PDF Create beautiful presentations together with your team, using our easy-to-use presentation slides. Share your ideas in real-time and make changes on the fly by downloading our templates. So whether you are in the office, on the go, or in a remote location, you can stay in sync with your team and present your ideas with confidence. With Slidegeeks presentation got a whole lot easier. Grab these presentations today.

 Home
Home