Quarterly Dashboard
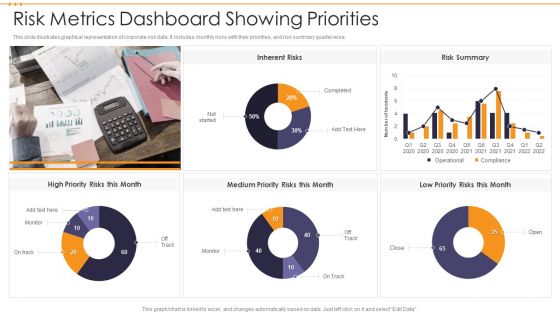
Risk Metrics Dashboard Showing Priorities Infographics PDF
This slide illustrates graphical representation of corporate risk data. It includes monthly risks with their priorities, and risk summary quarter wise. Showcasing this set of slides titled Risk Metrics Dashboard Showing Priorities Infographics PDF. The topics addressed in these templates are Risk Metrics Dashboard Showing Priorities. All the content presented in this PPT design is completely editable. Download it and make adjustments in color, background, font etc. as per your unique business setting.

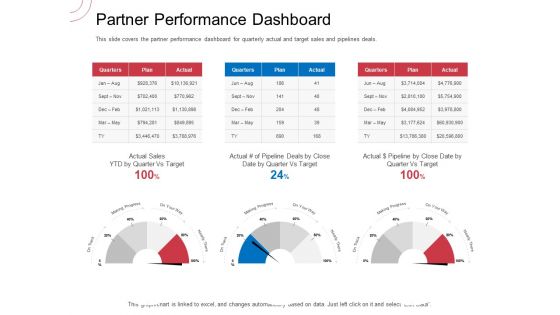
Business Relationship Management Tool Partner Performance Dashboard Template PDF
This slide covers the partner performance dashboard for quarterly actual and target sales and pipelines deals. Deliver an awe inspiring pitch with this creative business relationship management tool partner performance dashboard template pdf bundle. Topics like partner performance dashboard can be discussed with this completely editable template. It is available for immediate download depending on the needs and requirements of the user.
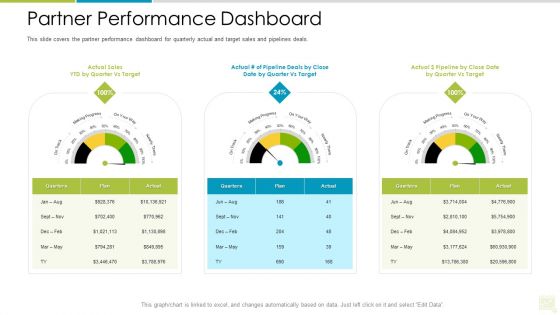
Indirect Channel Marketing Initiatives Partner Performance Dashboard Pictures PDF
This slide covers the partner performance dashboard for quarterly actual and target sales and pipelines deals. Deliver an awe inspiring pitch with this creative indirect channel marketing initiatives partner performance dashboard pictures pdf bundle. Topics like sales, target, actual, plan can be discussed with this completely editable template. It is available for immediate download depending on the needs and requirements of the user.
Distributor Entitlement Initiatives Partner Performance Dashboard Sample PDF
This slide covers the partner performance dashboard for quarterly actual and target sales and pipelines deals. Deliver an awe inspiring pitch with this creative distributor entitlement initiatives partner performance dashboard sample pdf bundle. Topics like sales, target, actual, plan can be discussed with this completely editable template. It is available for immediate download depending on the needs and requirements of the user.
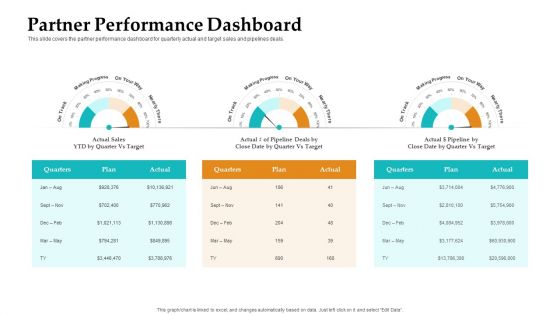
Sales Facilitation Partner Management Partner Performance Dashboard Graphics PDF
This slide covers the partner performance dashboard for quarterly actual and target sales and pipelines deals. Deliver an awe inspiring pitch with this creative sales facilitation partner management partner performance dashboard graphics pdf bundle. Topics like sales, target, actual, plan can be discussed with this completely editable template. It is available for immediate download depending on the needs and requirements of the user.
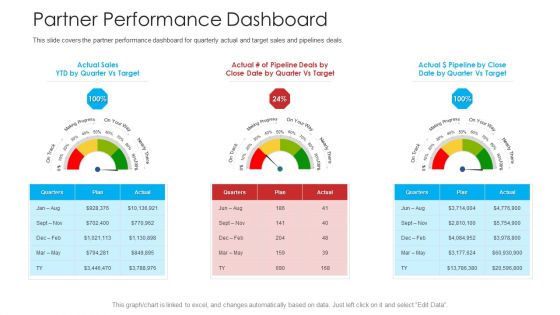
Retailer Channel Partner Boot Camp Partner Performance Dashboard Sample PDF
This slide covers the partner performance dashboard for quarterly actual and target sales and pipelines deals. Presenting retailer channel partner boot camp partner performance dashboard sample pdf to provide visual cues and insights. Share and navigate important information on three stages that need your due attention. This template can be used to pitch topics like performance dashboard, target sales, marketing progress. In addition, this PPT design contains high-resolution images, graphics, etc, that are easily editable and available for immediate download.
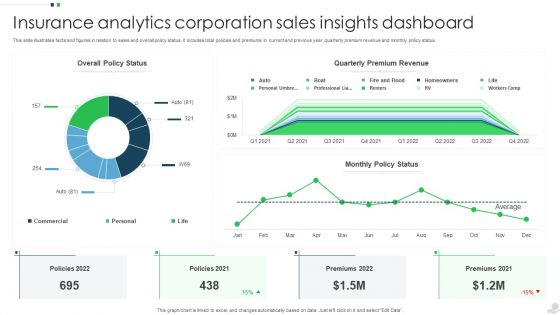
Insurance Analytics Corporation Sales Insights Dashboard Structure PDF
This slide illustrates facts and figures in relation to sales and overall policy status. It includes total policies and premiums in current and previous year, quarterly premium revenue and monthly policy status. Pitch your topic with ease and precision using this Insurance Analytics Corporation Sales Insights Dashboard Structure PDF. This layout presents information on Quarterly Premium Revenue, Sales Insights Dashboard, Insurance Analytics Corporation. It is also available for immediate download and adjustment. So, changes can be made in the color, design, graphics or any other component to create a unique layout.

Footwears Periodic Sales Performance Dashboard With Channels Download PDF
This slide showcase overall sales performance dashboard for the four quarters of shoe company. It includes sales category for men, women and kids, along with sales channel and quarterly sales chart. Showcasing this set of slides titled Footwears Periodic Sales Performance Dashboard With Channels Download PDF. The topics addressed in these templates are Men Shoes, Women Shoes, Sale Channels. All the content presented in this PPT design is completely editable. Download it and make adjustments in color, background, font etc. as per your unique business setting.
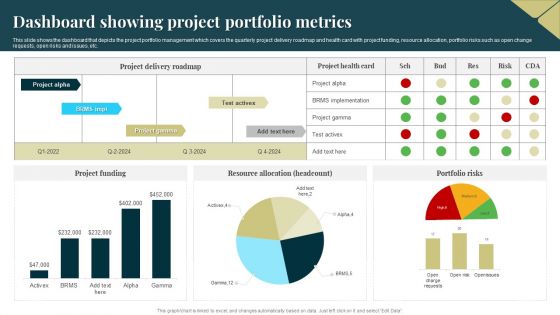
Dashboard Showing Project Portfolio Metrics Microsoft PDF
This slide shows the dashboard that depicts the project portfolio management which covers the quarterly project delivery roadmap and health card with project funding, resource allocation, portfolio risks such as open change requests, open risks and issues, etc. Pitch your topic with ease and precision using this Dashboard Showing Project Portfolio Metrics Microsoft PDF. This layout presents information on Resource Allocation, Portfolio Risks, Project Funding. It is also available for immediate download and adjustment. So, changes can be made in the color, design, graphics or any other component to create a unique layout.

Business Performance Review Dashboard With Customer Acquisition Cost Diagrams PDF
The following slide highlights KPI dashboard which can be used for quarterly business review QBR. It provides detailed information about actual revenue vs target, number of new customers, average revenue per customer, customer acquisition cost CAC etc. Pitch your topic with ease and precision using this Business Performance Review Dashboard With Customer Acquisition Cost Diagrams PDF. This layout presents information on Revenue, Customer Acquisition Cost, Current Quarter. It is also available for immediate download and adjustment. So, changes can be made in the color, design, graphics or any other component to create a unique layout.
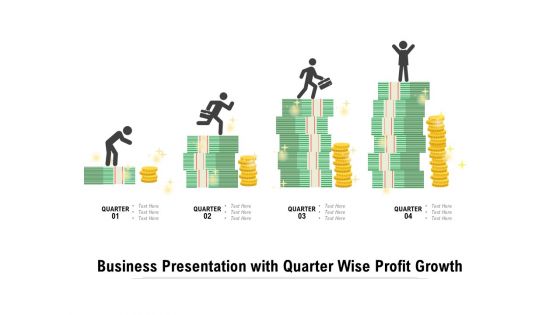
Business Presentation With Quarter Wise Profit Growth Ppt PowerPoint Presentation Infographics Rules PDF
Presenting quarter wise business performance with deploy and monitor ppt powerpoint presentation gallery graphics template pdf. to dispense important information. This template comprises four stages. It also presents valuable insights into the topics including business presentation with quarter wise profit growth. This is a completely customizable PowerPoint theme that can be put to use immediately. So, download it and address the topic impactfully.
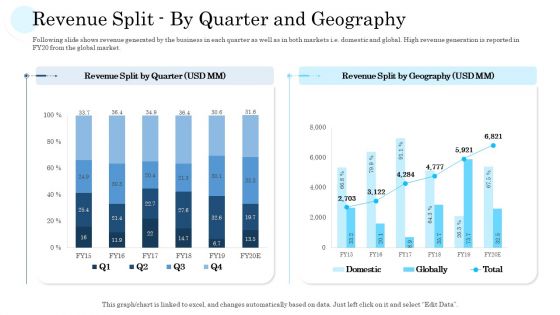
Revenue Split By Quarter And Geography Ppt PowerPoint Presentation File Guidelines PDF
Following slide shows revenue generated by the business in each quarter as well as in both markets i.e. domestic and global. High revenue generation is reported in FY20 from the global market.Deliver an awe-inspiring pitch with this creative revenue split by quarter and geography ppt powerpoint presentation file guidelines pdf. bundle. Topics like revenue split by quarter, revenue split by geography can be discussed with this completely editable template. It is available for immediate download depending on the needs and requirements of the user.
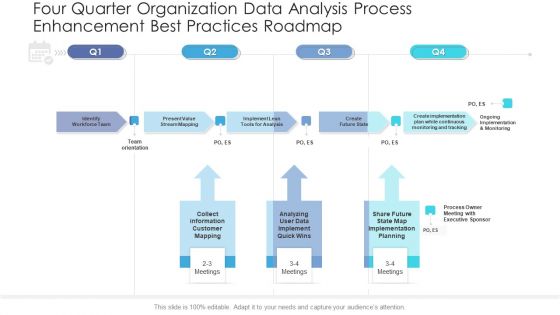
Four Quarter Organization Data Analysis Process Enhancement Best Practices Roadmap Demonstration
We present our four quarter organization data analysis process enhancement best practices roadmap demonstration. This PowerPoint layout is easy to edit so you can change the font size, font type, color, and shape conveniently. In addition to this, the PowerPoint layout is Google Slides compatible, so you can share it with your audience and give them access to edit it. Therefore, download and save this well researched four quarter organization data analysis process enhancement best practices roadmap demonstration in different formats like PDF, PNG, and JPG to smoothly execute your business plan.
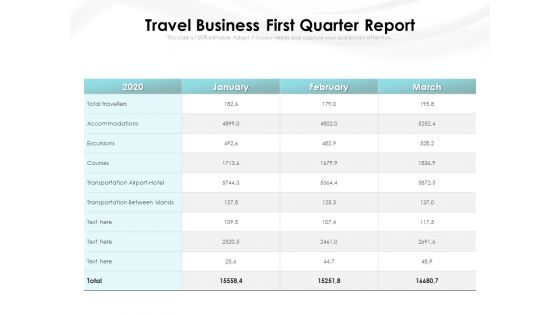
Travel Business First Quarter Report Ppt PowerPoint Presentation File Samples PDF
Presenting this set of slides with name travel business first quarter report ppt powerpoint presentation file samples pdf. The topics discussed in these slides are accommodations, excursions, courses. This is a completely editable PowerPoint presentation and is available for immediate download. Download now and impress your audience.

Medical Services Market Intelligence Reporting And Solutions Four Quarter Roadmap Formats
Presenting our innovatively structured medical services market intelligence reporting and solutions four quarter roadmap formats Template. Showcase your roadmap process in different formats like PDF, PNG, and JPG by clicking the download button below. This PPT design is available in both Standard Screen and Widescreen aspect ratios. It can also be easily personalized and presented with modified font size, font type, color, and shapes to measure your progress in a clear way.
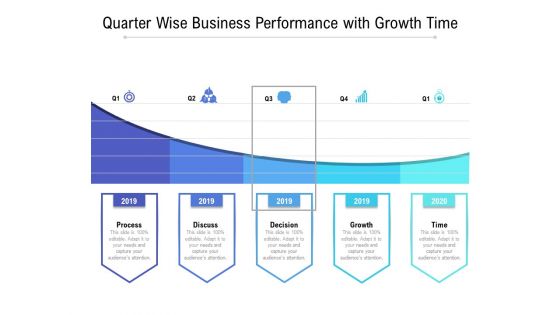
Quarter Wise Business Performance With Growth Time Ppt PowerPoint Presentation Infographics Design Ideas PDF
Persuade your audience using this quarter wise business performance with growth time ppt powerpoint presentation infographics design ideas pdf. This PPT design covers five stages, thus making it a great tool to use. It also caters to a variety of topics including 2019 to 2020, process, decision, growth, time, discuss. Download this PPT design now to present a convincing pitch that not only emphasizes the topic but also showcases your presentation skills.

Quarter Wise Sales Report Of Business With Revenue And Profit Ppt PowerPoint Presentation File Guidelines PDF
Persuade your audience using this quarter wise sales report of business with revenue and profit ppt powerpoint presentation file guidelines pdf. This PPT design covers four stages, thus making it a great tool to use. It also caters to a variety of topics including revenue, profit, million. Download this PPT design now to present a convincing pitch that not only emphasizes the topic but also showcases your presentation skills.

Expenses Management Plan Upcoming Quarter Budget Reallocation For Marketing Elements PDF
The purpose of this slide is to showcase the impact of hiring a digital agency on the marketing department budget. It provides information regarding the increase or decrease in the amount allocated for offline and digital marketing and PR activities. The Expenses Management Plan Upcoming Quarter Budget Reallocation For Marketing Elements PDF is a compilation of the most recent design trends as a series of slides. It is suitable for any subject or industry presentation, containing attractive visuals and photo spots for businesses to clearly express their messages. This template contains a variety of slides for the user to input data, such as structures to contrast two elements, bullet points, and slides for written information. Slidegeeks is prepared to create an impression.

Sales Opportunity Dashboard Depicting International Business Analysis Brochure PDF
This slide showcase sales opportunity dashboard depicting international market analysis which contains opportunities, quarter to date bookings, average purchase value and opportunity breakdown. Showcasing this set of slides titled Sales Opportunity Dashboard Depicting International Business Analysis Brochure PDF. The topics addressed in these templates are Average Purchase Value, Opportunities. All the content presented in this PPT design is completely editable. Download it and make adjustments in color, background, font etc. as per your unique business setting.
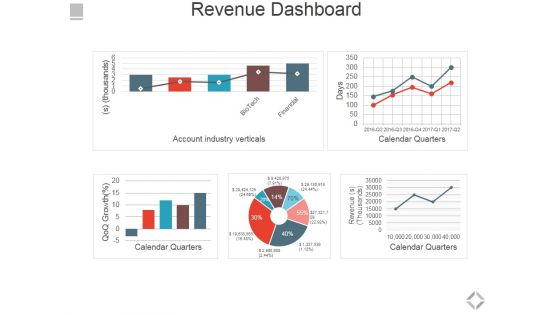
Revenue Dashboard Ppt PowerPoint Presentation Summary Brochure
This is a revenue dashboard ppt powerpoint presentation summary brochure. This is a five stage process. The stages in this process are account industry verticals, calendar quarters.
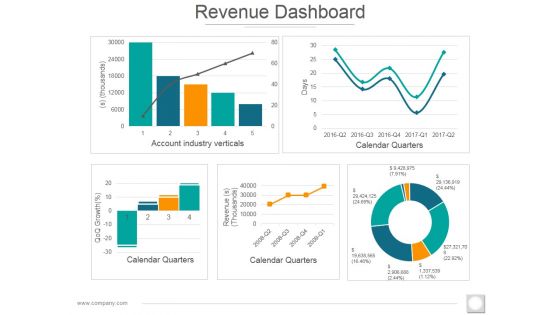
Revenue Dashboard Ppt PowerPoint Presentation Professional Microsoft
This is a revenue dashboard ppt powerpoint presentation professional microsoft. This is a five stage process. The stages in this process are account industry verticals, calendar quarters, revenue thousand, thousands.

Business Global Trade Management Dashboard Inspiration PDF
This slide presents a dashboard for global export trade management and tracking product delivery activities across different countries. It includes key components such as total exports by quarter, top business units by export values, top countries to export, etc. Showcasing this set of slides titled Business Global Trade Management Dashboard Inspiration PDF. The topics addressed in these templates are Business Global Trade, Management Dashboard. All the content presented in this PPT design is completely editable. Download it and make adjustments in color, background, font etc. as per your unique business setting.
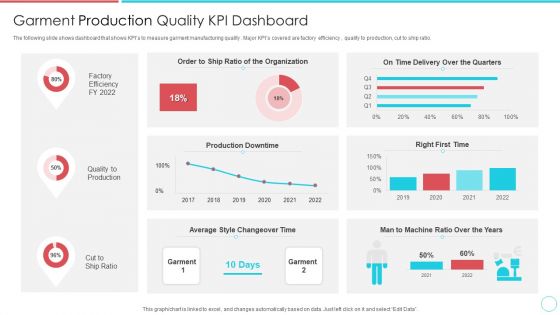
Garment Production Quality KPI Dashboard Portrait PDF
The following slide shows dashboard that shows KPIs to measure garment manufacturing quality . Major KPIs covered are factory efficiency , quality to production, cut to ship ratio.Pitch your topic with ease and precision using this Garment Production Quality KPI Dashboard Portrait PDF This layout presents information on Production Downtime, Time Delivery Over The Quarters, Average Style Changeover Time It is also available for immediate download and adjustment. So, changes can be made in the color, design, graphics or any other component to create a unique layout.
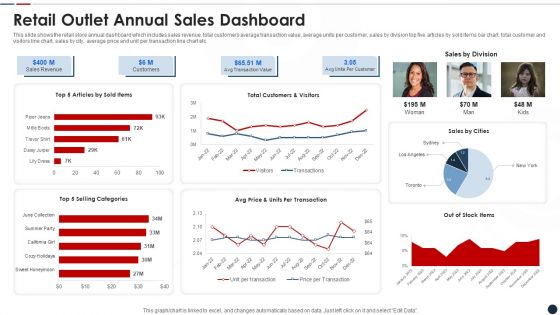
Retail Outlet Annual Sales Dashboard Elements PDF
This slide shows the retail store annual dashboard which includes sales revenue, total customers average transaction value, average units per customer, sales by division top five articles by sold items bar chart, total customer and visitors line chart, sales by city, average price and unit per transaction line chart etc.Pitch your topic with ease and precision using this retail outlet annual sales dashboard elements pdf This layout presents information on Retail outlet annual sales dashboard It is also available for immediate download and adjustment. So, changes can be made in the color, design, graphics or any other component to create a unique layout.

Property Management Dashboard One Pager Documents
This page provides the property management dashboard including details such as net income revenue and total cost, occupancy rate, tenant turnover, tenant acquisition cost, loss due to vacancy, revenue and cost overview graph etc. Presenting you an exemplary Property Management Dashboard One Pager Documents. Our one-pager comprises all the must-have essentials of an inclusive document. You can edit it with ease, as its layout is completely editable. With such freedom, you can tweak its design and other elements to your requirements. Download this Property Management Dashboard One Pager Documents brilliant piece now.

Annual Business Financial Summary Dashboard Themes PDF
This slide shows annual financial report dashboard of company to monitor yearly business performance. It includes various indicators such as revenue, net profits, costs and breakdown of cost. Showcasing this set of slides titled Annual Business Financial Summary Dashboard Themes PDF. The topics addressed in these templates are Revenue, Costs, Net Profit. All the content presented in this PPT design is completely editable. Download it and make adjustments in color, background, font etc. as per your unique business setting.
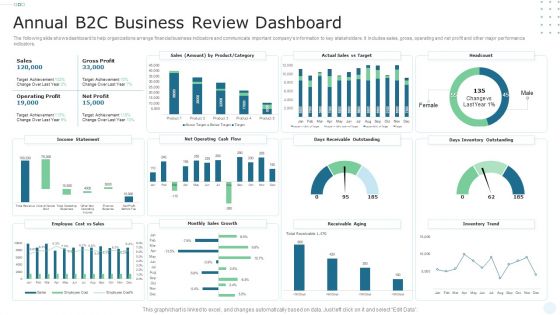
Annual B2C Business Review Dashboard Microsoft PDF
The following slide shows dashboard to help organizations arrange financial business indicators and communicate important companys information to key stakeholders. It includes sales, gross, operating and net profit and other major performance indicators. Showcasing this set of slides titled Annual B2C Business Review Dashboard Microsoft PDF. The topics addressed in these templates are Gross Profit, Sales, Operating Profit. All the content presented in this PPT design is completely editable. Download it and make adjustments in color, background, font etc. as per your unique business setting.
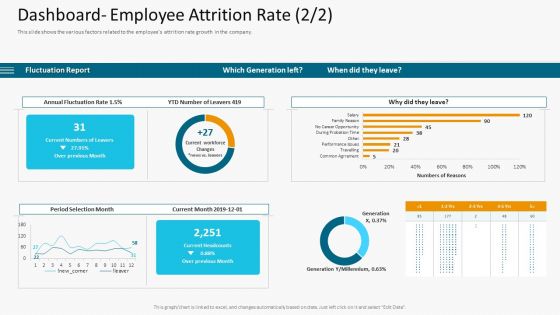
Dashboard Employee Attrition Rate Grid Sample PDF
This slide shows the various factors related to the employees attrition rate growth in the company. Deliver an awe inspiring pitch with this creative dashboard employee attrition rate grid sample pdf bundle. Topics like annual fluctuation rate, period selection month, dashboard employee attrition rate can be discussed with this completely editable template. It is available for immediate download depending on the needs and requirements of the user.
Investment Fund Performance Tracking Dashboard Microsoft PDF
This slide showcases a dashboard to track and supervise funds performance for portfolio balancing . it includes key components such as amount invested in funds, number of invested funds, rate of return, annual investments and rating wise investments. Pitch your topic with ease and precision using this Investment Fund Performance Tracking Dashboard Microsoft PDF. This layout presents information on Amount Invented Funds, Rate Return, Rating Wise Investments. It is also available for immediate download and adjustment. So, changes can be made in the color, design, graphics or any other component to create a unique layout.
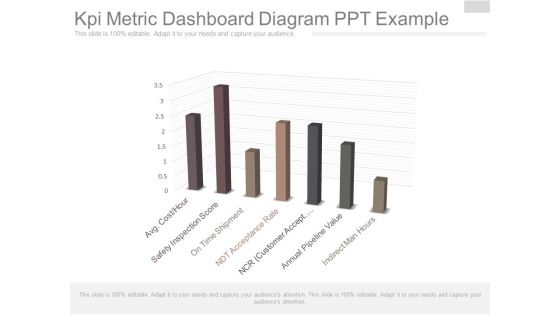
Kpi Metric Dashboard Diagram Ppt Example
This is a kpi metric dashboard diagram ppt example. This is a seven stage process. The stages in this process are avg cost hour, safety inspection score, on time shipment, ndt acceptance rate, ncr customer accept, annual pipeline value, indirect man hours.

Business Management Workflow Automation Dashboard Pictures PDF
This slide presents the graphical representation of business management dashboard via workflow automation software. It includes annual revenue analysis, annual profit analysis, quotation, estimated income, monthly project revenue, upcoming event schedule, etc. Coming up with a presentation necessitates that the majority of the effort goes into the content and the message you intend to convey. The visuals of a PowerPoint presentation can only be effective if it supplements and supports the story that is being told. Keeping this in mind our experts created Business Management Workflow Automation Dashboard Pictures PDF to reduce the time that goes into designing the presentation. This way, you can concentrate on the message while our designers take care of providing you with the right template for the situation.
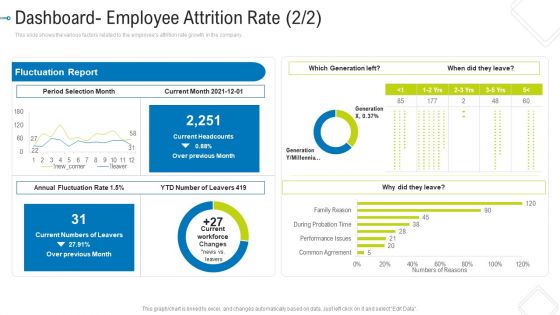
Dashboard Employee Attrition Rate Month Graphics PDF
This slide shows the various factors related to the employees attrition rate growth in the company.Deliver and pitch your topic in the best possible manner with this dashboard employee attrition rate month graphics pdf. Use them to share invaluable insights on fluctuation report, period selection month, annual fluctuation rate and impress your audience. This template can be altered and modified as per your expectations. So, grab it now.
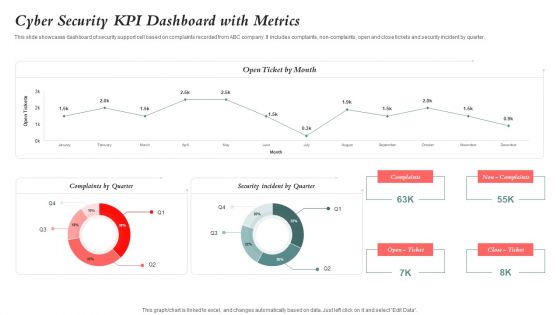
Cyber Security KPI Dashboard With Metrics Microsoft PDF
This slide showcases dashboard of security support cell based on complaints recorded from ABC company. It includes complaints, non complaints, open and close tickets and security incident by quarter. Showcasing this set of slides titled Cyber Security KPI Dashboard With Metrics Microsoft PDF. The topics addressed in these templates are Cyber Security, Kpi Dashboard With Metrics. All the content presented in this PPT design is completely editable. Download it and make adjustments in color, background, font etc. as per your unique business setting.
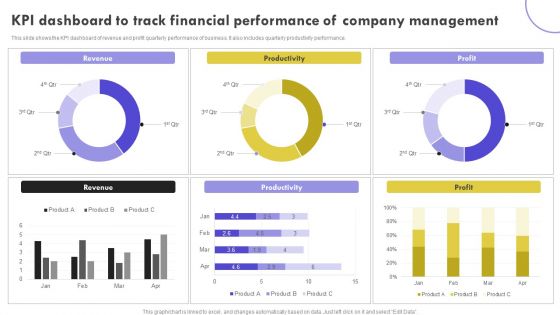
KPI Dashboard To Track Financial Performance Of Company Management Clipart PDF
This slide shows the KPI dashboard of revenue and profit quarterly performance of business. It also includes quarterly productivity performance. Pitch your topic with ease and precision using this KPI Dashboard To Track Financial Performance Of Company Management Clipart PDF. This layout presents information on Revenue, Productivity, Profit. It is also available for immediate download and adjustment. So, changes can be made in the color, design, graphics or any other component to create a unique layout.

Skill Development Training To Strengthen Employee Performance Performance Coaching Dashboard Information PDF
Deliver an awe inspiring pitch with this creative skill development training to strengthen employee performance performance coaching dashboard information pdf bundle. Topics like quarterly team performance, product teams, engineering performance, product team can be discussed with this completely editable template. It is available for immediate download depending on the needs and requirements of the user.

Business Performance Review Dashboard To Measure Overall Business Performance Formats PDF
The following slide highlights a comprehensive quarterly business review QBR dashboard which can be used by the organization to evaluate business performance. The metrics used for review are total revenue, new customers, gross profit, overall costs, sales comparison, sales by different products and top performing channels. Showcasing this set of slides titled Business Performance Review Dashboard To Measure Overall Business Performance Formats PDF. The topics addressed in these templates are Sales Comparison, Sales Product, High Performing. All the content presented in this PPT design is completely editable. Download it and make adjustments in color, background, font etc. as per your unique business setting.
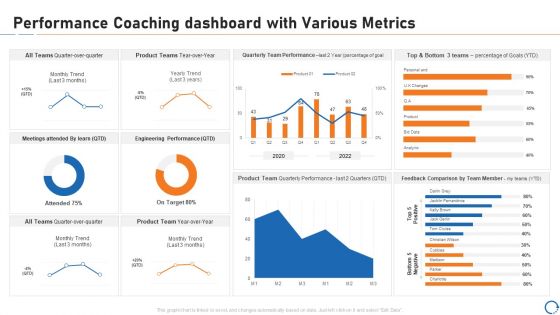
Upskill Training For Employee Performance Improvement Performance Coaching Dashboard With Various Metrics Designs PDF
Deliver an awe inspiring pitch with this creative upskill training for employee performance improvement performance coaching dashboard with various metrics designs pdf bundle. Topics like quarterly team performance, product teams, engineering performance, product team can be discussed with this completely editable template. It is available for immediate download depending on the needs and requirements of the user.
Business New Venture Cost Tracking Dashboard Designs PDF
This slide shows the KPI dashboard of various expenses related to startup . It includes expenses percentage, expenses category and quarterly expenses. Showcasing this set of slides titled Business New Venture Cost Tracking Dashboard Designs PDF. The topics addressed in these templates are Business New Venture, Cost Tracking Dashboard. All the content presented in this PPT design is completely editable. Download it and make adjustments in color, background, font etc. as per your unique business setting.
Marketing And Operation KPI Dashboard To Increase Efficiency Icons PDF
This slide covers sales and operations KPI dashboard to increase efficiency. It involves performance, increase in profit, target, monthly profit and quarterly revenue trend. Pitch your topic with ease and precision using this Marketing And Operation KPI Dashboard To Increase Efficiency Icons PDF. This layout presents information on Profit By Monthly, Target, Performance. It is also available for immediate download and adjustment. So, changes can be made in the color, design, graphics or any other component to create a unique layout.

Term Life Insurance Analytics Plan Claims Dashboard Structure PDF
This slide illustrates claim status of life insurance corporation. It includes yearly claim status pie chart, total claims quarter-wise and total closed claims quarter wise. Pitch your topic with ease and precision using this Term Life Insurance Analytics Plan Claims Dashboard Structure PDF. This layout presents information on Insurance Analytics, Plan Claims Dashboard. It is also available for immediate download and adjustment. So, changes can be made in the color, design, graphics or any other component to create a unique layout.
Project Metrics Dashboard Depicting Tracking System Inspiration PDF
This slide focuses on project management dashboard which covers the four spirit teams, iteration defects by priority with quarterly roadmap with legends such as high attention, low, none, normal and resolved immediately with time in iteration, etc. Pitch your topic with ease and precision using this Project Metrics Dashboard Depicting Tracking System Inspiration PDF. This layout presents information on Project Metrics, Dashboard Depicting, Tracking System. It is also available for immediate download and adjustment. So, changes can be made in the color, design, graphics or any other component to create a unique layout.
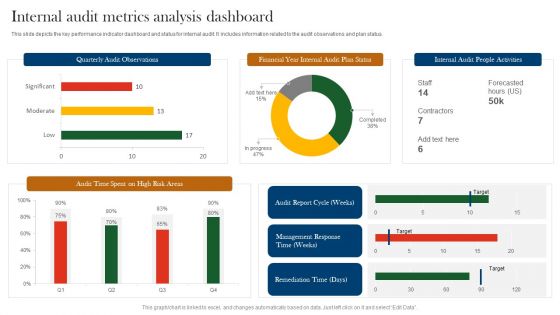
Internal Audit Metrics Analysis Dashboard Ppt Ideas Clipart Images PDF
This slide depicts the key performance indicator dashboard and status for internal audit. It includes information related to the audit observations and plan status. Pitch your topic with ease and precision using this Internal Audit Metrics Analysis Dashboard Ppt Ideas Clipart Images PDF. This layout presents information on Quarterly Audit Observations, Financial Year Internal, Audit Plan Status. It is also available for immediate download and adjustment. So, changes can be made in the color, design, graphics or any other component to create a unique layout.
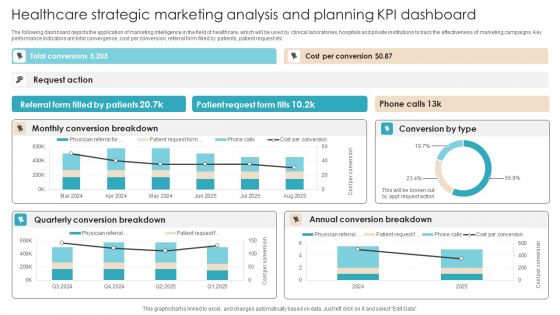
Healthcare Strategic Marketing Analysis And Planning Kpi Dashboard Elements PDF
The following dashboard depicts the application of marketing intelligence in the field of healthcare, which will be used by clinical laboratories, hospitals and private institutions to track the effectiveness of marketing campaigns. Key performance indicators are total convergence, cost per conversion, referral form filled by patients, patient request etc. Showcasing this set of slides titled Healthcare Strategic Marketing Analysis And Planning Kpi Dashboard Elements PDF. The topics addressed in these templates are Quarterly Conversion Breakdown, Annual Conversion Breakdown, Patient Request. All the content presented in this PPT design is completely editable. Download it and make adjustments in color, background, font etc. as per your unique business setting.
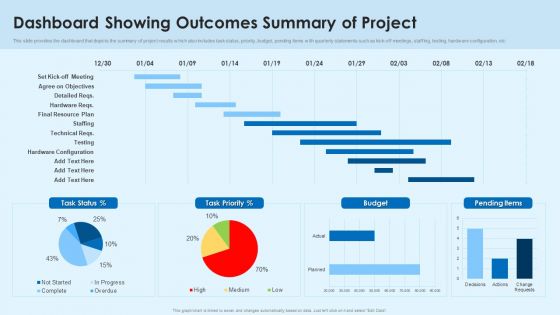
Dashboard Showing Outcomes Summary Of Project Information PDF
This slide provides the dashboard that depicts the summary of project results which also includes task status, priority, budget, pending items with quarterly statements such as kick-off meetings, staffing, testing, hardware configuration, etc.Showcasing this set of slides titled Dashboard Showing Outcomes Summary Of Project Information PDF The topics addressed in these templates are Hardware Configuration, Agree On Objectives, Final Resource All the content presented in this PPT design is completely editable. Download it and make adjustments in color, background, font etc. as per your unique business setting.

KPI Dashboard To Track Pharmaceutical Advertising Progress Topics PDF
Following slide demonstrates KPI dashboard for monitoring marketing impact on pharmaceutical product sales. It includes key components such as sales by states, prescribed drug sales change, non prescribed drug sales changes, quarterly sales, product sales by conditions, etc. Showcasing this set of slides titled KPI Dashboard To Track Pharmaceutical Advertising Progress Topics PDF. The topics addressed in these templates are Product Sales By States, Prescribed Drug Sales, Non Prescribed Drug Sales, Profit By Channel. All the content presented in this PPT design is completely editable. Download it and make adjustments in color, background, font etc. as per your unique business setting.
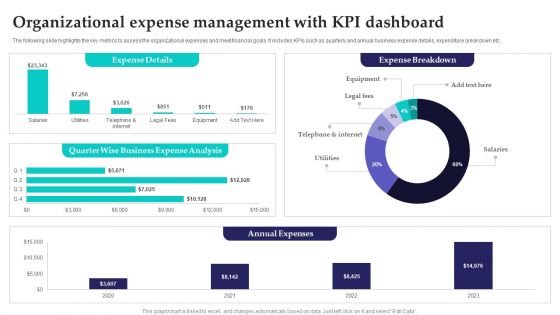
Organizational Expense Management With Kpi Dashboard Slides PDF
The following slide highlights the key metrics to assess the organizational expenses and meet financial goals. It includes KPIs such as quarterly and annual business expense details, expenditure breakdown etc. Showcasing this set of slides titled Organizational Expense Management With Kpi Dashboard Slides PDF. The topics addressed in these templates are Annual Expenses, Expense Details, Expense Breakdown. All the content presented in this PPT design is completely editable. Download it and make adjustments in color, background, font etc. as per your unique business setting.
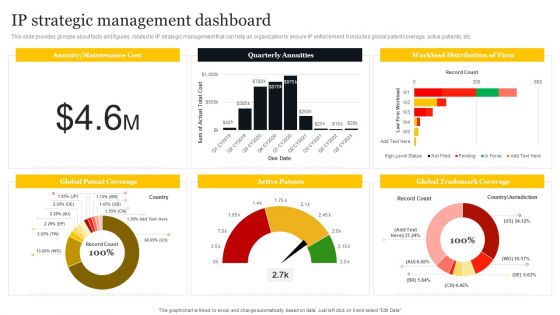
IP Strategic Management Dashboard Ppt PowerPoint Presentation File Example PDF
This slide provides glimpse about facts and figures related to IP strategic management that can help an organization to ensure IP enforcement. It includes global patent coverage, active patients, etc. Showcasing this set of slides titled IP Strategic Management Dashboard Ppt PowerPoint Presentation File Example PDF. The topics addressed in these templates are Quarterly Annuities, Workload Distribution Firm, Active Patents. All the content presented in this PPT design is completely editable. Download it and make adjustments in color, background, font etc. as per your unique business setting.

Term Life Insurance Plan Claims Management Dashboard Portrait PDF
This slide illustrates facts and figures related to status of total claims and closed claims made in an insurance company. It includes yearly claim status pie-chart, total claims quarter-wise and total closed claims quarter-wise. Pitch your topic with ease and precision using this Term Life Insurance Plan Claims Management Dashboard Portrait PDF. This layout presents information on Yearly Claim Status, Total Claims, Quarter Wise. It is also available for immediate download and adjustment. So, changes can be made in the color, design, graphics or any other component to create a unique layout.
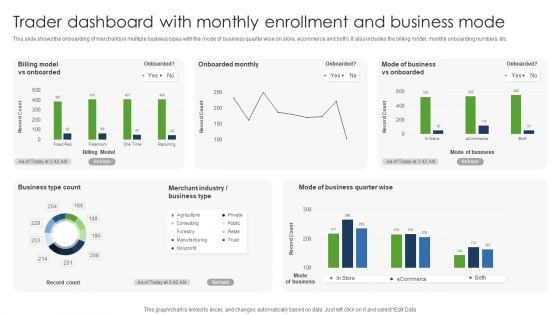
Trader Dashboard With Monthly Enrollment And Business Mode Professional PDF
This slide shows the onboarding of merchants in multiple business types with the mode of business quarter wise in store, ecommerce and both. It also includes the billing model, monthly onboarding numbers, etc. Showcasing this set of slides titled Trader Dashboard With Monthly Enrollment And Business Mode Professional PDF. The topics addressed in these templates are Monthly Enrollment, Business Mode, Trader Dashboard. All the content presented in this PPT design is completely editable. Download it and make adjustments in color, background, font etc. as per your unique business setting.

KPI Dashboard To Monitor Land Asset Management Practices Clipart PDF
Following slide demonstrate KPI dashboard for tracking expenses incurred on real estate asset maintenance and to reduce operational cost. It includes elements such as net income, monthly income and expenses, last quarter rent collection status, rental revenue , budget, etc. Pitch your topic with ease and precision using this KPI Dashboard To Monitor Land Asset Management Practices Clipart PDF. This layout presents information on Revenue, Budget, Income. It is also available for immediate download and adjustment. So, changes can be made in the color, design, graphics or any other component to create a unique layout.
Project Implementation Tactics Dashboard For Performance Tracking Demonstration PDF
The following slide presents dashboard which establishes means to execute , monitor and control projects effectively. It includes information about different quarters and work percentage. Showcasing this set of slides titled Project Implementation Tactics Dashboard For Performance Tracking Demonstration PDF. The topics addressed in these templates are Resource Plan, System Testing, Performance Tracking. All the content presented in this PPT design is completely editable. Download it and make adjustments in color, background, font etc. as per your unique business setting.

Customer Attrition Rate Dashboard For IBN Outsourcing Company Infographics PDF
This slide shows a Customer Attrition Rate Dashboard with KPIs such as Company Revenue , Customer Attrition Rate in 2021 , Annual Growth Rate , Average Customer Queue Time , Onboarding Process Effectiveness etc. This is a customer attrition rate dashboard for ibn outsourcing company infographics pdf template with various stages. Focus and dispense information on eight stages using this creative set, that comes with editable features. It contains large content boxes to add your information on topics like company revenue, annual growth, customer satisfaction, onboarding process, service adoption. You can also showcase facts, figures, and other relevant content using this PPT layout. Grab it now.

Post Employment Interview Feedback Management Dashboard Formats PDF
This slide showcases a dashboard for managing and assessing feedback providing by an employee during exit interview. It includes employee ratings on various questions, number of exits quarterly, response count by each department, etc. Showcasing this set of slides titled Post Employment Interview Feedback Management Dashboard Formats PDF. The topics addressed in these templates are Response Count Department, Response Count Month, Treated Impartially. All the content presented in this PPT design is completely editable. Download it and make adjustments in color, background, font etc. as per your unique business setting.

Progress Summary Strategy Dashboard For Performance Overview Diagrams PDF
The following slide presents progress reporting dashboard establishing means to execute , monitor and control projects effectively. It includes information about different quarters, work percentage, priority, etc. Showcasing this set of slides titled Progress Summary Strategy Dashboard For Performance Overview Diagrams PDF. The topics addressed in these templates are Work Status, Work Priority, Budget Forecast. All the content presented in this PPT design is completely editable. Download it and make adjustments in color, background, font etc. as per your unique business setting.
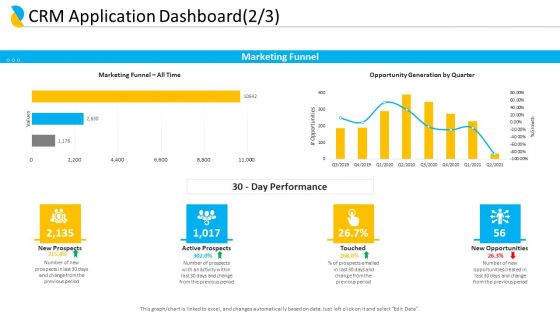
Customer Relationship Management CRM Application Dashboard Opportunities Brochure PDF
Deliver and pitch your topic in the best possible manner with this customer relationship management CRM application dashboard opportunities brochure pdf. Use them to share invaluable insights on marketing funnel, opportunity generation by quarter, active prospects, new opportunities, new prospects and impress your audience. This template can be altered and modified as per your expectations. So, grab it now.

Customer Relationship Management Procedure CRM Application Dashboard Marketing Graphics PDF
Deliver and pitch your topic in the best possible manner with this customer relationship management procedure CRM application dashboard marketing graphics pdf. Use them to share invaluable insights on marketing funnel, opportunity generation by quarter, days performance, new opportunities, active prospects and impress your audience. This template can be altered and modified as per your expectations. So, grab it now.

Staff Turnover Key Performance Indicators Dashboard Sample PDF
The following slide highlights the staff turnover key performance Indicators dashboard illustrating employee turn over, turn over rate, average tenure, turnover per quarter, turnover per department, turnover type, turnover time period, turnover per position and turnover reasons Deliver and pitch your topic in the best possible manner with this Staff Turnover Key Performance Indicators Dashboard Sample PDF Use them to share invaluable insights on Management Goals, Subjective Appraisal, Product Defects and impress your audience. This template can be altered and modified as per your expectations. So, grab it now.
Plan Dashboard For Tracking Location Wise Revenue Diagrams PDF
This slide presents a dashboard which will assist managers to track the revenue of each branch having geographical presence in different corners of the world. The key performance indicators are total revenue, location wise rent, branch performance among many others.Pitch your topic with ease and precision using this Plan Dashboard For Tracking Location Wise Revenue Diagrams PDF. This layout presents information on Taxes Paid, Current Month, Branch Performance, Previous Quarter. It is also available for immediate download and adjustment. So, changes can be made in the color, design, graphics or any other component to create a unique layout.
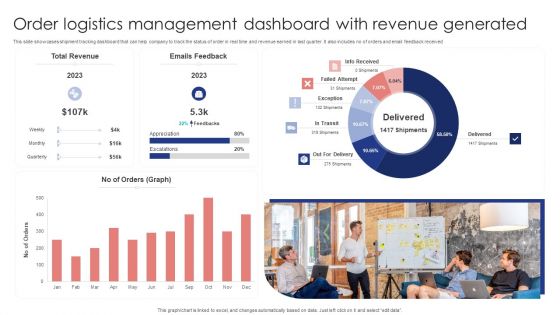
Order Logistics Management Dashboard With Revenue Generated Slides PDF
This slide showcases shipment tracking dashboard that can help company to track the status of order in real time and revenue earned in last quarter. It also includes no of orders and email feedback received. Showcasing this set of slides titled Order Logistics Management Dashboard With Revenue Generated Slides PDF. The topics addressed in these templates are Total Revenue, Emails Feedback, Orders Graph. All the content presented in this PPT design is completely editable. Download it and make adjustments in color, background, font etc. as per your unique business setting.
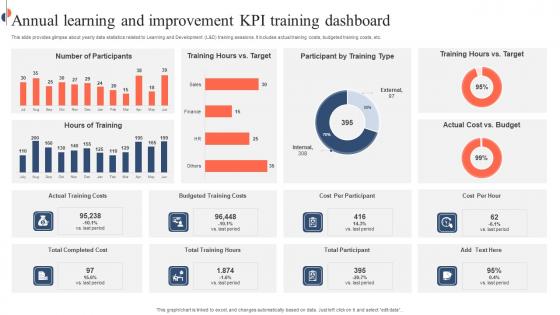
Annual Learning And Improvement KPI Training Dashboard Formats Pdf
This slide provides glimpse about yearly data statistics related to Learning and Development L and D training sessions. It includes actual training costs, budgeted training costs, etc. Showcasing this set of slides titled Annual Learning And Improvement KPI Training Dashboard Formats Pdf. The topics addressed in these templates are Annual Learning, Improvement KPI, Training Dashboard, Budgeted Training Costs. All the content presented in this PPT design is completely editable. Download it and make adjustments in color, background, font etc. as per your unique business setting.

 Home
Home