Financial Snapshot

Investor Pitch Deck Initial Coin Offering Financing We Face Competition From Various Platforms Pictures PDF
The slide provides the name and logos of the companys competitors under different categories, online money transfer platform, banking companies, and other financial service providers. This is a investor pitch deck initial coin offering financing we face competition from various platforms pictures pdf template with various stages. Focus and dispense information on three stages using this creative set, that comes with editable features. It contains large content boxes to add your information on topics like online money transfer platform, banking companies, other financial service providers. You can also showcase facts, figures, and other relevant content using this PPT layout. Grab it now.

Applications Of Quantum Computing Ppt Pictures Templates PDF
This slide represents Quantum computing applications in different sectors such as artificial intelligence and machine learning, drug design and development, cyber security, financial modeling, etc. This is a Applications Of Quantum Computing Ppt Pictures Templates PDF template with various stages. Focus and dispense information on seven stages using this creative set, that comes with editable features. It contains large content boxes to add your information on topics like Financial Modelling, Weather Forecasting, Logistics Optimization, Computational Chemistry. You can also showcase facts, figures, and other relevant content using this PPT layout. Grab it now.
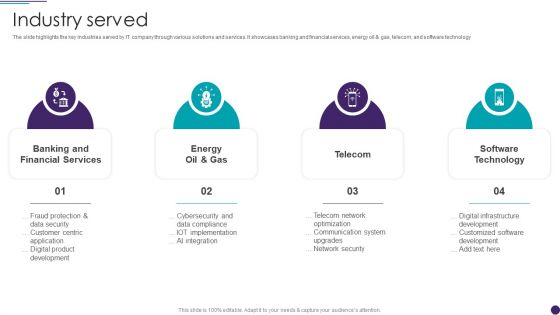
IT Services Business Profile Industry Served Pictures PDF
The slide highlights the key industries served by IT company through various solutions and services. It showcases banking and financial services, energy oil and gas, telecom, and software technology. This is a IT Services Business Profile Industry Served Pictures PDF template with various stages. Focus and dispense information on four stages using this creative set, that comes with editable features. It contains large content boxes to add your information on topics like Banking And Financial Services, Software Technology, Communication System. You can also showcase facts, figures, and other relevant content using this PPT layout. Grab it now.

Pharmaceutical And Clinical Research Summary Management Team Pictures PDF
The slide depicts the leadership and management team of organization. It depicts managing director, founder, chief financial officer, chief executive officer, and executive director of sales and marketing. This is a Pharmaceutical And Clinical Research Summary Management Team Pictures PDF template with various stages. Focus and dispense information on seven stages using this creative set, that comes with editable features. It contains large content boxes to add your information on topics like Chief Financial Officer, Executive Director Sales, Pharmacy Business. You can also showcase facts, figures, and other relevant content using this PPT layout. Grab it now.
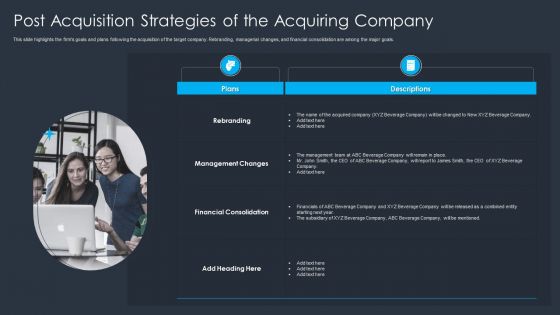
Post Acquisition Strategies Of The Acquiring Company Pictures PDF
This slide highlights the firms goals and plans following the acquisition of the target company. Rebranding, managerial changes, and financial consolidation are among the major goals. This is a Post Acquisition Strategies Of The Acquiring Company Pictures PDF template with various stages. Focus and dispense information on two stages using this creative set, that comes with editable features. It contains large content boxes to add your information on topics like Management Changes, Financial Consolidation, Plans. You can also showcase facts, figures, and other relevant content using this PPT layout. Grab it now.

Leading And Lagging Indicators Balanced Scorecard Pictures PDF
This slide showcase a balanced scorecard that enable managers to track leading lagging performance metric to improve their internal operations. It incorporates financial, customer, internal and learning and growth indicators of a organization. Pitch your topic with ease and precision using this Leading And Lagging Indicators Balanced Scorecard Pictures PDF. This layout presents information on Financial Indicator, Customer Indicator, Internal Indicator, Growth Indicator. It is also available for immediate download and adjustment. So, changes can be made in the color, design, graphics or any other component to create a unique layout.

Cognitive Computing Action Plan Implementing Cognitive Computing Solutions Ppt Professional Picture PDF
This slide provides information regarding pragmatic application of cognitive computing solution in various sectors such as agriculture, financial services, manufacturing, medical. Presenting cognitive computing action plan implementing cognitive computing solutions ppt professional picture pdf to provide visual cues and insights. Share and navigate important information on four stages that need your due attention. This template can be used to pitch topics like agriculture, financial services, manufacturing, medical. In addtion, this PPT design contains high resolution images, graphics, etc, that are easily editable and available for immediate download.
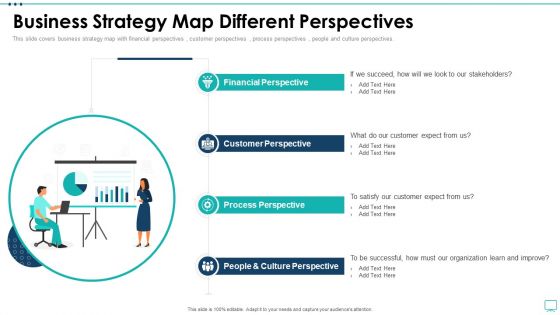
Strategic Business Plan Effective Tools Business Strategy Map Different Perspectives Ppt Show Pictures PDF
This slide covers business strategy map with financial perspectives customer perspectives process perspectives people and culture perspectives. Presenting strategic business plan effective tools business strategy map different perspectives ppt show pictures pdf to provide visual cues and insights. Share and navigate important information on four stages that need your due attention. This template can be used to pitch topics like financial perspective customer perspective process perspective people and culture perspective. In addtion this PPT design contains high resolution images graphics etc that are easily editable and available for immediate download.
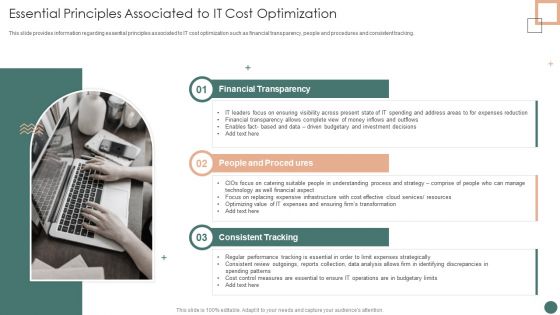
Improved Digital Expenditure Essential Principles Associated To IT Cost Optimization Pictures PDF
This slide provides information regarding essential principles associated to IT cost optimization such as financial transparency, people and procedures and consistent tracking. This is a Improved Digital Expenditure Essential Principles Associated To IT Cost Optimization Pictures PDF template with various stages. Focus and dispense information on three stages using this creative set, that comes with editable features. It contains large content boxes to add your information on topics like Financial Transparency, Consistent Tracking, People Proceed. You can also showcase facts, figures, and other relevant content using this PPT layout. Grab it now.
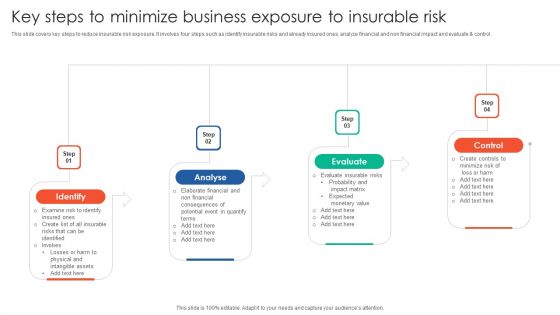
Key Steps To Minimize Business Exposure To Insurable Risk Pictures PDF
This slide covers key steps to reduce insurable risk exposure. It involves four steps such as identify insurable risks and already insured ones, analyze financial and non financial impact and evaluate and control. Persuade your audience using this Key Steps To Minimize Business Exposure To Insurable Risk Pictures PDF. This PPT design covers four stages, thus making it a great tool to use. It also caters to a variety of topics including Identify, Analyse, Evaluate, Control. Download this PPT design now to present a convincing pitch that not only emphasizes the topic but also showcases your presentation skills.
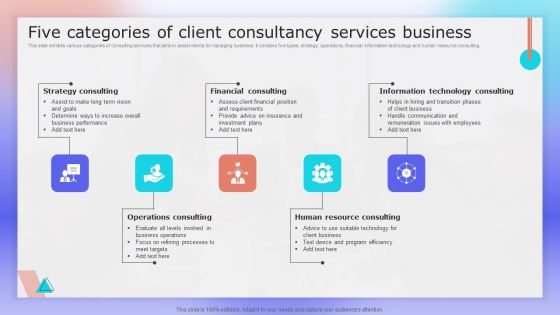
Five Categories Of Client Consultancy Services Business Ppt Pictures Deck PDF
This slide exhibits various categories of consulting services that aims to assist clients for managing business. It contains five types strategy, operations, financial, information technology and human resource consulting. Persuade your audience using this Five Categories Of Client Consultancy Services Business Ppt Pictures Deck PDF. This PPT design covers five stages, thus making it a great tool to use. It also caters to a variety of topics including Strategy Consulting, Financial Consulting, Information Technology Consulting . Download this PPT design now to present a convincing pitch that not only emphasizes the topic but also showcases your presentation skills.

90 Days Employee Onboarding Plan Of CFO Ppt Layouts Shapes PDF
This slide contains the 90 days onboarding plan for the companys financial officer. It includes the tasks that CFO has to complete and make sure that the mentioned activities will take place correctly to ensure financial stability in the company. Persuade your audience using this 90 Days Employee Onboarding Plan Of CFO Ppt Layouts Shapes PDF. This PPT design covers three stages, thus making it a great tool to use. It also caters to a variety of topics including Key Responsibilities, Cost Reduction, Meticulous Monitoring. Download this PPT design now to present a convincing pitch that not only emphasizes the topic but also showcases your presentation skills.

Five Components Of Business Summary For Investors Summary PDF
This slide shows information to include in investor reports that helps in decision making and understand company value. It includes various components such as financial package, KPIs, cost drivers, budget forecast and growth opportunities.Presenting Five Components Of Business Summary For Investors Summary PDF to dispense important information. This template comprises five stages. It also presents valuable insights into the topics including Financial Package, Performance Indicators, Budget Forecast. This is a completely customizable PowerPoint theme that can be put to use immediately. So, download it and address the topic impactfully.
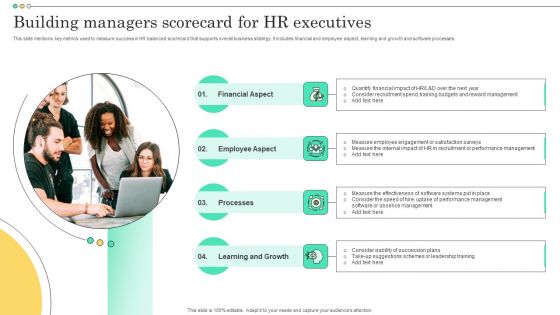
Building Managers Scorecard For HR Executives Ideas PDF

ML Business Applications In Finance Business Guidelines PDF
This slide illustrates machine learning applications in finance industry which assist organizations in automating tasks and recommend right financial products at appropriate timing. This slide contains information about ways of machine learning such as chatbots, financial monitoring, fraud detection, etc. Persuade your audience using this ML Business Applications In Finance Business Guidelines PDF. This PPT design covers six stages, thus making it a great tool to use. It also caters to a variety of topics including Automation, Risk Analysis, Data Management. Download this PPT design now to present a convincing pitch that not only emphasizes the topic but also showcases your presentation skills.
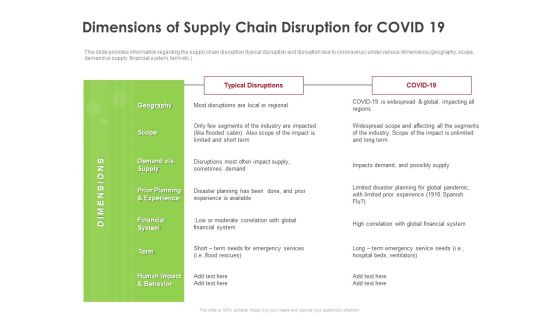
COVID 19 Risk Analysis Mitigation Policies Ocean Liner Sector Dimensions Of Supply Chain Disruption For COVID 19 Pictures PDF
This slide provides information regarding the supply chain disruption typical disruption and disruption due to coronavirus under various dimensions geography, scope, demand vs supply, financial system, term etc. Deliver an awe inspiring pitch with this creative covid 19 risk analysis mitigation policies ocean liner sector dimensions of supply chain disruption for covid 19 pictures pdf bundle. Topics like planning, global, services, financial, supply can be discussed with this completely editable template. It is available for immediate download depending on the needs and requirements of the user.
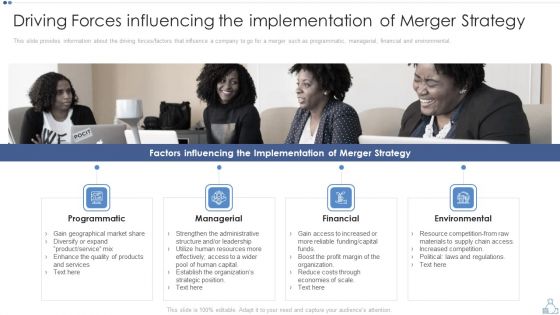
Partnership Tactical Plan To Promote Expansion And Value Formation Driving Forces Influencing The Implementation Of Merger Strategy Pictures PDF
This slide provides information about the driving forces or factors that influence a company to go for a merger such as programmatic, managerial, financial and environmental. Presenting partnership tactical plan to promote expansion and value formation driving forces influencing the implementation of merger strategy pictures pdf to provide visual cues and insights. Share and navigate important information on four stages that need your due attention. This template can be used to pitch topics like programmatic, managerial, financial, environmental. In addtion, this PPT design contains high resolution images, graphics, etc, that are easily editable and available for immediate download.

Project Management Dashboard Budget Ppt PowerPoint Presentation Slides Templates
This is a project management dashboard budget ppt powerpoint presentation slides templates. This is a two stage process. The stages in this process are finanace, management, strategy, analysis, marketing.
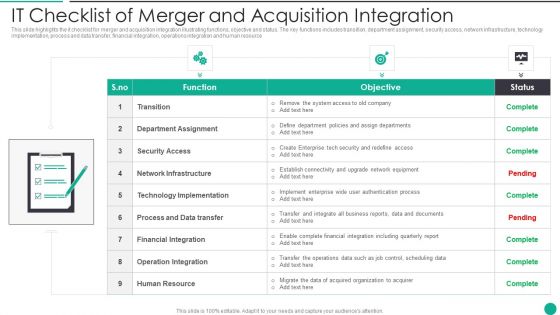
IT Checklist Of Merger And Acquisition Integration Designs PDF
This slide highlights the it checklist for merger and acquisition integration illustrating functions, objective and status. The key functions includes transition, department assignment, security access, network infrastructure, technology implementation, process and data transfer, financial integration, operations integration and human resource Presenting IT Checklist Of Merger And Acquisition Integration Designs PDF to dispense important information. This template comprises one stage. It also presents valuable insights into the topics including Department Assignment, Financial Integration, Operation Integration This is a completely customizable PowerPoint theme that can be put to use immediately. So, download it and address the topic impactfully.

Audit Committee Plan Timeline With Vendor Evaluation Ppt PowerPoint Presentation Gallery Mockup PDF
This slide shows the monthly process schedule to be followed by audit committee which covers processes such as incoming inspection, production, quality control inspection, management review, vendor evaluation, managing internal audits, financial data analysis, etc. Showcasing this set of slides titled audit committee plan timeline with vendor evaluation ppt powerpoint presentation gallery mockup pdf. The topics addressed in these templates are financial data analysis, vendor evaluation, management review. All the content presented in this PPT design is completely editable. Download it and make adjustments in color, background, font etc. as per your unique business setting.

Six Online Marketing For Ecommerce Businesses Strategies For Hotels To Increase Customer Rules PDF
This slide covers six ecommerce strategies to increase customers for hospitality sector. This includes strategies such as use high resolution photos, build your credibility, make it extremely easy to book room in hotel, make your website easy to navigate, website is mobile friendly and secure for financial transactions. Showcasing this set of slides titled six online marketing for ecommerce businesses strategies for hotels to increase customer rules pdf. The topics addressed in these templates are build credibility, financial transactions, resolution photos. All the content presented in this PPT design is completely editable. Download it and make adjustments in color, background, font etc. as per your unique business setting.

Ppt Colorful Arrows PowerPoint Slide Text Explaining Seven Aspects Templates
PPT colorful arrows powerpoint slide text explaining seven aspects Templates-Arrows PowerPoint Diagram is nice for financial PowerPoint Diagram presentations as well as other analysis or business PowerPoint diagram needs. Use this graphical approach to represent global business issues such as financial data, stock market Exchange, increase in sales, corporate presentations and more.-PPT colorful arrows powerpoint slide text explaining seven aspects Templates-analysis, arrow, background, business, chart, communication, concept, construction, delivery, design, development, engineering, fabrication, feasibiliti, generated, growth, idea, industry, making, production, products, science, sequence, shape
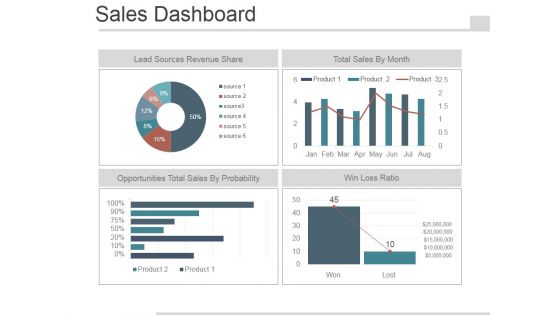
Sales Dashboard Slide Template 2 Ppt PowerPoint Presentation Images
This is a sales dashboard slide template 2 ppt powerpoint presentation images. This is a four stage process. The stages in this process are lead sources revenue share, total sales by month, opportunities total sales by probability, win loss ratio.
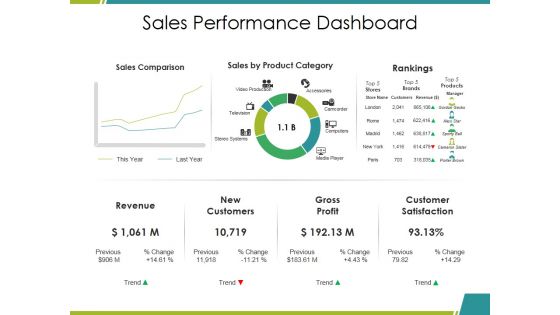
Sales Performance Dashboard Ppt PowerPoint Presentation Infographics Mockup
This is a sales performance dashboard ppt powerpoint presentation infographics mockup. This is a three stage process. The stages in this process are sales comparison, sales by product category, rankings, revenue, gross profit.
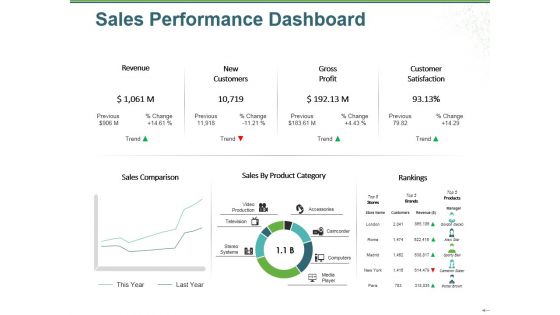
Sales Performance Dashboard Ppt PowerPoint Presentation Outline File Formats
This is a sales performance dashboard ppt powerpoint presentation outline file formats. This is a three stage process. The stages in this process are revenue, new customers, gross profit, customer satisfaction, rankings.

Sales Performance Dashboard Top Opportunities Ppt PowerPoint Presentation Layouts Template
This is a sales performance dashboard top opportunities ppt powerpoint presentation layouts template. This is a eight stage process. The stages in this process are revenue, new customer, gross profit, customer satisfaction, brand profitability.
Metrics Scorecard With Internal Objectives And Customer Satisfaction Icons PDF
The purpose of this slide is to showcase different KPIs for company business. Information covered in this slide is related to financial status, business growth, internal objectives and customer satisfaction. Showcasing this set of slides titled Metrics Scorecard With Internal Objectives And Customer Satisfaction Icons PDF. The topics addressed in these templates are Financial Status, Customer Satisfaction, Internal Objectives. All the content presented in this PPT design is completely editable. Download it and make adjustments in color, background, font etc. as per your unique business setting.
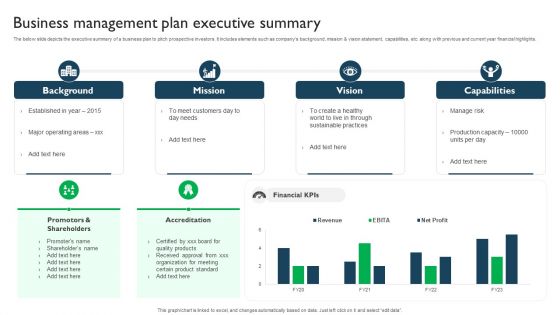
Business Management Plan Executive Summary Elements PDF
The below slide depicts the executive summary of a business plan to pitch prospective investors. It includes elements such as companys background, mission and vision statement, capabilities, etc. along with previous and current year financial highlights. Showcasing this set of slides titled Business Management Plan Executive Summary Elements PDF. The topics addressed in these templates are Quality Products, Organization, Financial Kpis. All the content presented in this PPT design is completely editable. Download it and make adjustments in color, background, font etc. as per your unique business setting.
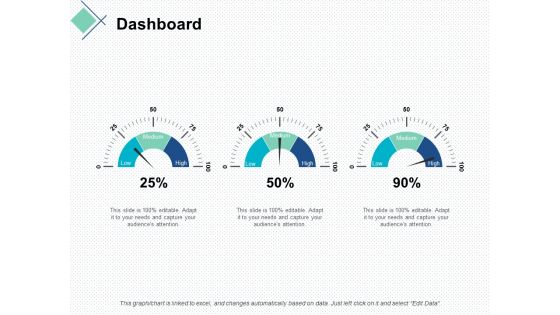
dashboard marketing business ppt powerpoint presentation gallery slide portrait
This is a dashboard marketing business ppt powerpoint presentation gallery slide portrait. This is a three stage process. The stages in this process are finance, marketing, management, investment, analysis.

Ppt Arrows PowerPoint 2010 Pointing Vertical Downwards Templates
PPT arrows powerpoint 2010 pointing vertical downwards Templates-Arrows PowerPoint Diagram is nice for financial PowerPoint Diagram presentations as well as other analysis or business PowerPoint diagram needs. Use this graphical approach to represent global business issues such as financial data, stock market Exchange, increase in sales, corporate presentations and more.-PPT arrows powerpoint 2010 pointing vertical downwards Templates-advertising, arrow, bend, black, blue, bookmark, business, collection, control, corner, curl, customer, design, down, element, gold, green, icon, illustration, label, mark, marketing, message, new, origami, paper, product, service, set, shadow, shiny, shop, sign, site, sticker, symbol, tag
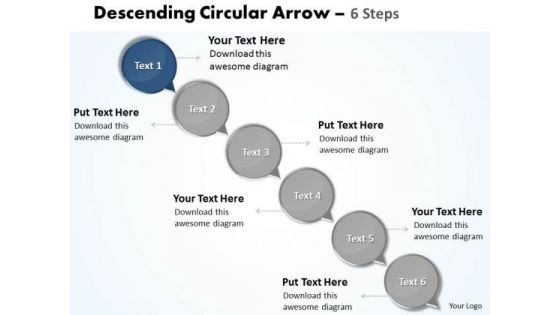
Ppt Animate Text PowerPoint 2007 Circles Downward Arrow 6 Steps Business Templates
PPT animate text powerpoint 2007 circles downward arrow 6 steps Business Templates-Arrows PowerPoint Diagram is nice for financial PowerPoint Diagram presentations as well as other analysis or business PowerPoint diagram needs. Use this graphical approach to represent global business issues such as financial data, stock market Exchange, increase in sales, corporate presentations and more.-PPT animate text powerpoint 2007 circles downward arrow 6 steps Business Templates-Add, Aqua, Arrows, Badges, Bar, Blend, Blue, Bright, Bubbles, Buttons, Caution, Circle, Drop, Elements, Glossy, Glowing, Graphic, Heart, Help, Icons, Idea, Illustration, Navigation, Oblong, Plus, Round, Service, Shadow, Shiny, Sign, Speech, Squares
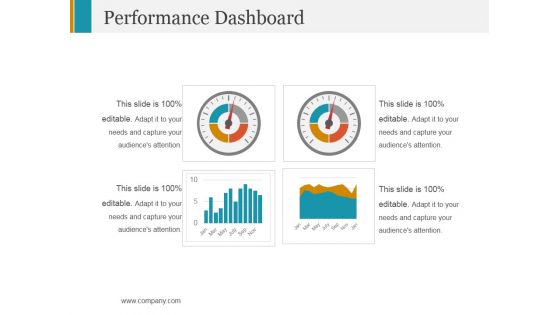
Performance Dashboard Template 2 Ppt PowerPoint Presentation Model Format
This is a performance dashboard template 2 ppt powerpoint presentation model format. This is a four stage process. The stages in this process are dashboard, finance, business, marketing.

Sales Dashboard Slide Template 1 Ppt PowerPoint Presentation Layouts
This is a sales dashboard slide template 1 ppt powerpoint presentation layouts. This is a three stage process. The stages in this process are business, marketing, product, year.
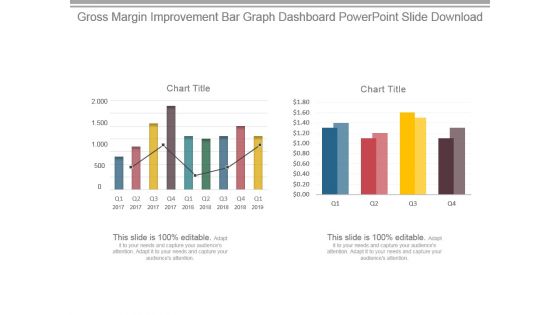
Gross Margin Improvement Bar Graph Dashboard Powerpoint Slide Download
This is a gross margin improvement bar graph dashboard powerpoint slide download. This is a two stage process. The stages in this process are chart title.
Labour Effectiveness Dashboard Ppt PowerPoint Presentation Icon Vector
This is a labour effectiveness dashboard ppt powerpoint presentation icon vector.This is a three stage process. The stages in this process are finance, marketing, management, investment, analysis.

Project Management Dashboard Planning Ppt PowerPoint Presentation Ideas Graphics Design
This is a project management dashboard planning ppt powerpoint presentation ideas graphics design. This is a four stage process. The stages in this process are business, management, marketing, percentage.
Project Management Dashboard Testing Ppt PowerPoint Presentation Icon File Formats
This is a project management dashboard testing ppt powerpoint presentation icon file formats. This is a three stage process. The stages in this process are business, management, marketing, percentage.
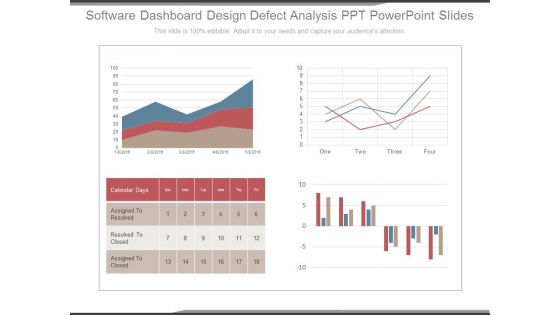
Software Dashboard Design Defect Analysis Ppt Powerpoint Slides
This is a software dashboard design defect analysis ppt powerpoint slides. This is a four stage process. The stages in this process are calendar days, assigned to resolved, resolved to closed, assigned to closed.
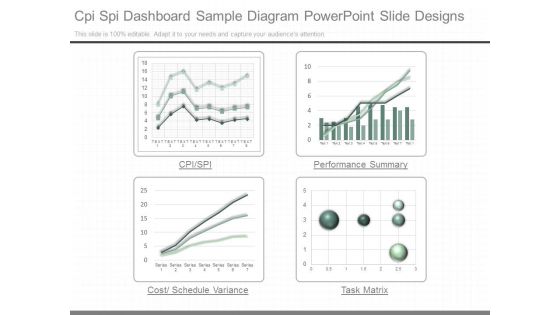
Cpi Spi Dashboard Sample Diagram Powerpoint Slide Designs
This is a cpi spi dashboard sample diagram powerpoint slide designs. This is a four stage process. The stages in this process are cpi spi, performance summary, cost schedule variance, task matrix.

Employee Engagement Dashboard Ppt PowerPoint Presentation Professional File Formats
This is a employee engagement dashboard ppt powerpoint presentation professional file formats. This is a four stage process. The stages in this process are finance, marketing, management, investment, analysis.

Retail Kpi Dashboard Showing Revenue Vs Units Sold Ppt PowerPoint Presentation File Formats
This is a retail kpi dashboard showing revenue vs units sold ppt powerpoint presentation file formats. This is a three stage process. The stages in this process are finance, marketing, management, investment, analysis.

Business Review And Performance Assessment Dashboards Ppt PowerPoint Presentation Infographics Show
This is a business review and performance assessment dashboards ppt powerpoint presentation infographics show. This is a four stage process. The stages in this process are year in review, yearly highlights, countdowns.

Retail Kpi Dashboard Showing Revenue Vs Units Sold Top 5 Product Categories Ppt PowerPoint Presentation Layouts Designs Download
This is a retail kpi dashboard showing revenue vs units sold top 5 product categories ppt powerpoint presentation layouts designs download. This is a four stage process. The stages in this process are finance, strategy, analysis, marketing.
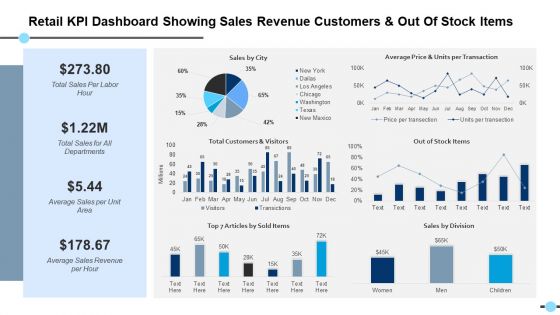
Retail Kpi Dashboard Showing Sales Revenue Customers And Out Of Stock Items Out Of Stock Items Ppt PowerPoint Presentation Files
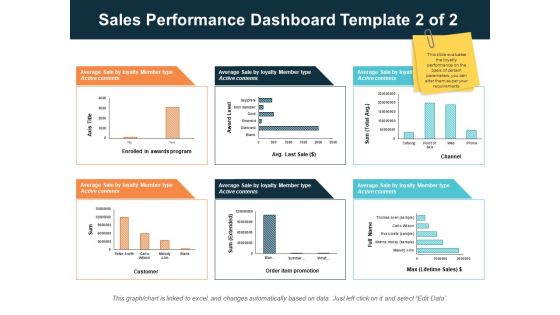
Sales Performance Dashboard Template 2 Of 2 Ppt PowerPoint Presentation Infographics Design Inspiration
This is a sales performance dashboard template 2 of 2 ppt powerpoint presentation infographics design inspiration. This is a three stage process. The stages in this process are finance, management, strategy, analysis, marketing.
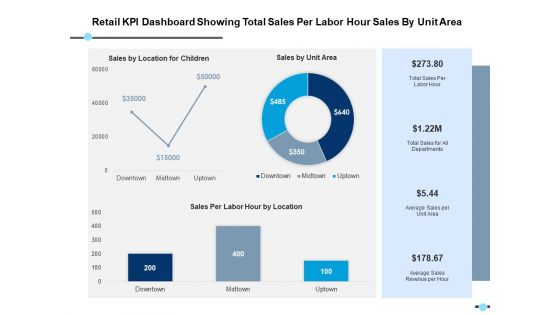
Retail Kpi Dashboard Showing Total Sales Per Labor Hour Sales By Unit Area Ppt PowerPoint Presentation Model Format
This is a retail kpi dashboard showing total sales per labor hour sales by unit area ppt powerpoint presentation model format. This is a three stage process. The stages in this process are finance, strategy, analysis, marketing.
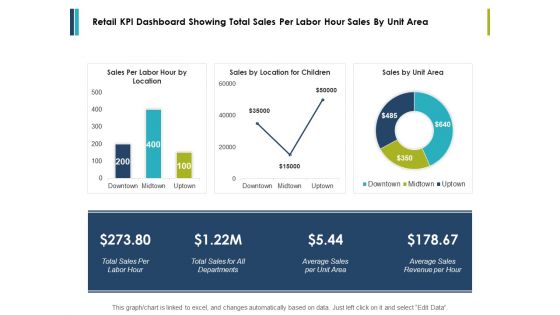
Retail Kpi Dashboard Showing Total Sales Per Labor Hour Sales By Unit Area Ppt PowerPoint Presentation Styles Influencers
This is a retail kpi dashboard showing total sales per labor hour sales by unit area ppt powerpoint presentation styles influencers. This is a three stage process. The stages in this process are finance, marketing, management, investment, analysis.
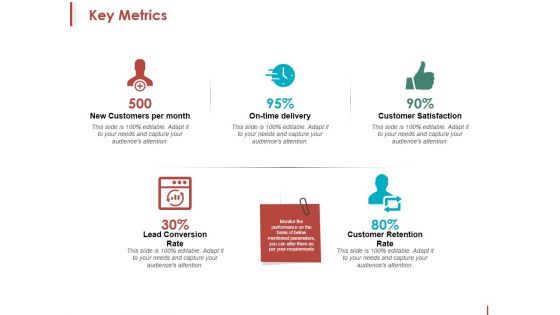
Key Metrics Ppt PowerPoint Presentation Inspiration Format
This is a key metrics ppt powerpoint presentation inspiration format. This is a five stage process. The stages in this process are new customers per month, on time delivery, customer satisfaction, customer retention rate.

Agency Performance Ppt PowerPoint Presentation Layout
This is a agency performance ppt powerpoint presentation layout. This is a four stage process. The stages in this process are tra score, viewability, industry snapshot, brand safety, ad fraud.
Data Research And Analysis For Mobile Users Ppt PowerPoint Presentation Icon Inspiration
This is a data research and analysis for mobile users ppt powerpoint presentation icon inspiration. This is a four stage process. The stages in this process are mobile analytics, mobile tracking, mobile web analytics.

Investigation For Business Procurement Litigation Kpis Ppt Pictures Structure PDF
This is a investigation for business procurement litigation kpis ppt pictures structure pdf. template with various stages. Focus and dispense information on three stages using this creative set, that comes with editable features. It contains large content boxes to add your information on topics like average cost per lawsuit, average legal opinion response time. You can also showcase facts, figures, and other relevant content using this PPT layout. Grab it now.
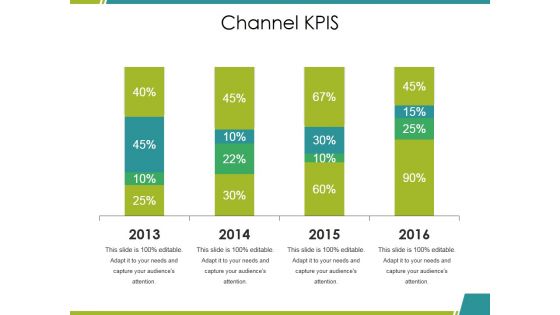
Channel Kpis Ppt PowerPoint Presentation Inspiration Aids
This is a channel kpis ppt powerpoint presentation inspiration aids. This is a four stage process. The stages in this process are business, marketing, graph, percentage, finance.
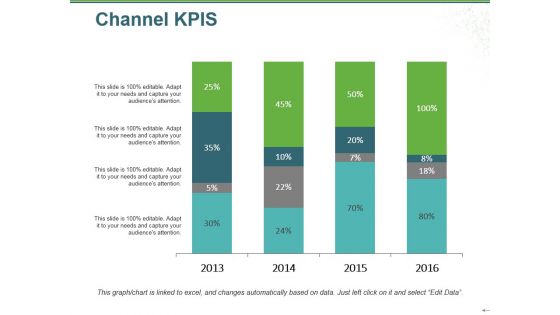
Channel Kpis Ppt PowerPoint Presentation Model Smartart
This is a channel kpis ppt powerpoint presentation model smartart. This is a four stage process. The stages in this process are business, marketing, finance, years, percentage.
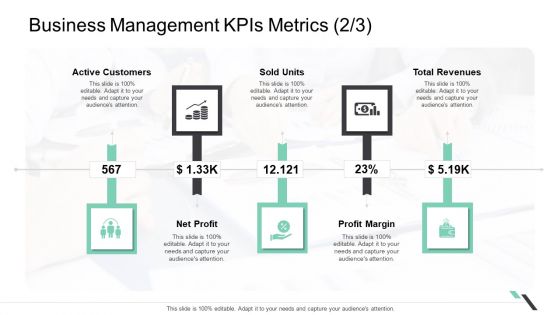
Business Management Kpis Metrics Net Profit Ppt Show Structure PDF
Presenting business management kpis metrics net profit ppt show structure pdf. to provide visual cues and insights. Share and navigate important information on five stages that need your due attention. This template can be used to pitch topics like active customers sold units, total revenues, profit margin, net profit. In addtion, this PPT design contains high resolution images, graphics, etc, that are easily editable and available for immediate download.
Bar Graph Icon For Research Analysis Ppt PowerPoint Presentation Summary Portfolio
Presenting this set of slides with name bar graph icon for research analysis ppt powerpoint presentation summary portfolio. This is a three stage process. The stages in this process are data visualization icon, research analysis, business focus. This is a completely editable PowerPoint presentation and is available for immediate download. Download now and impress your audience.
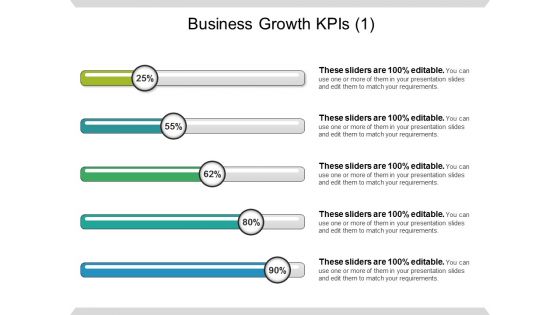
Business Growth Kpis Ppt PowerPoint Presentation File Good
This is a business growth kpis ppt powerpoint presentation file good. This is a five stage process. The stages in this process are cost reduction strategies.
Data Representation Vector Icon Ppt PowerPoint Presentation Infographic Template Samples
Presenting this set of slides with name data representation vector icon ppt powerpoint presentation infographic template samples. This is a one stage process. The stages in this process are data visualization icon, research analysis, business focus. This is a completely editable PowerPoint presentation and is available for immediate download. Download now and impress your audience.

Retail Outlet Operational Efficiency Analytics Solutions To Mitigate Retail Store Inventory Pictures PDF
This slide tabulates the solutions to mitigate operational challenges of retail store inventory such as deploying a centralized tracking system, using past data, cataloging perishable goods, etc. Presenting Retail Outlet Operational Efficiency Analytics Solutions To Mitigate Retail Store Inventory Pictures PDF to provide visual cues and insights. Share and navigate important information on two stages that need your due attention. This template can be used to pitch topics like Challenges, Recommended Solutions, Realtime Tracking. In addtion, this PPT design contains high resolution images, graphics, etc, that are easily editable and available for immediate download.
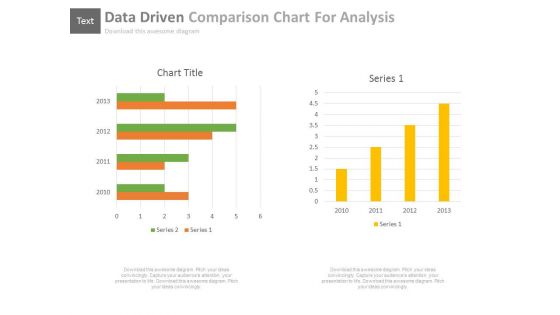
Data Driven Comparison Charts For Analysis Powerpoint Slides
You can download this PowerPoint template to display statistical data and analysis. This PPT slide contains data driven comparison charts. Draw an innovative business idea using this professional diagram.
Data Analysis Vector Icons Ppt Powerpoint Presentation Layouts Gridlines
This is a data analysis vector icons ppt powerpoint presentation layouts gridlines. This is a two stage process. The stages in this process are data presentation, content presentation, information presentation.

 Home
Home