Financial Snapshot
Process Performance Leading Indicators Powerpoint Graphics
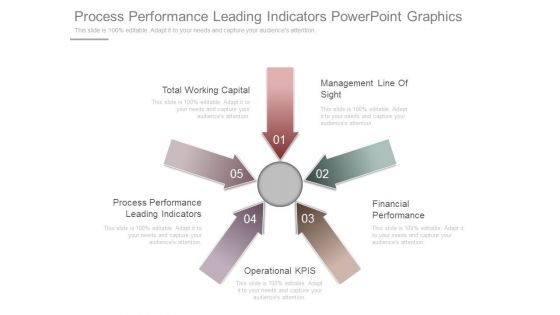
This is a process performance leading indicators powerpoint graphics. This is a five stage process. The stages in this process are total working capital, management line of sight, process performance leading indicators, financial performance, operational kpis.
Management Team Template 1 Ppt PowerPoint Presentation Pictures
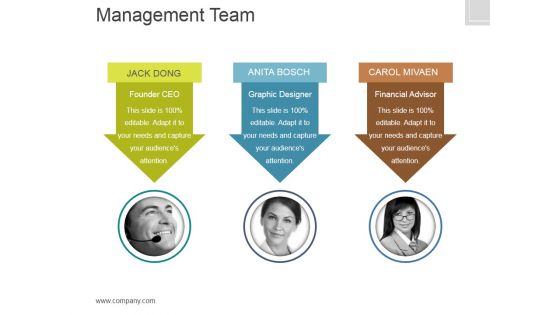
This is a management team template 1 ppt powerpoint presentation pictures. This is a three stage process. The stages in this process are founder ceo, graphic designer, financial advisor.

Types Of Audit Procedure Ppt PowerPoint Presentation Pictures
This is a types of audit procedure ppt powerpoint presentation pictures. This is a five stage process. The stages in this process are financial statements audit, operational audits, forensic audits, compliance audits, comprehensive audits.
Management Team Template 1 Ppt PowerPoint Presentation Pictures Templates
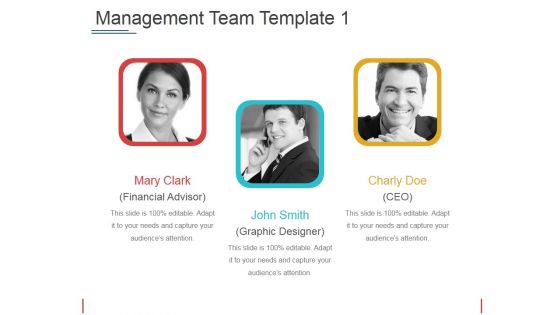
This is a management team template 1 ppt powerpoint presentation pictures templates. This is a three stage process. The stages in this process are mary clark, john smith, charly doe, graphic designer, financial advisor.
Scatter Bubble Chart Ppt PowerPoint Presentation Summary Pictures
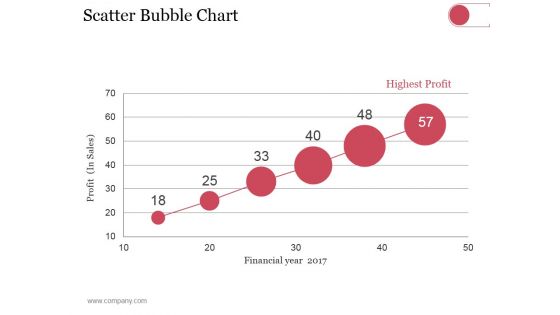
This is a scatter bubble chart ppt powerpoint presentation summary pictures. This is a six stage process. The stages in this process are highest profit, financial year, profit in sales.
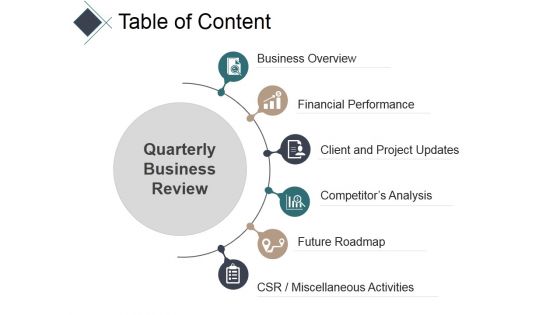
Table Of Content Ppt PowerPoint Presentation Pictures Example
This is a table of content ppt powerpoint presentation pictures example. This is a six stage process. The stages in this process are business overview, financial performance, client and project updates, competitors analysis, future roadmap.

Table Of Content Template 2 Ppt PowerPoint Presentation Pictures Vector
This is a table of content template 2 ppt powerpoint presentation pictures vector. This is a six stage process. The stages in this process are business overview, financial performance, client and project updates, competitor s analysis, future roadmap.
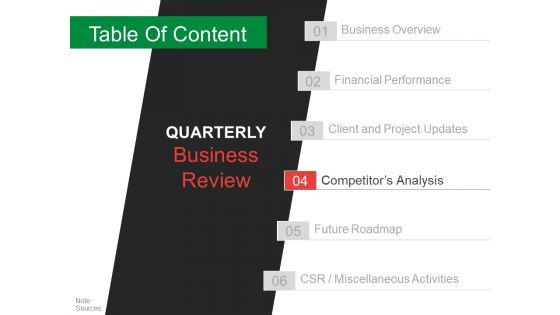
Table Of Content Template 5 Ppt PowerPoint Presentation Styles Picture
This is a table of content template 5 ppt powerpoint presentation styles picture. This is a six stage process. The stages in this process are business overview, financial performance, client and project updates, competitor s analysis, future roadmap.

Scatter Bubble Chart Ppt PowerPoint Presentation Professional Graphics Pictures
This is a scatter bubble chart ppt powerpoint presentation professional graphics pictures. This is a one stage process. The stages in this process are profit in sales, financial year, highest profit, product.

Market Competitiveness Template 2 Ppt PowerPoint Presentation Pictures Elements
This is a market competitiveness template 2 ppt powerpoint presentation pictures elements. This is a three stage process. The stages in this process are financial position, advertising, market share, brand image, customer loyalty.
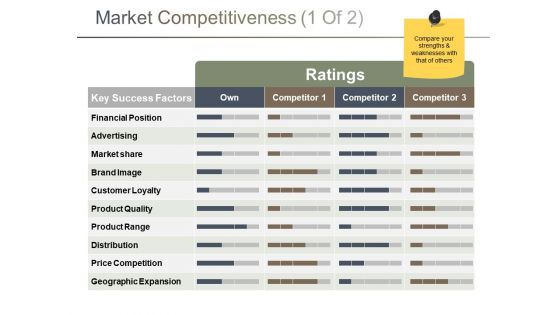
Market Competitiveness Template 1 Ppt PowerPoint Presentation Pictures Vector
This is a market competitiveness template 1 ppt powerpoint presentation pictures vector. This is a three stage process. The stages in this process are financial position, advertising, market share, brand image, customer loyalty.

Our Team Template 1 Ppt PowerPoint Presentation Pictures Example File
This is a our team template 1 ppt powerpoint presentation pictures example file. This is a four stage process. The stages in this process are ceo, financial advisor, designer, manager.

Business Overview Ppt PowerPoint Presentation File Graphics Pictures
This is a business overview ppt powerpoint presentation file graphics pictures. This is a six stage process. The stages in this process are highlights, financial highlights, product offering, our team, quarter track record.

Bar Diagram Ppt PowerPoint Presentation Pictures Background Image
This is a bar diagram ppt powerpoint presentation pictures background image. This is a three stage process. The stages in this process are financial in years, sales in percentage, bar graph, growth, success.

Table Of Content Template 1 Ppt PowerPoint Presentation Pictures Guidelines
This is a table of content template 1 ppt powerpoint presentation pictures guidelines. This is a six stage process. The stages in this process are business overview, financial performance, client and project updates, future roadmap, miscellaneous activities.
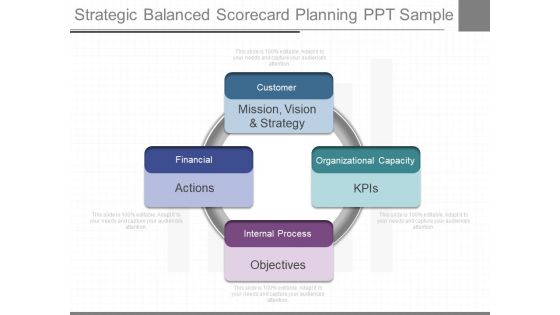
Strategic Balanced Scorecard Planning Ppt Sample
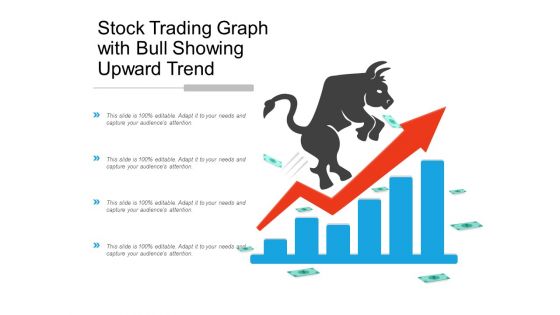
Stock Trading Graph With Bull Showing Upward Trend Ppt Powerpoint Presentation Pictures Outfit
This is a stock trading graph with bull showing upward trend ppt powerpoint presentation pictures outfit. This is a four stage process. The stages in this process are stock market, financial market, bull market.

Types Of Investment Detailed Investment Options Ppt PowerPoint Presentation Pictures Graphics Tutorials
This is a types of investment detailed investment options ppt powerpoint presentation pictures graphics tutorials. This is a eight stage process. The stages in this process are financial investment, planned investment, gross investment, induced investment, process.

Table Of Content Template 6 Ppt PowerPoint Presentation Pictures File Formats
This is a table of content template 1 ppt powerpoint presentation outline template. This is a six stage process. The stages in this process are business overview, financial performance, client and project updates, competitor s analysis, future roadmap.
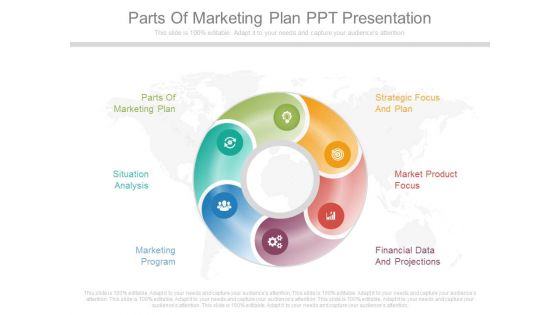
Parts Of Marketing Plan Ppt Presentation
This is a parts of marketing plan ppt presentation. This is a six stage process. The stages in this process are parts of marketing plan, strategic focus and plan, situation analysis, market product focus, marketing program, financial data and projections.

Accrual Accounting Principles Ppt Powerpoint Shapes
This is a accrual accounting principles ppt powerpoint shapes. This is a four stage process. The stages in this process are provides and more accurate financial picture, revenue when customer has ownership, cost are incurred, accrual accounting.
Various Crowdsourcing Data Applications For Various Industries Icons Pdf
The following slide depicts industry specific crowdsourcing applications. It includes various components of various sectors such as ecommerce, advertising, technology and financial services. Pitch your topic with ease and precision using this Various Crowdsourcing Data Applications For Various Industries Icons Pdf This layout presents information on Ecommerce, Advertising, Technology, Financial Services It is also available for immediate download and adjustment. So, changes can be made in the color, design, graphics or any other component to create a unique layout.
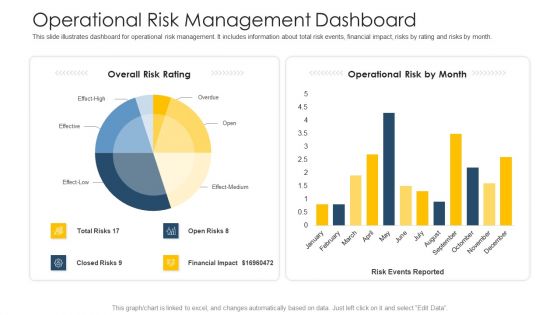
Establishing Operational Risk Framework Banking Operational Risk Management Dashboard Slides PDF
This slide illustrates dashboard for operational risk management. It includes information about total risk events, financial impact, risks by rating and risks by month. Deliver and pitch your topic in the best possible manner with this establishing operational risk framework banking operational risk management dashboard slides pdf. Use them to share invaluable insights on financial impact, operational risk, overall risk rating and impress your audience. This template can be altered and modified as per your expectations. So, grab it now.
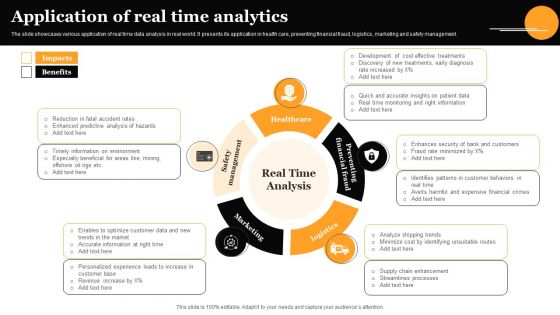
Application Of Real Time Analytics Topics PDF
The slide showcases various application of real time data analysis in real world. It presents its application in health care, preventing financial fraud, logistics, marketing and safety management. Presenting Application Of Real Time Analytics Topics PDF to dispense important information. This template comprises five stages. It also presents valuable insights into the topics including Healthcare, Preventing Financial Fraud, Logistics. This is a completely customizable PowerPoint theme that can be put to use immediately. So, download it and address the topic impactfully.
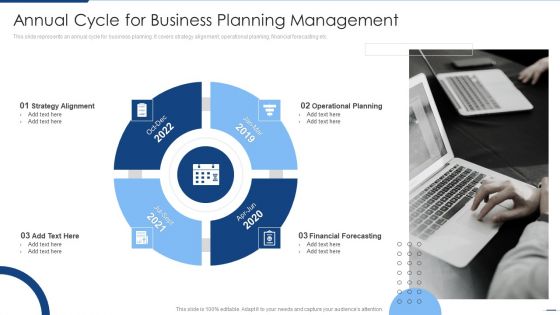
Annual Cycle For Business Planning Management Information PDF
This slide represents an annual cycle for business planning. It covers strategy alignment, operational planning, financial forecasting etc.Persuade your audience using this Annual Cycle For Business Planning Management Information PDF. This PPT design covers four stages, thus making it a great tool to use. It also caters to a variety of topics including Strategy Alignment, Operational Planning, Financial Forecasting. Download this PPT design now to present a convincing pitch that not only emphasizes the topic but also showcases your presentation skills.
Big Data Architect Big Data Management In Finance Sector Icons PDF
This slide represents the application of big data in the finance sector and how financial institutions are spending money on big data and hired data officers.Deliver an awe inspiring pitch with this creative Big Data Architect Big Data Management In Finance Sector Icons PDF bundle. Topics like Financial Services, Predictive Analytics, Their Businesses can be discussed with this completely editable template. It is available for immediate download depending on the needs and requirements of the user.
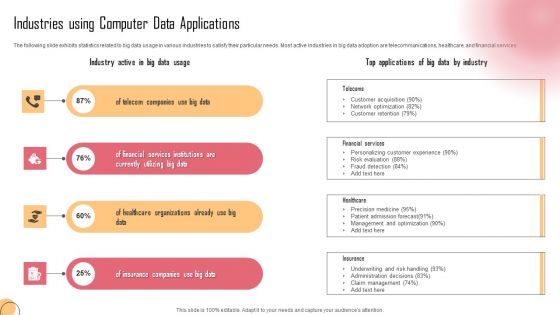
Industries Using Computer Data Applications Professional PDF
The following slide exhibits statistics related to big data usage in various industries to satisfy their particular needs. Most active industries in big data adoption are telecommunications, healthcare, and financial services. Presenting Industries Using Computer Data Applications Professional PDF to dispense important information. This template comprises four stages. It also presents valuable insights into the topics including Telecoms, Financial Services, Healthcare. This is a completely customizable PowerPoint theme that can be put to use immediately. So, download it and address the topic impactfully.

Developing Firm Security Strategy Plan Current Potential Challenges Faced By Firm Designs PDF
This slide provides information about the various potential challenges faced by firm in terms of reported financial losses due to increase in security threats and increase in data breaches and record exposed. Deliver an awe inspiring pitch with this creative developing firm security strategy plan current potential challenges faced by firm designs pdf bundle. Topics like security, financial can be discussed with this completely editable template. It is available for immediate download depending on the needs and requirements of the user.

Accounting Department Organizational Chart Ppt PowerPoint Presentation Pictures Graphics
Presenting this set of slides with name accounting department organizational chart ppt powerpoint presentation pictures graphics. This is a five stage process. The stages in this process are board of directors, chief executive officer, vice presidents, chief financial officer, controller, treasurer, internal auditor, managerial accountant, financial accountant, tax accountant. This is a completely editable PowerPoint presentation and is available for immediate download. Download now and impress your audience.
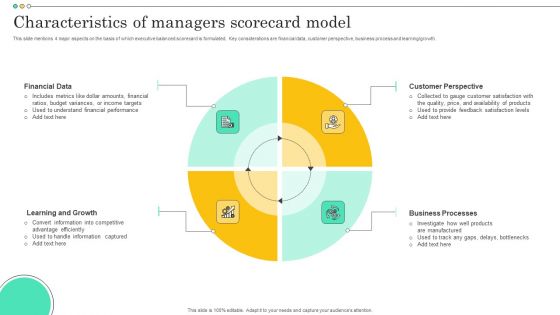
Characteristics Of Managers Scorecard Model Formats PDF

Business Plan For Fast Food Restaurant Company Profile Mcdonalds Pictures PDF
The purpose of this slide is to provide glimpse about the company profile of major player in the industry with its financial performance, product offering, etc. Deliver an awe inspiring pitch with this creative business plan for fast food restaurant company profile mcdonalds pictures pdf bundle. Topics like business, management, financial, revenue can be discussed with this completely editable template. It is available for immediate download depending on the needs and requirements of the user.
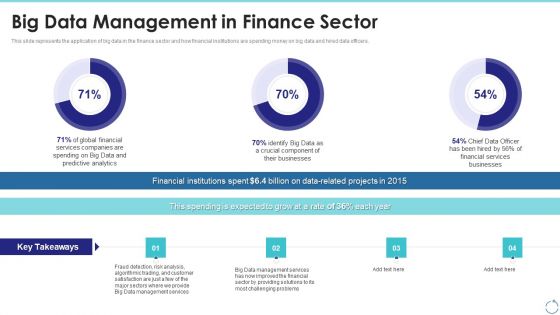
Big Data Management In Finance Sector Ppt Professional Graphics Pictures PDF
This slide represents the application of big data in the finance sector and how financial institutions are spending money on big data and hired data officers. Deliver an awe inspiring pitch with this creative big data management in finance sector ppt professional graphics pictures pdf bundle. Topics like global financial, services, big data, management can be discussed with this completely editable template. It is available for immediate download depending on the needs and requirements of the user.
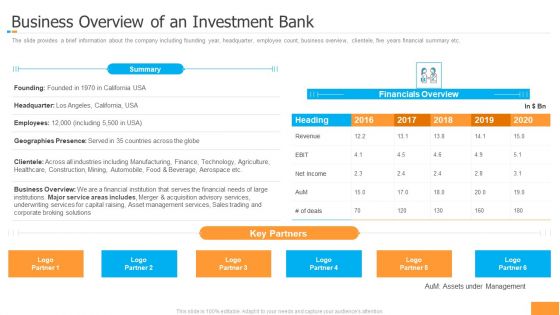
Funding Pitch Book Outline Business Overview Of An Investment Bank Pictures PDF
The slide provides a brief information about the company including founding year, headquarter, employee count, business overview, clientele, five years financial summary etc. Deliver an awe inspiring pitch with this creative funding pitch book outline business overview of an investment bank pictures pdf bundle. Topics like geographies, financial, business, management, services can be discussed with this completely editable template. It is available for immediate download depending on the needs and requirements of the user.
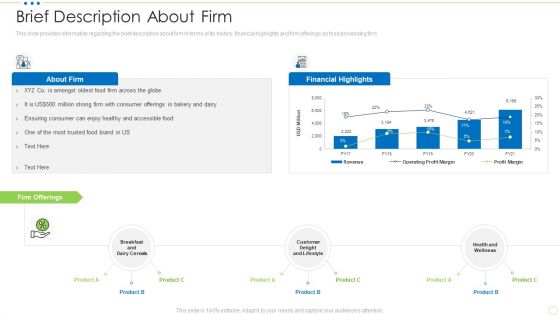
Brief Description About Firm Food Security Excellence Ppt Pictures Rules V
This slide provides information regarding the brief description about firm in terms of its history, financial highlights and firm offerings as food processing firm. Deliver and pitch your topic in the best possible manner with this brief description about firm food security excellence ppt pictures rules v. Use them to share invaluable insights on financial, lifestyle, health and wellness and impress your audience. This template can be altered and modified as per your expectations. So, grab it now.
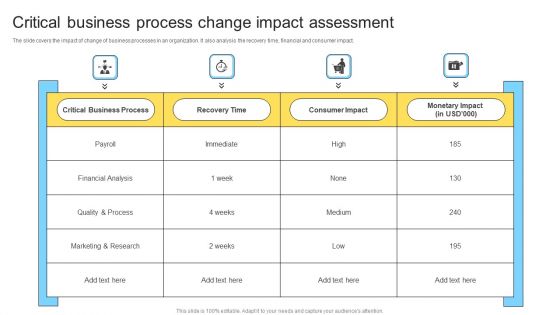
Critical Business Process Change Impact Assessment Ppt PowerPoint Presentation Infographics Pictures PDF
The slide covers the impact of change of business processes in an organization. It also analysis the recovery time, financial and consumer impact.Pitch your topic with ease and precision using this Critical Business Process Change Impact Assessment Ppt PowerPoint Presentation Infographics Pictures PDF. This layout presents information on Financial Analysis, Quality Process, Marketing Research. It is also available for immediate download and adjustment. So, changes can be made in the color, design, graphics or any other component to create a unique layout.

Capital Financing Pitch Deck For Cryptocurrency Business Underlying Magic Behind The Product Demonstration PDF
This slide showcase the investors about technology or magic behind the product. Here the slide includes the snapshots of process in order to attract the attention of audience. There are so many reasons you need a Capital Financing Pitch Deck For Cryptocurrency Business Underlying Magic Behind The Product Demonstration PDF. The first reason is you can not spend time making everything from scratch, Thus, Slidegeeks has made presentation templates for you too. You can easily download these templates from our website easily.
Marketing Qualified Leads MQL Performance Measurement Dashboard Ppt Icon Examples PDF
This slide shows dashboard for tracking performance of generated marketing qualified leads. It shows details related to audience, prospects and also shows details related to financial KPIs. Persuade your audience using this Marketing Qualified Leads MQL Performance Measurement Dashboard Ppt Icon Examples PDF. This PPT design covers one stages, thus making it a great tool to use. It also caters to a variety of topics including Audience, Closing Percentage, Per Lead Category, Financial KPIs. Download this PPT design now to present a convincing pitch that not only emphasizes the topic but also showcases your presentation skills.

Agency Performance Dashboard Sample Of Ppt
This is a agency performance dashboard sample of ppt. This is a four stage process. The stages in this process are tra score, brand safety, view ability, ad fraud, industry snapshot.
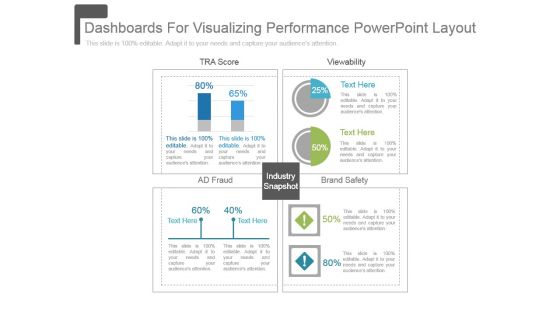
Dashboards For Visualizing Performance Powerpoint Layout
This is a dashboards for visualizing performance powerpoint layout. This is a four stage process. The stages in this process are tra score, view ability, ad fraud, brand safety, industry snapshot.
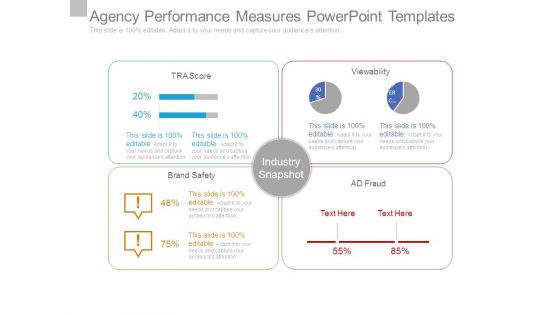
Agency Performance Measures Powerpoint Templates
This is a agency performance measures powerpoint templates. This is a four stage process. The stages in this process are industry snapshot, brand safety, ad fraud, viewability, tra score.

Industry Analysis Report Powerpoint Slide Deck Template
This is a industry analysis report powerpoint slide deck template. This is a four stage process. The stages in this process are industry snapshot, brand safety, ad fraud, viewability, tra score.
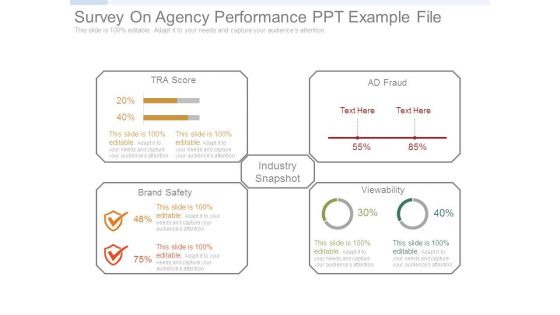
Survey On Agency Performance Ppt Example File
This is a survey on agency performance ppt example file. This is a four stage process. The stages in this process are industry snapshot, brand safety, ad fraud, viewability, tra score.

Ways To Assess Agency Performance Powerpoint Slide Deck Samples
This is a ways to assess agency performance powerpoint slide deck samples. This is a four stage process. The stages in this process are industry snapshot, brand safety, ad fraud, viewability, tra score.
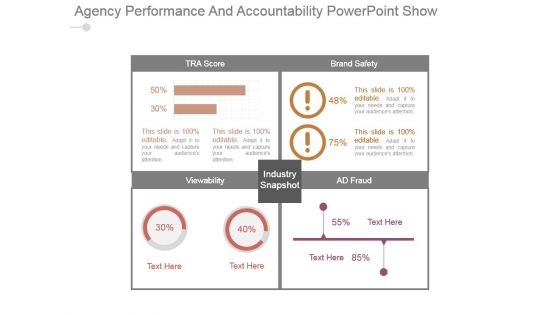
Agency Performance And Accountability Powerpoint Show
This is a agency performance and accountability powerpoint show. This is a four stage process. The stages in this process are tra score, brand safety, view ability, ad fraud, industry snapshot.
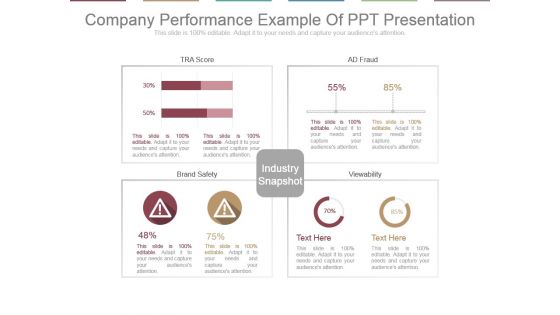
Company Performance Example Of Ppt Presentation
This is a company performance example of ppt presentation. This is a four stage process. The stages in this process are tra score, ad fraud, brand safety, view ability, industry snapshot.

Agency Performance Slide2 Ppt PowerPoint Presentation Deck
This is a agency performance slide2 ppt powerpoint presentation deck. This is a four stage process. The stages in this process are tra store, ad fraud, brand safety, industry snapshot, viewability.
Agency Performance Template 2 Ppt Powerpoint Presentation Slides Designs
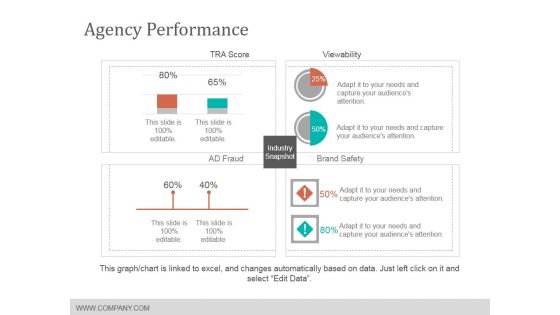
This is a agency performance template 2 ppt powerpoint presentation slides designs. This is a four stage process. The stages in this process are tra score, viewability, brand safety, industry snapshot.

Stock Market Research Report Relative Valuation Approach For Equity Research Inspiration PDF
The following slide displays the market data, financial data and valuation of multiple companies of the market. The provided table compares the price, market cap, Sales, EBITDA, earning and P or E ratio. Presenting stock market research report relative valuation approach for equity research inspiration pdf to provide visual cues and insights. Share and navigate important information on one stages that need your due attention. This template can be used to pitch topics like market data, financial data, valuation. In addition, this PPT design contains high-resolution images, graphics, etc, that are easily editable and available for immediate download.

Pie Chart With Increasing Percentage Values Powerpoint Slides
This PowerPoint template has been designed with diagram of pie chart with increasing percentage values. This PPT slide can be used to prepare presentations for profit growth report and also for financial data analysis. You can download finance PowerPoint template to prepare awesome presentations.
Data Statistics Charts And Key Performance Indicators Ppt Powerpoint Presentation Layouts Guide
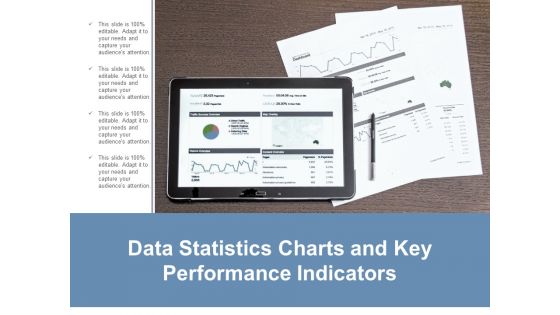
This is a data statistics charts and key performance indicators ppt powerpoint presentation layouts guide. This is a four stage process. The stages in this process are business metrics, business kpi, business dashboard.
Dashboard Measuring Performance Challenges And Expectations Portrait Pdf
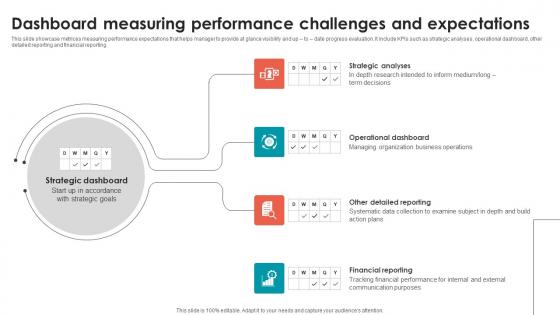
This slide showcase metrices measuring performance expectations that helps manager to provide at glance visibility and up to date progress evaluation. It include KPIs such as strategic analyses, operational dashboard, other detailed reporting and financial reporting. Showcasing this set of slides titled Dashboard Measuring Performance Challenges And Expectations Portrait Pdf. The topics addressed in these templates are Operational Dashboard, Strategic Analyses, Financial Reporting. All the content presented in this PPT design is completely editable. Download it and make adjustments in color, background, font etc. as per your unique business setting.

KPI Dashboard For Estimating Monthly Cash Flow Infographics Pdf
Following slide demonstrates KPI dashboard to forecast monthly business money flow for cash flow management planning. It includes components such as projected profit before tax, net operating cash flow, net financial cash flow, net investing cash flow, etc. Showcasing this set of slides titled KPI Dashboard For Estimating Monthly Cash Flow Infographics Pdf. The topics addressed in these templates are KPI Dashboard, Estimating Monthly Cash Flow, Net Financial Cash Flow. All the content presented in this PPT design is completely editable. Download it and make adjustments in color, background, font etc. as per your unique business setting.
Maximizing Outsourced Call Center Service Portfolio Themes Pdf
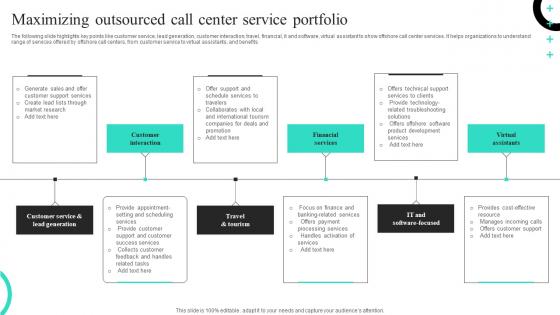
The following slide highlights key points like customer service, lead generation, customer interaction, travel, financial, it and software, virtual assistant to show offshore call center services. It helps organizations to understand range of services offered by offshore call centers, from customer service to virtual assistants, and benefits. Pitch your topic with ease and precision using this Maximizing Outsourced Call Center Service Portfolio Themes Pdf. This layout presents information on Customer Interaction, Financial Services, Virtual Assistants, Call Center Service Portfolio. It is also available for immediate download and adjustment. So, changes can be made in the color, design, graphics or any other component to create a unique layout.
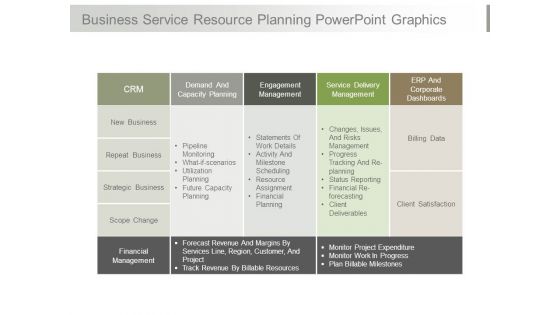
Business Service Resource Planning Powerpoint Graphics
This is a business service resource planning powerpoint graphics. This is a four stage process. The stages in this process are crm, demand and capacity planning, engagement management, service delivery management, erp and corporate dashboards, new business, repeat business, strategic business, scope change, pipeline monitoring, what if scenarios, utilization planning, future capacity planning, statements of work details, activity and milestone scheduling, resource assignment, financial planning, changes, issues, and risks management, progress tracking and re planning, status reporting, financial re forecasting, client deliverables, billing data, client satisfaction, financial management, forecast revenue and margins by services line region customer and project, track revenue by billable resources, monitor project expenditure, monitor work in progress, plan billable milestones.
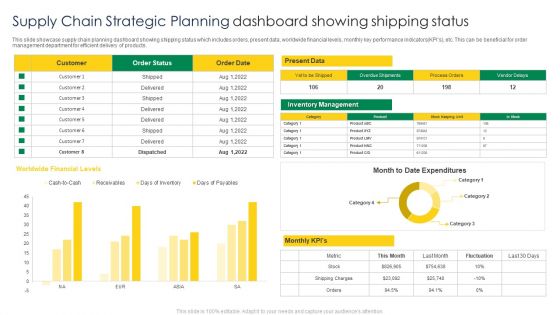
Supply Chain Strategic Planning Dashboard Showing Shipping Status Structure PDF
This slide showcase supply chain planning dashboard showing shipping status which includes orders, present data, worldwide financial levels, monthly key performance indicators KPIs, etc. This can be beneficial for order management department for efficient delivery of products. Showcasing this set of slides titled Supply Chain Strategic Planning Dashboard Showing Shipping Status Structure PDF. The topics addressed in these templates are Worldwide Financial Levels, Present Data, Customer. All the content presented in this PPT design is completely editable. Download it and make adjustments in color, background, font etc. as per your unique business setting.
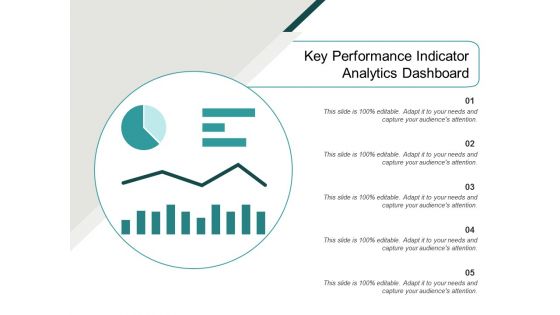
Key Performance Indicator Analytics Dashboard Ppt PowerPoint Presentation Model Example Topics
This is a key performance indicator analytics dashboard ppt powerpoint presentation model example topics. This is a five stage process. The stages in this process are kpi proposal, kpi plan, kpi scheme.

Essentials Of Statistics For Business And Economics Ppt Powerpoint Presentation Pictures Styles
This is a essentials of statistics for business and economics ppt powerpoint presentation pictures styles. This is a three stage process. The stages in this process are business metrics, business kpi, business dashboard.

Market Entry Strategy Clubs Industry Analytics Dashboard For Gym Health And Fitness Clubs Summary PDF
This slide covers the Key performance indicators for analysing social media platforms, email campaigns and website performance. Presenting market entry strategy clubs industry analytics dashboard for gym health and fitness clubs summary pdf to provide visual cues and insights. Share and navigate important information on seven stages that need your due attention. This template can be used to pitch topics like Analytics Dashboard for Gym Health and Fitness Clubs. In addtion, this PPT design contains high-resolution images, graphics, etc, that are easily editable and available for immediate download.
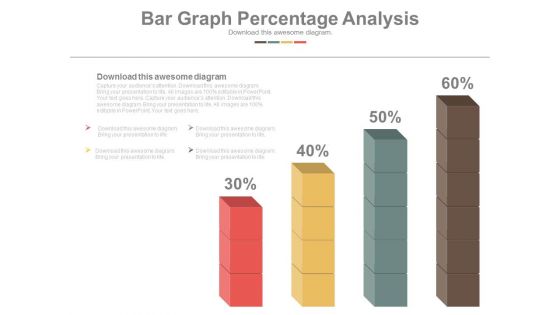
Bar Graph Displaying Profit Growth Powerpoint Slides
This PowerPoint template has been designed with six point?s bar graph with icons. This PPT slide can be used to prepare presentations for marketing reports and also for financial data analysis. You can download finance PowerPoint template to prepare awesome presentations.
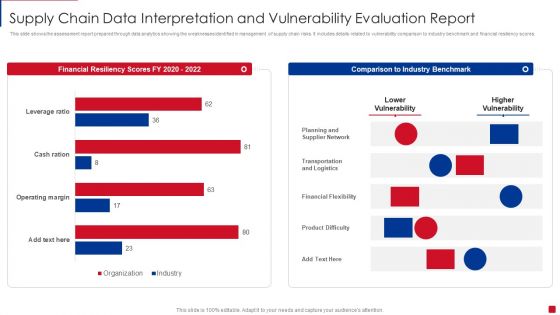
Supply Chain Data Interpretation And Vulnerability Evaluation Report Pictures PDF
This slide shows the assessment report prepared through data analytics showing the weaknesses identified in management of supply chain risks. It includes details related to vulnerability comparison to industry benchmark and financial resiliency scores Showcasing this set of slides titled Supply Chain Data Interpretation And Vulnerability Evaluation Report Pictures PDF. The topics addressed in these templates are Planning And Supplier Network, Transportation And Logistics, Financial Flexibility. All the content presented in this PPT design is completely editable. Download it and make adjustments in color, background, font etc. as per your unique business setting.

 Home
Home