Financial Snapshot

Customer Service Focus Ppt PowerPoint Presentation Model
This is a customer service focus ppt powerpoint presentation model. This is a one stage process. The stages in this process are marketing automation, customer service automation, sales force automation, financial system integration.
Customer Service Focus Ppt PowerPoint Presentation Model Icon
This is a customer service focus ppt powerpoint presentation model icon. This is a four stage process. The stages in this process are marketing automation, sales force automation, customer service automation, financial system integration.
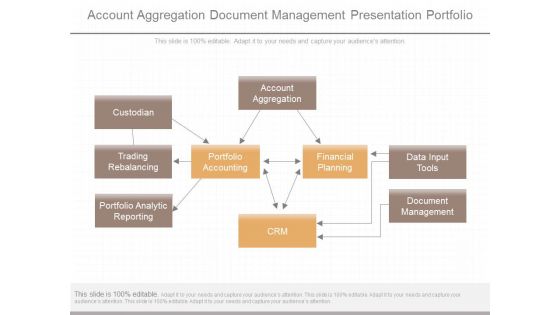
Account Aggregation Document Management Presentation Portfolio
This is a account aggregation document management presentation portfolio. This is a nine stage process. The stages in this process are custodian, trading rebalancing, portfolio analytic reporting, account aggregation, data input tools, document management, portfolio accounting, financial planning, crm.

Organizational Kpis Process Indicators Ppt Presentation
This is a organizational kpis process indicators ppt presentation. This is a five stage process. The stages in this process are people indicators, process indicators, system indicators, customer indicators, financial indicators, organizational kpis.

Proposed Services Ppt PowerPoint Presentation Pictures Backgrounds
This is a proposed services ppt powerpoint presentation pictures backgrounds. This is a five stage process. The stages in this process are secondary research, financial analysis, big data analytics, market research.
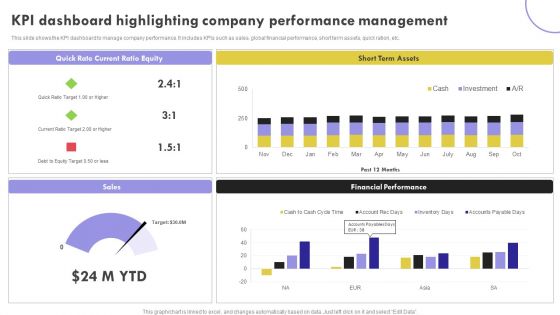
KPI Dashboard Highlighting Company Performance Management Inspiration PDF
This slide shows the KPI dashboard to manage company performance. It includes KPIs such as sales, global financial performance, short term assets, quick ration, etc.Showcasing this set of slides titled KPI Dashboard Highlighting Company Performance Management Inspiration PDF. The topics addressed in these templates are Current Ratio, Term Assets, Financial Performance. All the content presented in this PPT design is completely editable. Download it and make adjustments in color, background, font etc. as per your unique business setting.

Content Ppt PowerPoint Presentation Infographics Diagrams
This is a content ppt powerpoint presentation infographics diagrams. This is a thirteen stage process. The stages in this process are business highlights, financial highlights, products offering, sales performance dashboard, sales revenue by region.

Advanced Email Metrics And Analysis Services Diagram Slide
This is a advanced email metrics and analysis services diagram slide. This is a four stage process. The stages in this process are analytics data warehouse, data mining, financial modeling.
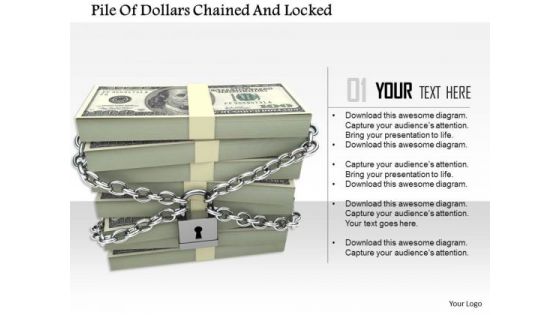
Stock Photo Pile Of Dollars Chained And Locked PowerPoint Slide
This image displays dollar bundles locked in chains. Use this image slide, in your PowerPoint presentations to express views on financial security and monetary savings. This image will enhance the quality of your presentations.

Stock Photo Red Euro Symbol With Padlock PowerPoint Slide
This image slide displays red color Euro symbol with padlock. Use this image, in your PowerPoint presentations to express views on financial security and monetary savings. This image slide will enhance the quality of your presentations.

Stock Photo 3d Dollars Stack Unlocked Security Concept PowerPoint Slide
Graphic of dollar bundle is inside the lock is used in this power point image template. We have displayed concept of financial security in this image. Use this image for security or finance related topics.
Sales Motivation Outline Ppt PowerPoint Presentation Icon
This is a sales motivation outline ppt powerpoint presentation icon. This is a seven stage process. The stages in this process are sales performance dashboard template, sales target for current financial year, talk about the mission, encourage leadership, personalize rewards.
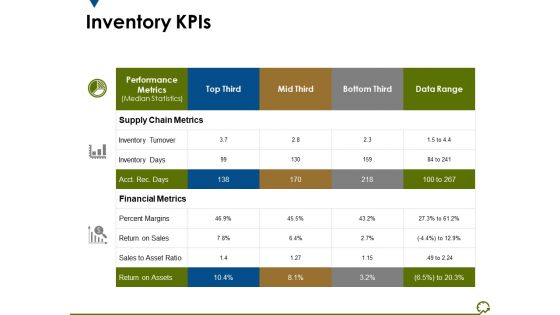
Inventory Kpis Ppt PowerPoint Presentation Infographic Template Display
This is a inventory kpis ppt powerpoint presentation infographic template display. This is a three stage process. The stages in this process are supply chain metrics, financial metrics, percent margins, return on assets, inventory turnover.

Stock Photo Lifesaving Belts On Dollars PowerPoint Slide
Define your ideas in inspiring manner with this image of lifesaving belts with dollars. Use this image to describe the concept of financial crisis. You may use this image to share a plan to achieve the desired goals.

Stock Photo Calculator On Dollars Background PowerPoint Slide
This image slide displays calculator on dollar notes. This PowerPoint template contains the concept of monetary calculation. Use this slide for displaying financial calculation in any presentation and get noticed by your viewers.

Stock Photo Graphics Of Padlock With Us Dollar Pwerpoint Slide
This business image has been designed with graphic of padlock with US dollar. This image contains the concept of finance and security. Make a quality presentation for financial security.

Stock Photo Textured Lock With Us Dollar Pwerpoint Slide
This business image has been designed with graphic of textured lock with US dollar. This image contains the concept of finance and security. Make a quality presentation for financial security.
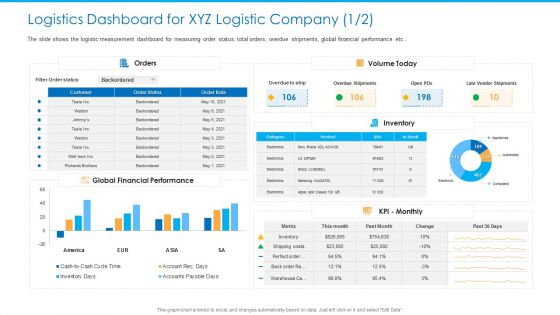
Logistics Dashboard For XYZ Logistic Company Orders Slides PDF
The slide shows the logistic measurement dashboard for measuring order status, total orders, overdue shipments, global financial performance etc.Deliver and pitch your topic in the best possible manner with this logistics dashboard for xyz logistic company orders slides pdf. Use them to share invaluable insights on global financial performance, overdue shipments, late vendor shipments and impress your audience. This template can be altered and modified as per your expectations. So, grab it now.
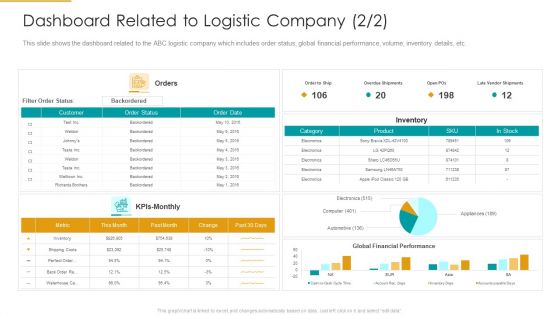
Dashboard Related To Logistic Company Electronics Ideas PDF
This slide shows the dashboard related to the ABC logistic company which includes order status, global financial performance, volume, inventory details, etc. Deliver an awe inspiring pitch with this creative dashboard related to logistic company electronics ideas pdf bundle. Topics like inventory, global financial performance, product can be discussed with this completely editable template. It is available for immediate download depending on the needs and requirements of the user.
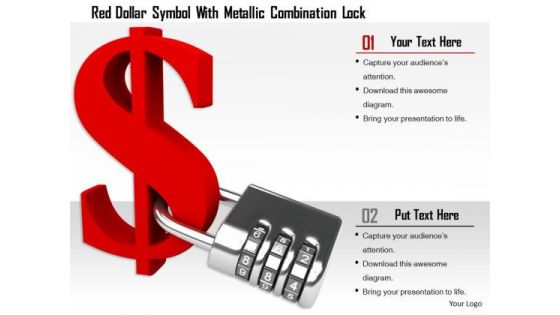
Stock Photo Red Dollar Symbol With Metallic Combination Lock PowerPoint Slide
This image slide displays red color dollar symbol with combination lock. Use this image, in your PowerPoint presentations to express views on financial security and monetary savings. This image slide will enhance the quality of your presentations.
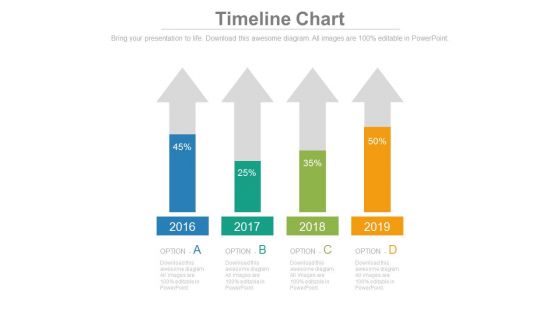
Four Arrows With Percentage Data Analysis Powerpoint Slides
This timeline template can be used for multiple purposes including financial planning, new milestones and tasks. It contains four upward arrows with percentage values. Download this PowerPoint timeline template to make impressive presentations.

Stock Photo Graphics For Business Reports And Charts PowerPoint Slide
This image contains graphics of business reports and charts. Download this image for business and sales presentations where you have to focus on financial growth. Dazzle the audience with your thoughts.
Stock Photo Red Arrow Moving Upwards In Stairs PowerPoint Slide
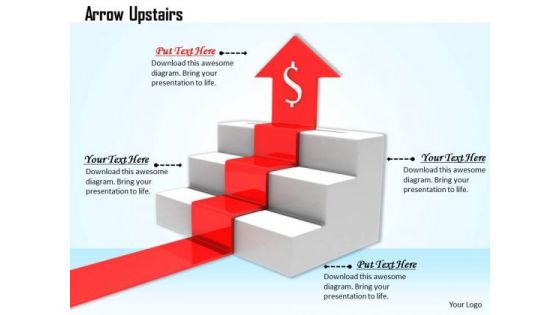
This image has been designed with red arrow moving upward on stairs with dollar symbol. This Image clearly relates to concept of financial growth. Use our image to drive the point to your audience and constantly attract their attention.

Stock Photo Red Growth Arrow With Percentage Symbol PowerPoint Slide
This image has been designed with red growth arrow with percentage symbol. This Image clearly relates to concept of financial growth. Use our image to drive the point to your audience and constantly attract their attention.

Stock Photo Smartphone With Red Upward Arrow PowerPoint Slide
This image displays red growth arrow on tablet. This image has been designed to display progress in your presentations. Use this image, in your presentations to express views on financial growth, success and marketing. Create eye-catching presentations using this image.
Stock Photo Graph Pie With Map Page PowerPoint Slide
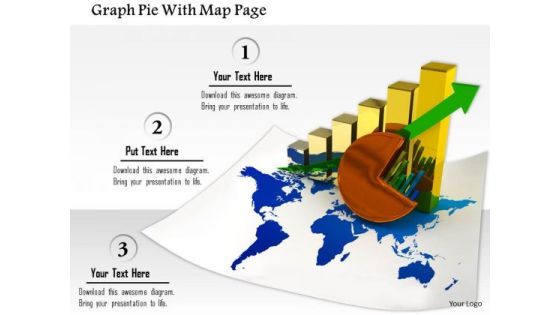
This image slide contains business charts on world map. This image is designed with bar graph and pie chart on world map depicting global economy. Use this image slide to represent financial growth in any business presentation.

Stock Photo Green Numbers Of 2015 On Dollars PowerPoint Slide
Green numbers of 2015 year and dollars has been used to decorate this power point template slide. This image slide contains the concept of year based financial planning. Display planning in your finance and business related presentations.

Stock Photo Hundred Percentage Inside Lock Safety PowerPoint Slide
Concept of financial safety has been displayed in this image slide with suitable graphics. This slide has been designed with graphic of hundred percentage value and lock. Use this professional slide to make build innovative presentation on safety related topics.
Stock Photo Dollars Covered With Lock And Chain PowerPoint Slide
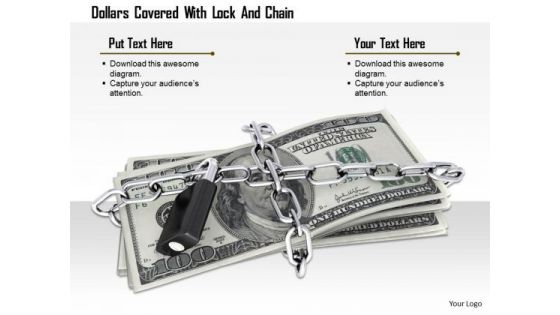
This Power Point image template has been designed with graphic of dollar and chain. In this image dollar is covered with chain which shows the concept of safety. Use this image template financial security related presentations.

Stock Photo Shopping Carts In Shape Of Dollar Symbol PowerPoint Slide
Use this image to make financial and business presentations. This image displays shopping carts in shape of dollar symbol. Concept of money and finance can be described with this imge.

Stock Photo Dollar Bundles Safe With Lock And Chain Image Graphics For PowerPoint Slide
This image slide displays dollar bundle locked with chain. Use this image, in your PowerPoint presentations to express views on financial security and monetary savings. This image slide will enhance the quality of your presentations.
Stock Photo 3d Dollar Symbol With Chain And Text Boxes PowerPoint Slide
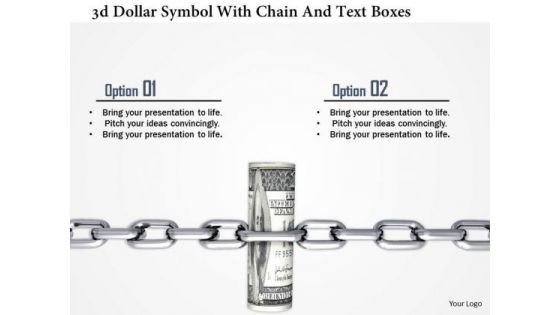
This image slide has been designed with graphic of dollar notes locked with chain. This slide depicts concept of financial security and investment. Use this editable slide for your wealth and finance related topics.
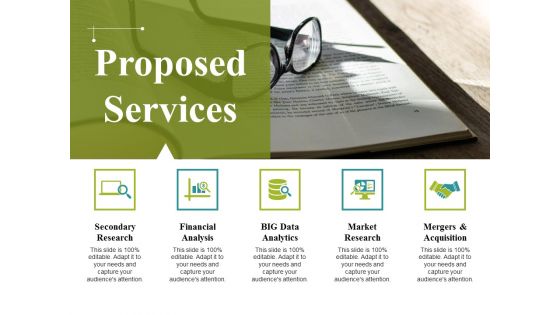
Proposed Services Ppt PowerPoint Presentation Summary Graphics
This is a proposed services ppt powerpoint presentation summary graphics. This is a five stage process. The stages in this process are secondary research, financial analysis, big data analytics, market research, mergers and acquisition.
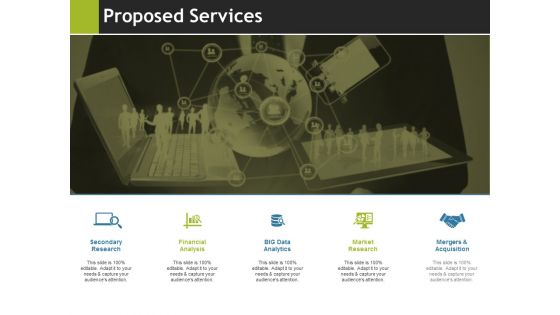
Proposed Services Ppt PowerPoint Presentation Model Samples
This is a proposed services ppt powerpoint presentation model samples. This is a five stage process. The stages in this process are secondary research, financial analysis, big data analytics, market research, mergers and acquisition.

Evaluating Scores Ppt PowerPoint Presentation Infographics Rules
This is a evaluating scores ppt powerpoint presentation infographics rules. This is a seven stage process. The stages in this process are strategic, product advantage, market attractiveness, leverage competencies, financial feasibility, operational feasibility.
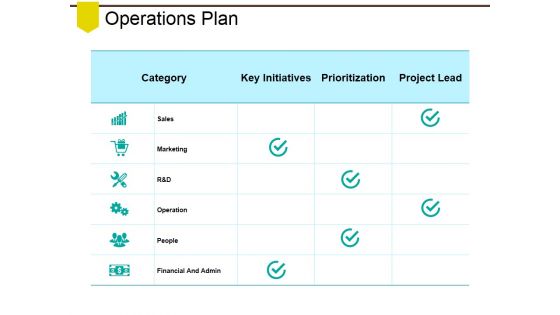
Operations Plan Ppt PowerPoint Presentation Model Samples
This is a operations plan ppt powerpoint presentation model samples. This is a three stage process. The stages in this process are sales, marketing, operation, people, financial and admin.

Market Competitiveness Template 1 Ppt PowerPoint Presentation Slides Template
This is a market competitiveness template 1 ppt powerpoint presentation slides template. This is a three stage process. The stages in this process are financial position, advertising, market share, brand image, customer loyalty.

Market Competitiveness Template 2 Ppt PowerPoint Presentation Portfolio Graphic Tips
This is a market competitiveness template 2 ppt powerpoint presentation portfolio graphic tips. This is a three stage process. The stages in this process are financial position, advertising, market share, brand image, customer loyalty.

Market Competitiveness Template Ppt PowerPoint Presentation Summary Ideas
This is a market competitiveness template ppt powerpoint presentation summary ideas. This is a three stage process. The stages in this process are financial position, advertising, market share, brand image, customer loyalty.
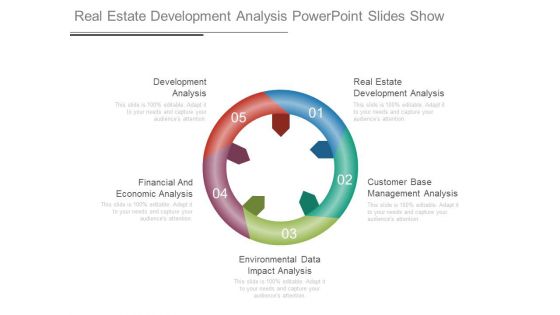
Real Estate Development Analysis Powerpoint Slides Show
This is a real estate development analysis powerpoint slides show. This is a five stage process. The stages in this process are development analysis, financial and economic analysis, environmental data impact analysis, customer base management analysis, real estate development analysis.

Stock Photo 3d Box Full With Dollars And Text Box PowerPoint Slide
Graphic of 3d box with dollars has been used to design this image slide. This slide contains money gift box depicting financial growth. Use this slide for your business and finance related presentations.
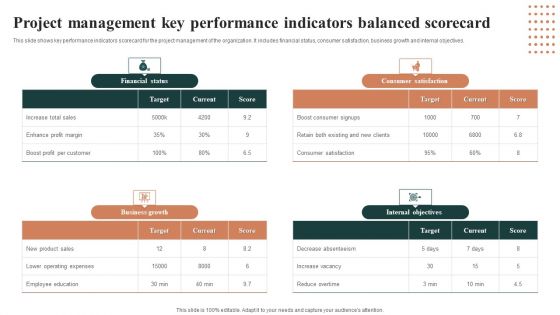
Project Management Key Performance Indicators Balanced Scorecard Introduction PDF
This slide shows key performance indicators scorecard for the project management of the organization. It includes financial status, consumer satisfaction, business growth and internal objectives. Pitch your topic with ease and precision using this Project Management Key Performance Indicators Balanced Scorecard Introduction PDF. This layout presents information on Financial Status, Business Growth, Consumer Satisfaction. It is also available for immediate download and adjustment. So, changes can be made in the color, design, graphics or any other component to create a unique layout.
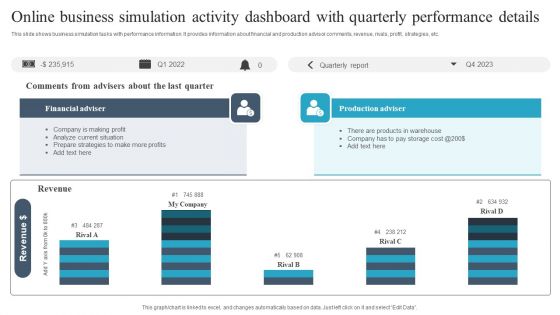
Online Business Simulation Activity Dashboard With Quarterly Performance Details Guidelines PDF
This slide shows business simulation tasks with performance information. It provides information about financial and production advisor comments, revenue, rivals, profit, strategies, etc. Pitch your topic with ease and precision using this Online Business Simulation Activity Dashboard With Quarterly Performance Details Guidelines PDF. This layout presents information on Financial Adviser, Production Adviser, Revenue. It is also available for immediate download and adjustment. So, changes can be made in the color, design, graphics or any other component to create a unique layout.

Business Diagram Big Data From Descriptive To Predictive Presentation Template
This business diagram has been designed with graphic of linear bar graph. This growing bar graph depicts the concept of big data analysis. Use this professional diagram for your financial and business analysis.

Stock Photo Smart Phone With Downturn Arrow At Display PowerPoint Slide
This image displays yellow downward arrow on tablet. This image has been designed to display progress in your presentations. Use this image, in your presentations to express views on financial degradation and losses. Create eye-catching presentations using this image.
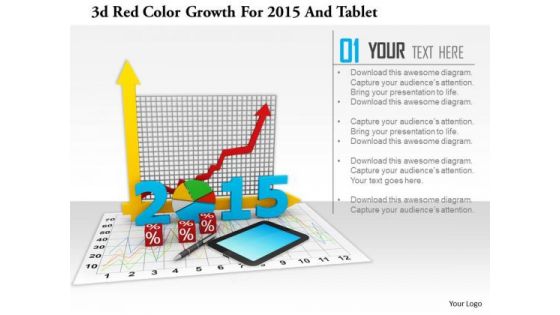
Stock Photo 3d Red Color Growth For 2015 And Tablet PowerPoint Slide
This image slide has graphics of financial charts and reports. This contains bar graph and pie chart to present business reports. Build an innovative presentation using this professional image slide.

Service Business Plan Example Powerpoint Ideas
This is a service business plan example powerpoint ideas. This is a nine stage process. The stages in this process are business plan, product or service, marketing plan, financial plan, key management, focused strategy, investors, metrics.

Strategic Planning Powerpoint Slide Presentation Tips
This is a strategic planning powerpoint slide presentation tips. This is a four stage process. The stages in this process are strategic planning, operational planning, financial capital planning, the planning cycle.
Classification Of Working Capital Ppt PowerPoint Presentation Pictures Icons
This is a classification of working capital ppt powerpoint presentation pictures icons. This is a seven stage process. The stages in this process are financial capital, working capital management, companys managerial accounting.

Strategies To Tackle Operational Risk In Banking Institutions Operational Risk Management Dashboard Structure PDF
This slide illustrates dashboard for operational risk management. It includes information about total risk events, financial impact, risks by rating and risks by month. Deliver an awe inspiring pitch with this creative strategies to tackle operational risk in banking institutions operational risk management dashboard structure pdf bundle. Topics like financial impact, operational risk management dashboard can be discussed with this completely editable template. It is available for immediate download depending on the needs and requirements of the user.
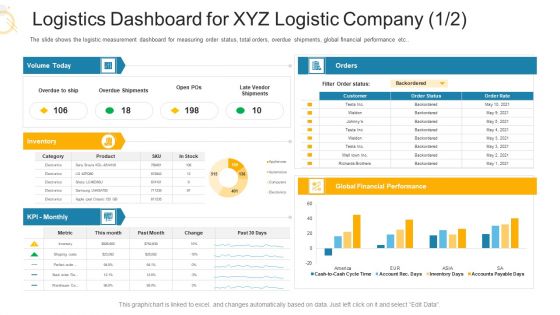
Logistics Dashboard For XYZ Logistic Company Performance Ppt Portfolio Slides PDF
The slide shows the logistic measurement dashboard for measuring order status, total orders, overdue shipments, global financial performance etc. Deliver an awe inspiring pitch with this creative logistics dashboard for XYZ logistic company performance ppt portfolio slides pdf bundle. Topics like financial performance, product, logistics dashboard for XYZ logistic company can be discussed with this completely editable template. It is available for immediate download depending on the needs and requirements of the user.

Enterprise Risk Management Strategy Diagram Ppt Sample
This is a enterprise risk management strategy diagram ppt sample. This is a three stage process. The stages in this process are risk management activities, input and risk identification, risk based monitoring, policy development, financial reporting, operational, contract and acquisition.\n\n\n\n\n\n\n\n

Logistics Dashboard For XYZ Logistic Company Orders Ppt Infographic Template Diagrams PDF
The slide shows the logistic measurement dashboard for measuring order status, total orders, overdue shipments, global financial performance etc. Deliver and pitch your topic in the best possible manner with this logistics dashboard for xyz logistic company orders ppt infographic template diagrams pdf. Use them to share invaluable insights on global financial performance, orders, inventory and impress your audience. This template can be altered and modified as per your expectations. So, grab it now.

Logistics Dashboard For XYZ Logistic Company Inventory Ppt Infographic Template Background PDF
The slide shows the logistic measurement dashboard for measuring order status, total orders, overdue shipments, global financial performance etc.Deliver and pitch your topic in the best possible manner with this logistics dashboard for XYZ logistic company inventory ppt infographic template background pdf. Use them to share invaluable insights on global financial performance, orders, volume today and impress your audience. This template can be altered and modified as per your expectations. So, grab it now.

Initiating Hazard Managing Structure Firm Operational Risk Management Dashboard Brochure PDF
This slide illustrates dashboard for operational risk management. It includes information about total risk events, financial impact, risks by rating and risks by month. Deliver an awe-inspiring pitch with this creative initiating hazard managing structure firm operational risk management dashboard brochure pdf bundle. Topics like financial impact, operational risk, risk events, risk rating can be discussed with this completely editable template. It is available for immediate download depending on the needs and requirements of the user.
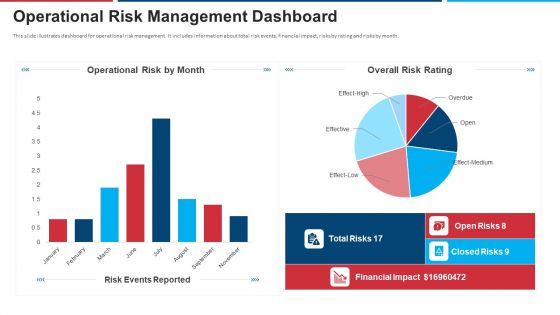
Mitigation Strategies For Operational Threat Operational Risk Management Dashboard Ppt Layouts Example PDF
This slide illustrates dashboard for operational risk management. It includes information about total risk events, financial impact, risks by rating and risks by month. Deliver and pitch your topic in the best possible manner with this mitigation strategies for operational threat operational risk management dashboard ppt layouts example pdf. Use them to share invaluable insights on financial, effective, operational risk, overall risk rating and impress your audience. This template can be altered and modified as per your expectations. So, grab it now.

Business Development Powerpoint Slide Background Picture
This is a business development powerpoint slide background picture. This is a five stage process. The stages in this process are business development, public accounting, internal auditing, finance skills, financial statements.

Operations Plan Ppt PowerPoint Presentation Pictures Clipart
This is a operations plan ppt powerpoint presentation pictures clipart. This is a three stage process. The stages in this category, sales, marketing, operation, people, financial and admin, key initiatives, prioritization.

Area Chart Ppt PowerPoint Presentation Pictures Files
This is a area chart ppt powerpoint presentation pictures files. This is a two stage process. The stages in this process are product, sales, in percentage, financial year, business.
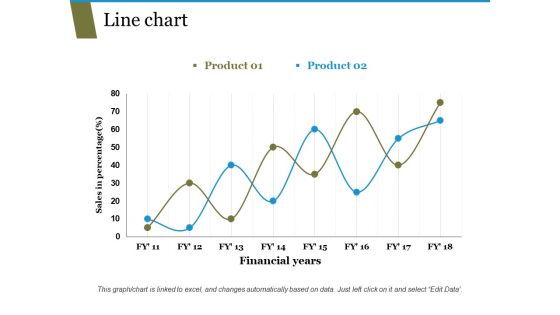
Line Chart Ppt PowerPoint Presentation Pictures Templates
This is a line chart ppt powerpoint presentation pictures templates. This is a two stage process. The stages in this process are sales in percentage, financial years, business, marketing, growth.

 Home
Home