Financial Snapshot

Bar Graph Ppt PowerPoint Presentation Pictures Display
This is a bar graph ppt powerpoint presentation pictures display. This is a one stage process. The stages in this process are sales in percentage, financial year.
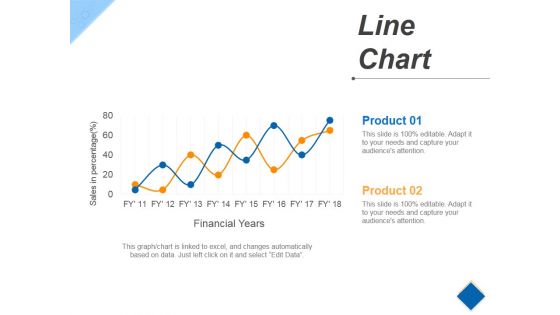
Line Chart Ppt PowerPoint Presentation Pictures Maker
This is a line chart ppt powerpoint presentation pictures maker. This is a two stage process. The stages in this process are financial years, product, growth, success.

Line Chart Ppt PowerPoint Presentation Pictures Layout
This is a line chart ppt powerpoint presentation pictures layout. This is a two stage process. The stages in this process are product, financial years, sales in percentage.

Exit Strategy Ppt PowerPoint Presentation Professional Graphics Pictures
This is a exit strategy ppt powerpoint presentation professional graphics pictures. This is a three stage process. The stages in this process are acquisition, financial buyer, ipo, maze.

Marketing Dashboard For Visualizing Performance Ppt PowerPoint Presentation Summary Slide Download
Presenting this set of slides with name marketing dashboard for visualizing performance ppt powerpoint presentation summary slide download. The topics discussed in these slides are financial targets, financial goals, growth profitability. This is a completely editable PowerPoint presentation and is available for immediate download. Download now and impress your audience.

Stock Photo 3d Globe With Chains Global Safety PowerPoint Slide
Display the global business concept in any business presentation with the help of this unique image. This image contains the graphic of 3d globe. This image shows the financial reporting for global business. Use this image in global financial topic related presentation.

Stock Photo Path To Target Dollar Symbol PowerPoint Slide
This image slide displays graphic of maze with arrow leading to dollar symbol. This image slide displays path to financial success. Use this image slide, in your presentations to express views on financial goals, targets, achievements and success. This image may also be used to depict strategic business management. This image slide will enhance the quality of your presentations.

Stock Photo Path To Target Euro Currency Symbol PowerPoint Slide
This image slide displays graphic of maze with arrow leading to euro symbol. This image slide displays path to financial success. Use this image slide, in your presentations to express views on financial goals, targets, achievements and success. This image may also be used to depict strategic business management. This image slide will enhance the quality of your presentations.

Stock Photo Path To Target Pound Symbol PowerPoint Slide
This image slide displays graphic of maze with arrow leading to pound symbol. This image slide displays path to financial success. Use this image slide, in your presentations to express views on financial goals, targets, achievements and success. This image may also be used to depict strategic business management. This image slide will enhance the quality of your presentations.

Cyber Security Implementation Framework Present Concerns Impeding Cybersecurity Clipart PDF
Presenting this set of slides with name cyber security implementation framework present concerns impeding cybersecurity clipart pdf. The topics discussed in these slides are data breaches and records exposed, reported financial losses due to increase cybercrimes, financial losses, cybercrimes incidents. This is a completely editable PowerPoint presentation and is available for immediate download. Download now and impress your audience.

Picture Of Chess Game For Strategic Planning Ppt PowerPoint Presentation Summary Deck
Presenting this set of slides with name picture of chess game for strategic planning ppt powerpoint presentation summary deck. This is a seven stage process. The stages in this process are financial strategy, business financial trend, business strategy. This is a completely editable PowerPoint presentation and is available for immediate download. Download now and impress your audience.
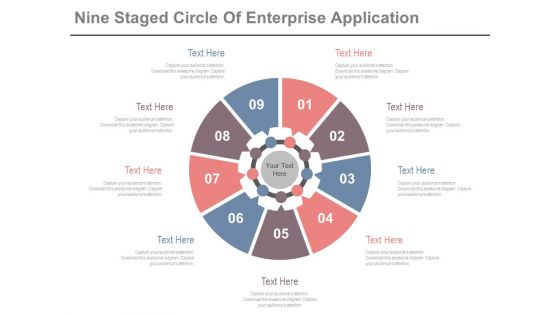
Circle Diagram For Business Marketing Mix Powerpoint Slides
This PowerPoint template has been designed with nine steps circle chart. This PPT slide can be used to prepare presentations for profit growth report and also for financial data analysis. You can download finance PowerPoint template to prepare awesome presentations.
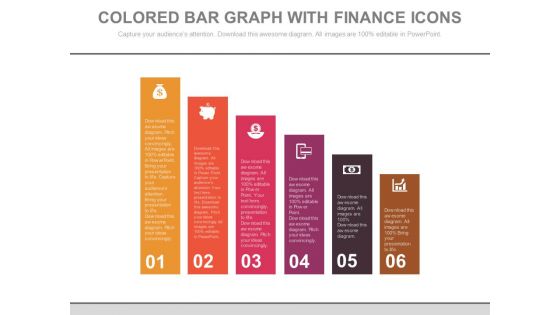
Bar Graph For Marketing Research Data Powerpoint Slides
This PowerPoint template has been designed with diagram of bar graph. This PPT slide can be used to prepare presentations for profit growth report and also for financial data analysis. You can download finance PowerPoint template to prepare awesome presentations.

Bar Graph For Marketing Research Process Powerpoint Slides
This PowerPoint template has been designed with diagram of bar graph. This PPT slide can be used to prepare presentations for profit growth report and also for financial data analysis. You can download finance PowerPoint template to prepare awesome presentations.

Four Steps Arrow Chart Design Powerpoint Slides
This PowerPoint template has been designed with four steps arrow chart. This PPT slide can be used to prepare presentations for marketing reports and also for financial data analysis. You can download finance PowerPoint template to prepare awesome presentations.

Management Dashboard Templates Presentation Diagram
This is a management dashboard templates presentation diagram. This is a four stage process. The stages in this process are operational performance, business value, financial performance, infrastructure business value.

Bar Chart Ppt PowerPoint Presentation Model Picture
This is a bar chart ppt powerpoint presentation model picture. This is a two stage process. The stages in this process are product, sales in percentage, financial years, bar chart.

Sequential Steps Chart For Data Analysis Powerpoint Slides
This PowerPoint template has been designed sequential steps chart with icons. This PPT slide can be used to display corporate level financial strategy. You can download finance PowerPoint template to prepare awesome presentations.

Cash Flow Statement Kpis Template 2 Ppt PowerPoint Presentation Layouts Visuals
This is a cash flow statement kpis template 2 ppt powerpoint presentation layouts visuals. This is a four stage process. The stages in this process are operations, financial activities, investing activities, net increase in cash.

Cash Flow Statement Kpis Tabular Form Ppt PowerPoint Presentation Summary Elements
This is a cash flow statement kpis tabular form ppt powerpoint presentation summary elements. This is a four stage process. The stages in this process are net increase cash, financial activities, operations, investing activities.
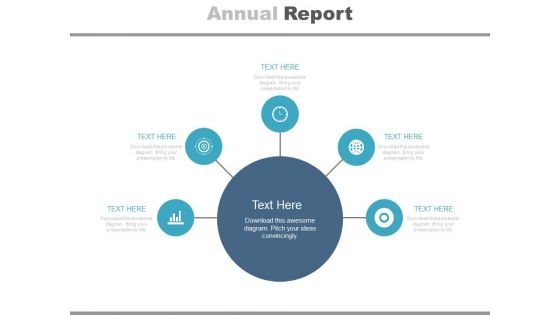
Diagram For Market Research Analysis Powerpoint Slides
This PowerPoint template has been designed with circular infographic diagram. It can be used to display steps for market research and also for financial data analysis. You can download finance PowerPoint template to prepare awesome presentations.

Clustered Column Ppt PowerPoint Presentation Pictures Mockup
This is a clustered column ppt powerpoint presentation pictures mockup. This is a two stage process. The stages in this process are product, sales in percentage, financial year, graph, business.
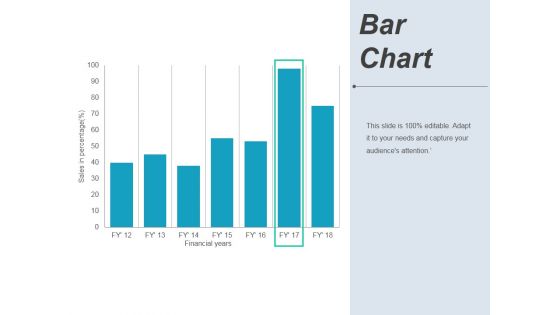
Bar Chart Ppt PowerPoint Presentation Pictures Background Image
This is a bar chart ppt powerpoint presentation pictures background image. This is a seven stage process. The stages in this process are financial years, sales in percentage, graph, business.

Area Chart Ppt PowerPoint Presentation Outline Graphics Pictures
This is a area chart ppt powerpoint presentation outline graphics pictures. This is a two stage process. The stages in this process are financial year, in percentage, business, marketing, finance.

Circles With Percentage Values Powerpoint Templates
This PowerPoint template displays circles with percentage values. This business diagram is suitable for financial data analysis. Use this business diagram slide to highlight the key issues of your presentation.
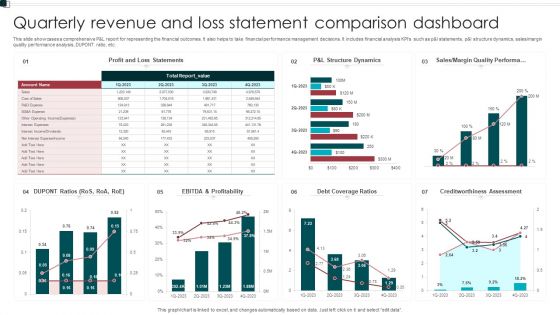
Quarterly Revenue And Loss Statement Comparison Dashboard Portrait PDF
This slide showcases a comprehensive P and L report for representing the financial outcomes. It also helps to take financial performance management decisions. It includes financial analysis KPIs such as p and l statements, p and l structure dynamics, sales or margin quality performance analysis, DUPONT ratio, etc. Showcasing this set of slides titled Quarterly Revenue And Loss Statement Comparison Dashboard Portrait PDF. The topics addressed in these templates are Profitability, Debt Coverage Ratios, Margin Quality Performa. All the content presented in this PPT design is completely editable. Download it and make adjustments in color, background, font etc. as per your unique business setting.
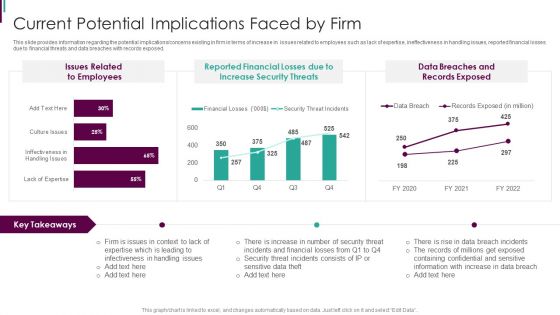
Developing Business Analytics Framework Current Potential Implications Faced By Firm Graphics PDF
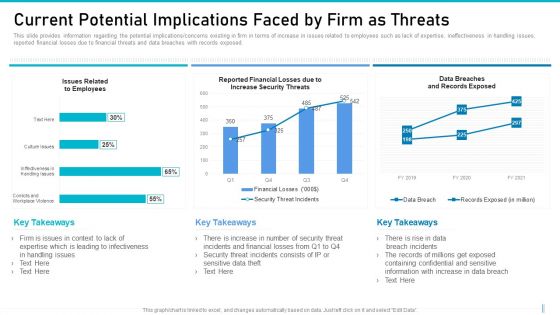
This slide provides information regarding the potential implications concerns existing in firm in terms of increase in issues related to employees such as lack of expertise, ineffectiveness in handling issues, reported financial losses due to financial threats and data breaches with records exposed. Deliver and pitch your topic in the best possible manner with this Developing Business Analytics Framework Current Potential Implications Faced By Firm Graphics PDF Use them to share invaluable insights on Reported Financial, Increase Security, Data Breaches and impress your audience. This template can be altered and modified as per your expectations. So, grab it now.
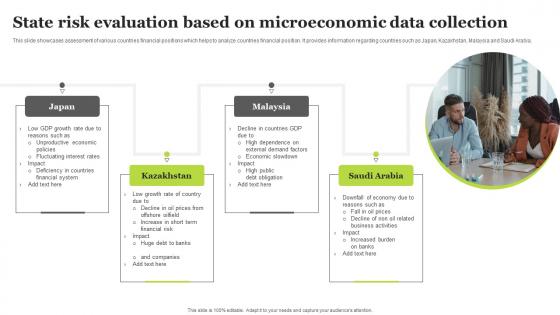
State Risk Evaluation Based On Microeconomic Data Collection Brochure Pdf
This slide showcases assessment of various countries financial positions which helps to analyze countries financial position. It provides information regarding countries such as Japan, Kazakhstan, Malaysia and Saudi Arabia. Pitch your topic with ease and precision using this State Risk Evaluation Based On Microeconomic Data Collection Brochure Pdf. This layout presents information on Financial Risk, Downfall Of Economy. It is also available for immediate download and adjustment. So, changes can be made in the color, design, graphics or any other component to create a unique layout.

Evolving BI Infrastructure Current Potential Implications Faced By Firm Threats Portrait PDF
This slide provides information regarding the potential implications or concerns existing in firm in terms of increase in issues related to employees such as lack of expertise, ineffectiveness in handling issues, reported financial losses due to financial threats and data breaches with records exposed. Deliver an awe inspiring pitch with this creative evolving bi infrastructure current potential implications faced by firm threats portrait pdf bundle. Topics like issues related to employees, reported financial losses due to increase security threats, data breaches and records exposed can be discussed with this completely editable template. It is available for immediate download depending on the needs and requirements of the user.
Risk Management For Organization Essential Assets Current Potential Implications Faced Graphics PDF
This slide provides information regarding the potential implications or concerns existing in firm in terms of increase in issues related to employees such as lack of expertise, ineffectiveness in handling issues, reported financial losses due to financial threats and data breaches with records exposed. Deliver an awe inspiring pitch with this creative risk management for organization essential assets current potential implications faced graphics pdf bundle. Topics like issues related to employees, reported financial losses due to increase security threats, data breaches and records exposed can be discussed with this completely editable template. It is available for immediate download depending on the needs and requirements of the user.
Cyber Safety Incident Management Current Potential Implications Faced By Firm As Threats Clipart PDF
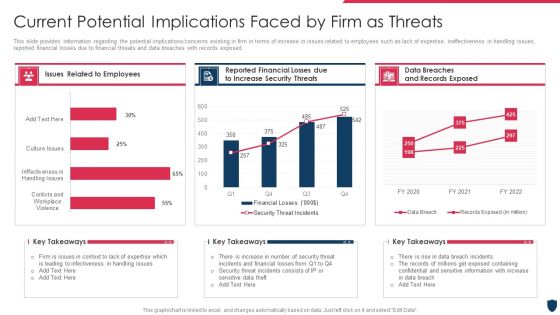
This slide provides information regarding the potential implications or concerns existing in firm in terms of increase in issues related to employees such as lack of expertise, ineffectiveness in handling issues, reported financial losses due to financial threats and data breaches with records exposed. Deliver an awe inspiring pitch with this creative cyber safety incident management current potential implications faced by firm as threats clipart pdf bundle. Topics like issues related to employees, data breaches and records exposed, reported financial losses due to increase security threats can be discussed with this completely editable template. It is available for immediate download depending on the needs and requirements of the user.

Current Potential Implications Faced By Firm Intelligent Infrastructure Rules PDF
This slide provides information regarding the potential implications or concerns existing in firm in terms of increase in issues related to employees such as lack of expertise, ineffectiveness in handling issues, reported financial losses due to financial threats and data breaches with records exposed. Deliver an awe inspiring pitch with this creative Current Potential Implications Faced By Firm Intelligent Infrastructure Rules PDF bundle. Topics like Issues Related To Employees, Reported Financial Losses, Due To Increase Security Threats, Data Breaches And can be discussed with this completely editable template. It is available for immediate download depending on the needs and requirements of the user.
Various Solutions For Effective Project Budget Planning Pictures PDF
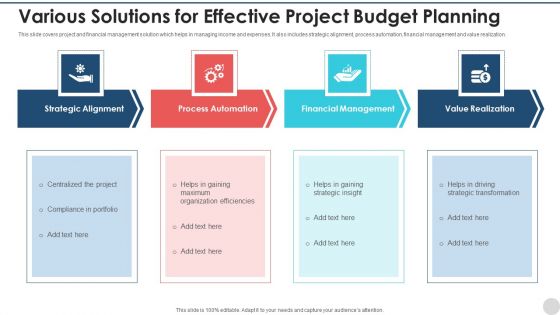
This slide covers project and financial management solution which helps in managing income and expenses. It also includes strategic alignment, process automation, financial management and value realization. Presenting various solutions for effective project budget planning pictures pdf to dispense important information. This template comprises four stages. It also presents valuable insights into the topics including strategic alignment, process automation, financial management, value realization. This is a completely customizable PowerPoint theme that can be put to use immediately. So, download it and address the topic impactfully.

Threat Management At Workplace Current Potential Implications Faced By Firm As Threats Professional Pdf
This slide provides information regarding the potential implications concerns existing in firm in terms of increase in issues related to employees such as lack of expertise, ineffectiveness in handling issues, reported financial losses due to financial threats and data breaches with records exposed. Deliver and pitch your topic in the best possible manner with this threat management at workplace current potential implications faced by firm as threats professional pdf. Use them to share invaluable insights on data breaches and records exposed, breach incidents, financial losses and impress your audience. This template can be altered and modified as per your expectations. So, grab it now.

Facilitating IT Intelligence Architecture Current Potential Implications Faced By Firm Slides PDF
This slide provides information regarding the potential implications or poncerns existing in firm in terms of increase in issues related to employees such as lack of expertise, ineffectiveness in handling issues, reported financial losses due to financial threats and data breaches with records exposed. Deliver an awe inspiring pitch with this creative Facilitating IT Intelligence Architecture Current Potential Implications Faced By Firm Slides PDF bundle. Topics like Infectiveness In Handling, Expertise Which Is Leading, Incidents And Financial can be discussed with this completely editable template. It is available for immediate download depending on the needs and requirements of the user.
Dashboard For Gross And Net Earnings Summary Designs Pdf
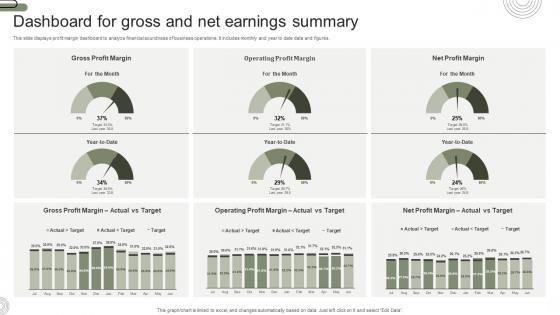
This slide displays profit margin dashboard to analyze financial soundness of business operations. It includes monthly and year to date data and figures. Showcasing this set of slides titled Dashboard For Gross And Net Earnings Summary Designs Pdf. The topics addressed in these templates are Dashboard For Gross, Net Earnings Summary, Financial Soundness. All the content presented in this PPT design is completely editable. Download it and make adjustments in color, background, font etc. as per your unique business setting.
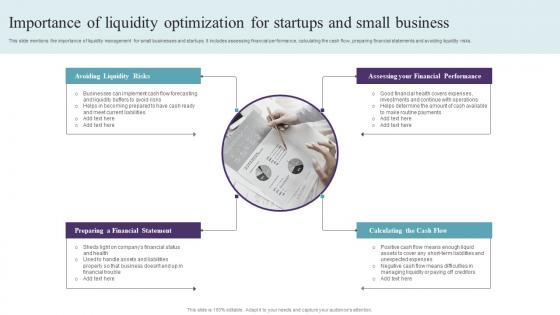
Importance Of Liquidity Optimization For Startups And Small Business Pictures Pdf
This slide mentions the importance of liquidity management for small businesses and startups. It includes assessing financial performance, calculating the cash flow, preparing financial statements and avoiding liquidity risks. Showcasing this set of slides titled Importance Of Liquidity Optimization For Startups And Small Business Pictures Pdf. The topics addressed in these templates are Assessing Your Financial Performance, Avoiding Liquidity Risks. All the content presented in this PPT design is completely editable. Download it and make adjustments in color, background, font etc. as per your unique business setting.
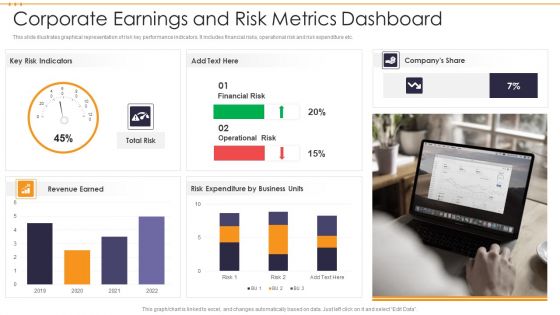
Corporate Earnings And Risk Metrics Dashboard Guidelines PDF
This slide illustrates graphical representation of risk key performance indicators. It includes financial risks, operational risk and risk expenditure etc. Pitch your topic with ease and precision using this Corporate Earnings And Risk Metrics Dashboard Guidelines PDF. This layout presents information on Financial Risk, Operational Risk Expenditure. It is also available for immediate download and adjustment. So, changes can be made in the color, design, graphics or any other component to create a unique layout.
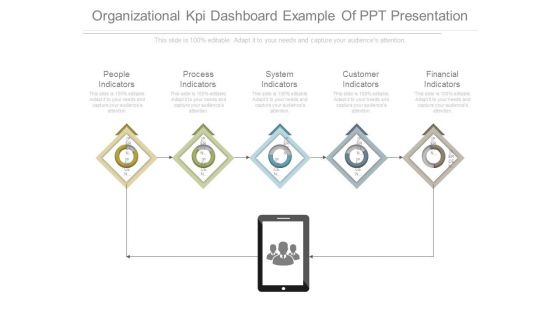
Organizational Kpi Dashboard Example Of Ppt Presentation
This is a organizational kpi dashboard example of ppt presentation. This is a five stage process. The stages in this process are people indicators, process indicators, system indicators, customer indicators, financial indicators.

Clear Point Strategy Dashboard Ppt Presentation
This is a clear point strategy dashboard ppt presentation. This is a four stage process. The stages in this process are financial perspective, internal processes perspective, learning and growth perspective, customer perspective.
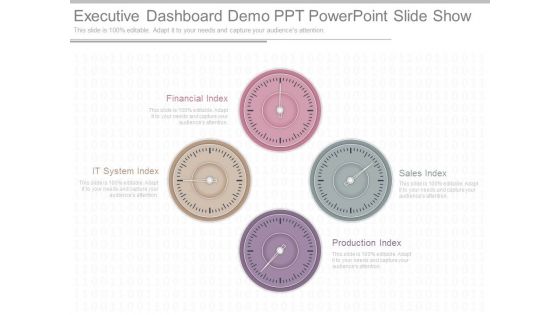
Executive Dashboard Demo Ppt Powerpoint Slide Show
This is a executive dashboard demo ppt powerpoint slide show. This is a four stage process. The stages in this process are financial index, it system index, production index, sales index.
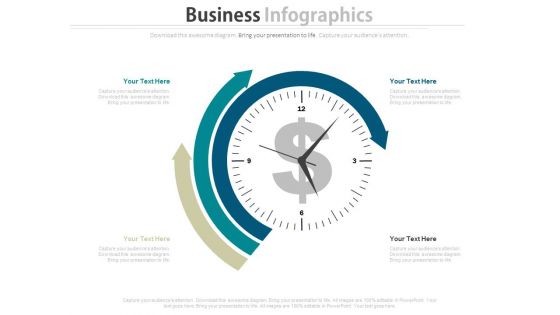
Dashboard Diagram For Finance And Strategic Analysis Powerpoint Slides
This PowerPoint template display graphics of clock with arrows around it and dollar symbol in center. You may use this PPT slide for financial and strategic analysis. This dashboard slide may useful for multilevel status report creation and approval process.
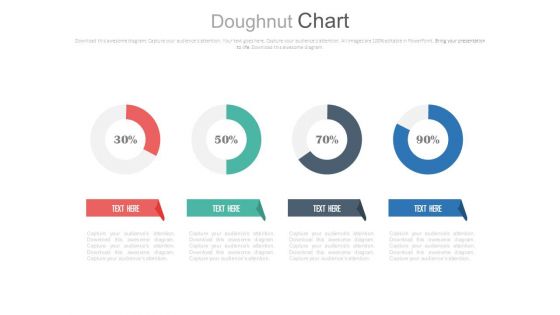
Four Circle Chart With Percentage Ratios Powerpoint Slides
This PowerPoint template has been designed with graphics of four circles and percentage ratios. You may use this dashboard slide design for topics like profit growth and financial planning. This PPT slide is powerful tool to describe your ideas.
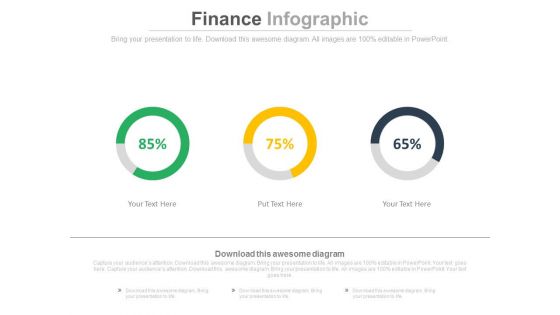
Linear Circles Percentage Analysis Charts Powerpoint Slides
This PowerPoint template has been designed with graphics of three circles and percentage ratios. You may use this dashboard slide design for topics like profit growth and financial planning. This PPT slide is powerful tool to describe your ideas.

Balanced Scorecard Success Layout Ppt Slide Show
This is a balanced scorecard success layout ppt slide show. This is a four stage process. The stages in this process are clinical quality, customer loyalty, financial viability, operational effectiveness.
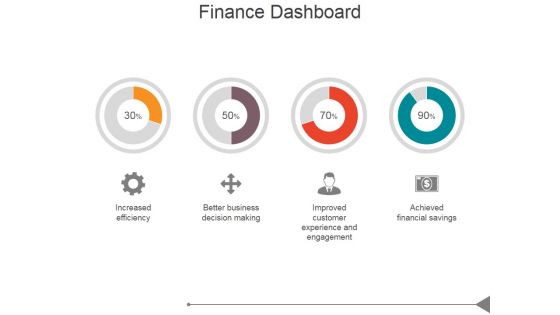
Finance Dashboard Ppt PowerPoint Presentation Diagrams
This is a finance dashboard ppt powerpoint presentation diagrams. This is a four stage process. The stages in this process are increased efficiency, better business decision making, improved customer experience and engagement, achieved financial savings.

Four Companies With Web Services Powerpoint Slides
This PowerPoint template display graphics of four corporate buildings. You may use this PPT slide for financial and strategic analysis for web services companies. This dashboard slide may useful for multilevel status report creation and approval process.
Four Circles With Percentage Values And Icons Powerpoint Slides
This PowerPoint template displays info graphic diagram of linear circles. This diagram may be used to exhibit financial growth and analysis. Grab center stage with this slide and capture the attention of your audience.

Cash Conversion Cycle Ppt PowerPoint Presentation Outline Example Introduction
This is a cash conversion cycle ppt powerpoint presentation outline example introduction. This is a six stage process. The stages in this process are financial capital, working capital management, companys managerial accounting.
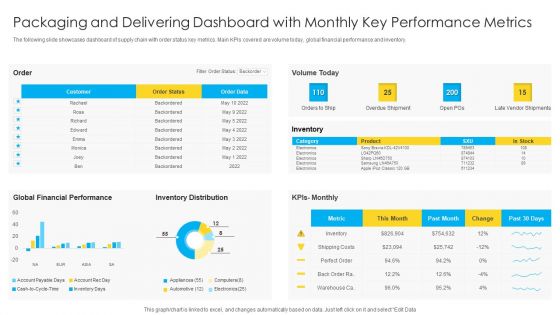
Packaging And Delivering Dashboard With Monthly Key Performance Metrics Microsoft PDF
The following slide showcases dashboard of supply chain with order status key metrics. Main KPIs covered are volume today, global financial performance and inventory. Pitch your topic with ease and precision using this Packaging And Delivering Dashboard With Monthly Key Performance Metrics Microsoft PDF. This layout presents information on Customer, Global Financial Performance, Inventory Distribution. It is also available for immediate download and adjustment. So, changes can be made in the color, design, graphics or any other component to create a unique layout.

Corporate Performance Management Dashboard Ppt Powerpoint Topics
This is a corporate performance management dashboard ppt powerpoint topics. This is a eight stage process. The stages in this process are analysis, reporting, dashboards, financial consolidation, budgeting, forecasting, detailed planning, operational planning, corporate performance management.
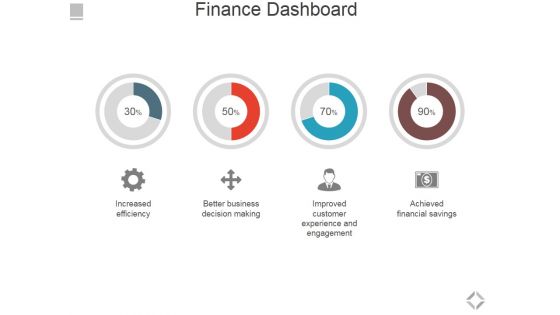
Finance Dashboard Ppt PowerPoint Presentation Layouts Infographics
This is a finance dashboard ppt powerpoint presentation layouts infographics. This is a four stage process. The stages in this process are increased efficiency, better business decision making, improved customer experience and engagement, achieved financial savings.
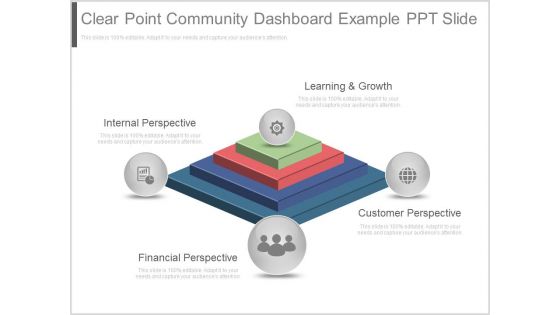
Clear Point Community Dashboard Example Ppt Slide
This is a clear point community dashboard example ppt slide. This is a four stage process. The stages in this process are internal perspective, learning and growth, financial perspective, customer perspective.
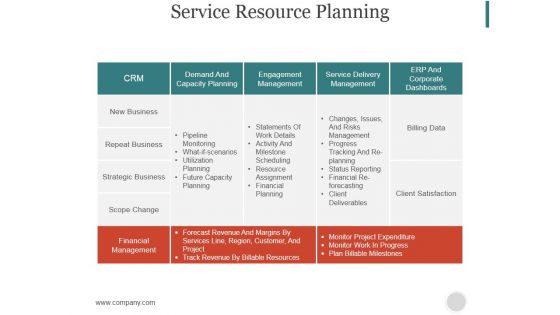
Service Resource Planning Ppt PowerPoint Presentation Styles
This is a service resource planning ppt powerpoint presentation styles. This is a five stage process. The stages in this process are crm, demand and capacity planning, engagement management, service delivery management, erp and corporate dashboards, financial management.

Data Quality Dashboard For Linked Data Download PDF
This slide describes the data quality dashboard for linked data by covering details of account information quality, contact details quality, financial data quality, and missing account information. Deliver an awe inspiring pitch with this creative Data Quality Dashboard For Linked Data Download PDF bundle. Topics like Account Data Quality, Contact Data Quality, Financial Data Quality can be discussed with this completely editable template. It is available for immediate download depending on the needs and requirements of the user.
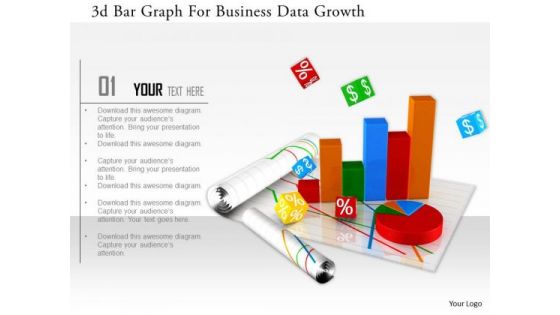
Stock Photo 3d Bar Graph For Business Data Growth Image Graphics For PowerPoint Slide
This image slide has graphics of financial charts and reports. This contains bar graph and pie chart to present business reports. Build an innovative presentations using this professional image slide.
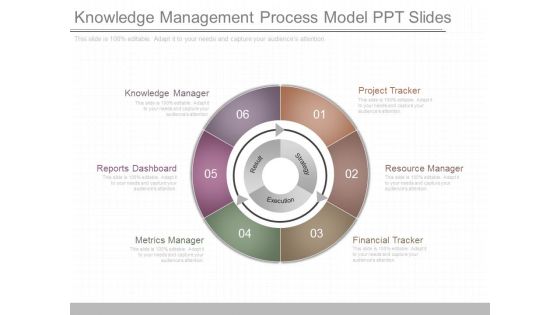
Knowledge Management Process Model Ppt Slides
This is a knowledge management process model ppt slides. This is a six stage process. The stages in this process are knowledge manager, reports dashboard, metrics manager, financial tracker, resource manager, project tracker, result, strategy, execution.
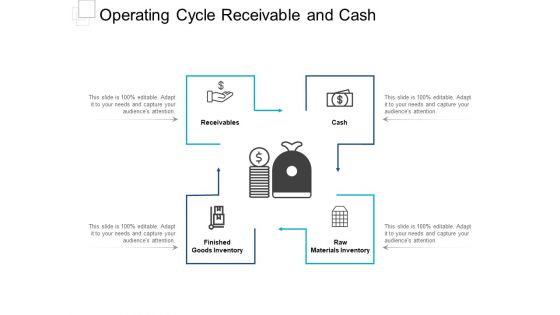
Operating Cycle Receivable And Cash Ppt PowerPoint Presentation Gallery
This is a operating cycle receivable and cash ppt powerpoint presentation gallery. This is a four stage process. The stages in this process are financial capital, working capital management, companys managerial accounting.
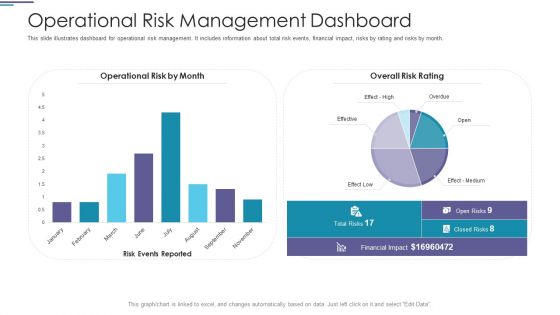
Operational Risk Management Dashboard Ppt PowerPoint Presentation Styles Pictures PDF
This slide illustrates dashboard for operational risk management. It includes information about total risk events, financial impact, risks by rating and risks by month.Deliver an awe-inspiring pitch with this creative operational risk management dashboard ppt powerpoint presentation styles pictures pdf. bundle. Topics like financial impact, operational risk by month, overall risk rating can be discussed with this completely editable template. It is available for immediate download depending on the needs and requirements of the user.
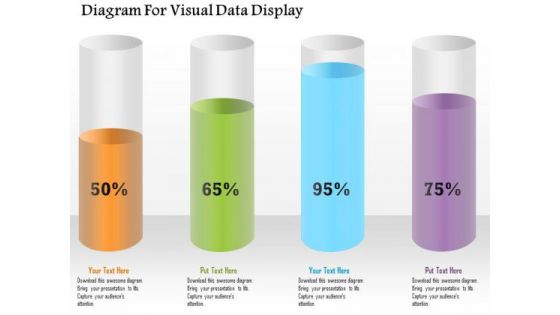
Business Diagram Diagram For Visual Data Display Presentation Template
Four colored cylindrical bars with percentage values are used to design this power point template. This diagram slide helps to display financial data analysis. Use this diagram for your business and finance related presentations.

 Home
Home