Year Over Year Growth
Line Chart Ppt PowerPoint Presentation Icon Inspiration
This is a line chart ppt powerpoint presentation icon inspiration. This is a two stage process. The stages in this process are product, financial years, sales in percentage.
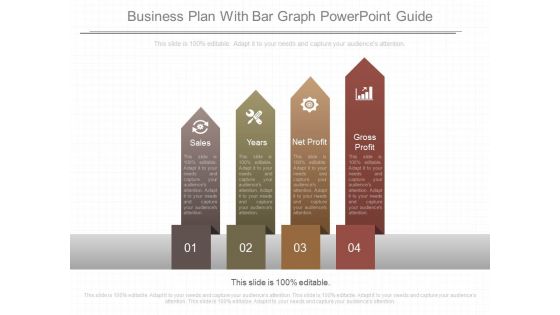
Business Plan With Bar Graph Powerpoint Guide
This is a business plan with bar graph powerpoint guide. This is a four stage process. The stages in this process are sales, years, net profit, gross profit.
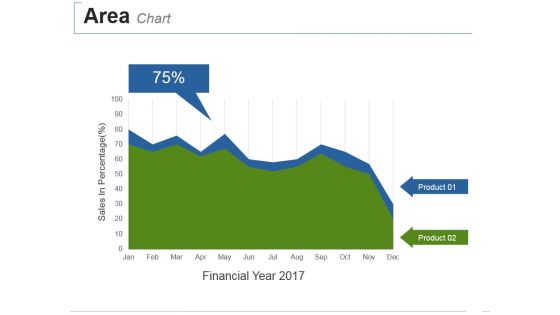
Area Chart Ppt PowerPoint Presentation Summary Deck
This is a area chart ppt powerpoint presentation summary deck. This is a two stage process. The stages in this process are sales in percentage, financial year.
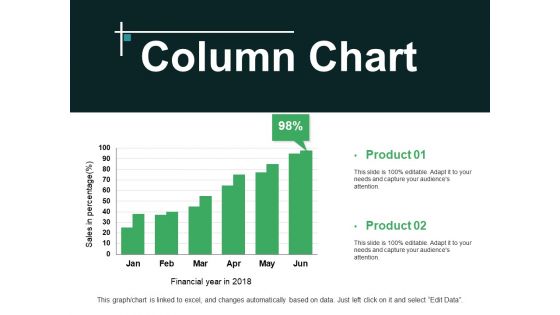
Column Chart Ppt PowerPoint Presentation Professional Aids
This is a column chart ppt powerpoint presentation professional aids. This is a two stage process. The stages in this process are product, sales in percentage, financial years.
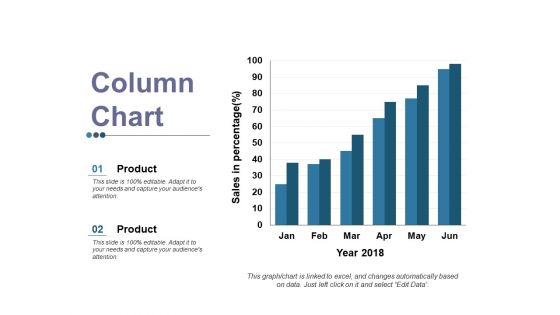
Column Chart Ppt PowerPoint Presentation Gallery Layout
This is a column chart ppt powerpoint presentation gallery layout. This is a two stage process. The stages in this process are product, sales in percentage, year.
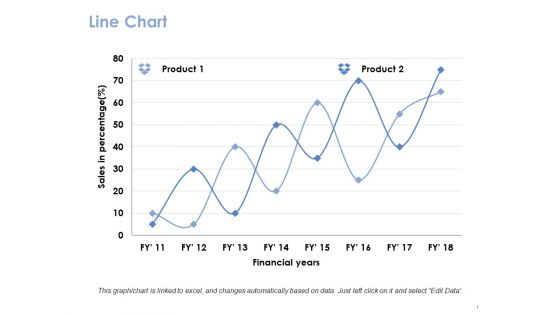
Line Chart Ppt PowerPoint Presentation Gallery Guide
This is a line chart ppt powerpoint presentation gallery guide. This is a two stage process. The stages in this process are product, financial years, sales in percentage.
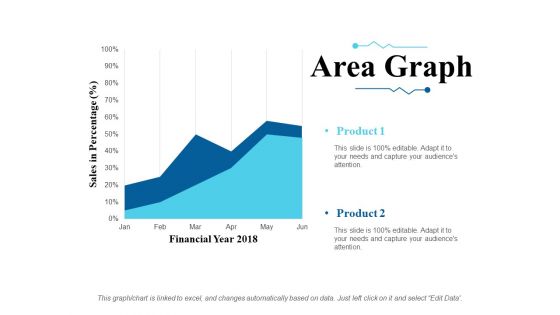
Area Graph Ppt PowerPoint Presentation Slides Ideas
This is a area graph ppt powerpoint presentation slides ideas. This is a two stage process. The stages in this process are sales in percentage, financial year, product.

Financial Performance Logistic Company Investor Fund Raising Pitch Deck Designs PDF
Mentioned slide provides information about digital freight networking company financial performance. It includes business revenue on yearly basis and year to year growth. This modern and well-arranged Financial Performance Logistic Company Investor Fund Raising Pitch Deck Designs PDF provides lots of creative possibilities. It is very simple to customize and edit with the Powerpoint Software. Just drag and drop your pictures into the shapes. All facets of this template can be edited with Powerpoint, no extra software is necessary. Add your own material, put your images in the places assigned for them, adjust the colors, and then you can show your slides to the world, with an animated slide included.

Financial Performance Freight Management Solution Investor Funding Elevator Pitch Deck
Mentioned slide provides information about digital freight networking company financial performance. It includes business revenue on yearly basis and year to year growth. Present like a pro with Financial Performance Freight Management Solution Investor Funding Elevator Pitch Deck. Create beautiful presentations together with your team, using our easy-to-use presentation slides. Share your ideas in real-time and make changes on the fly by downloading our templates. So whether you are in the office, on the go, or in a remote location, you can stay in sync with your team and present your ideas with confidence. With Slidegeeks presentation got a whole lot easier. Grab these presentations today.
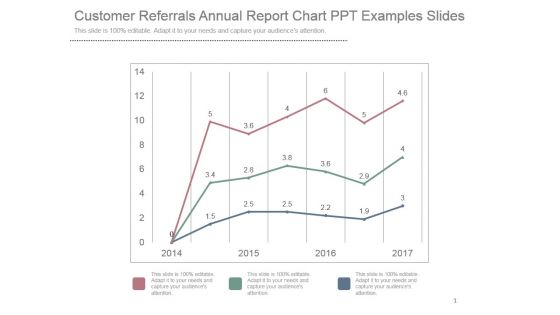
Customer Referrals Annual Report Chart Ppt Examples Slides
This is a customer referrals annual report chart ppt examples slides. This is a three stage process. The stages in this process are business, marketing, graph, success, years.

Column Chart Ppt PowerPoint Presentation Infographic Template Inspiration
This is a column chart ppt powerpoint presentation infographic template inspiration. This is a two stage process. The stages in this process are bar, years, business, marketing, success.
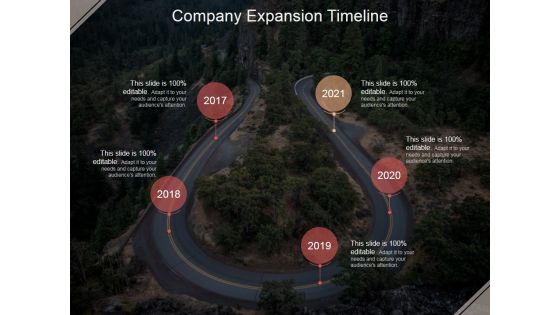
Company Expansion Timeline Ppt PowerPoint Presentation Inspiration
This is a company expansion timeline ppt powerpoint presentation inspiration. This is a five stage process. The stages in this process are year, planning, business, management, marketing.

Combo Chart Ppt PowerPoint Presentation File Model
This is a combo chart ppt powerpoint presentation file model. This is a eight stage process. The stages in this process are product, year, market size, business, marketing.

Market Opportunity Analysis Ppt PowerPoint Presentation Templates
This is a market opportunity analysis ppt powerpoint presentation templates. This is a two stage process. The stages in this process are today, business, marketing, year, financial.
Timeline Ppt PowerPoint Presentation Icon
This is a timeline ppt powerpoint presentation icon. This is a five stage process. The stages in this process are year, timeline, management, future, strategy.

Magnifying Glass Ppt PowerPoint Presentation Background Designs
This is a magnifying glass ppt powerpoint presentation background designs. This is a five stage process. The stages in this process are years, magnify, search, success, time line.
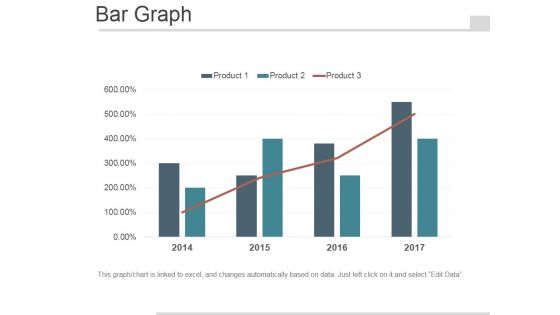
Bar Graph Ppt PowerPoint Presentation Design Ideas
This is a bar graph ppt powerpoint presentation design ideas. This is a four stage process. The stages in this process are business, management, marketing, finance, year.

Expense Model Template 1 Ppt PowerPoint Presentation Rules
This is a expense model template 1 ppt powerpoint presentation rules. This is a seven stage process. The stages in this process are month, year, icons, strategy.
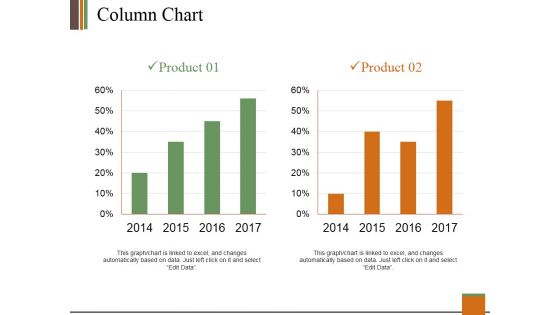
Column Chart Ppt PowerPoint Presentation Model Visuals
This is a column chart ppt powerpoint presentation model visuals. This is a two stage process. The stages in this process are product, year, graph, business, finance.
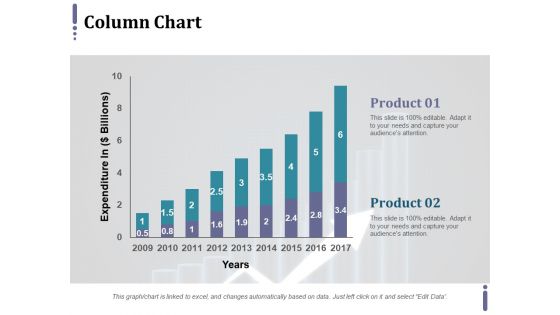
Column Chart Ppt PowerPoint Presentation Model Graphics Example
This is a column chart ppt powerpoint presentation model graphics example. This is a two stage process. The stages in this process are expenditure in, product, years.
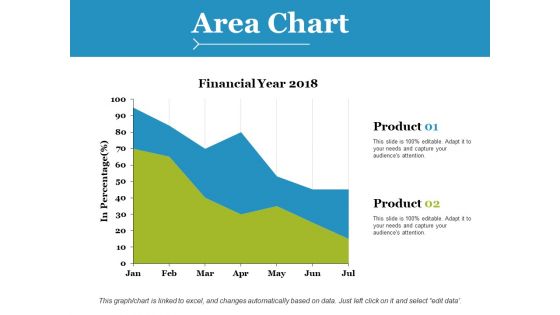
Area Chart Ppt PowerPoint Presentation Styles Brochure
This is a area chart ppt powerpoint presentation styles brochure. This is a two stage process. The stages in this process are product, financial years, in percentage.
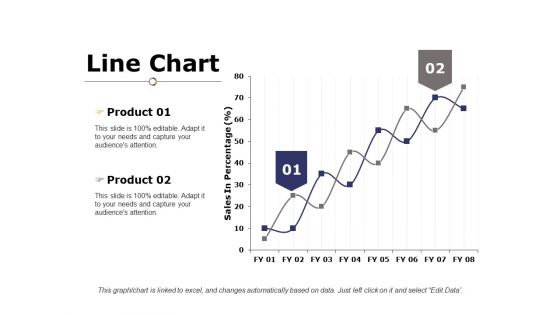
Line Chart Ppt PowerPoint Presentation Gallery Example Introduction
This is a line chart ppt powerpoint presentation portfolio shapes. This is a two stage process. The stages in this process are product, financial years, line chart.
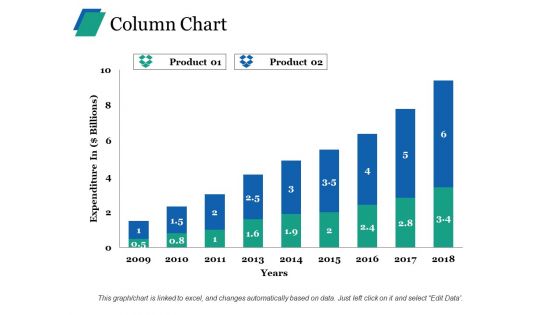
Column Chart Ppt PowerPoint Presentation Ideas Clipart
This is a column chart ppt powerpoint presentation ideas clipart. This is a two stage process. The stages in this process are product, expenditure in, years.

Column Chart Ppt PowerPoint Presentation Show Slideshow
This is a column chart ppt powerpoint presentation show slideshow. This is a two stage process. The stages in this process are product, expenditure, years.
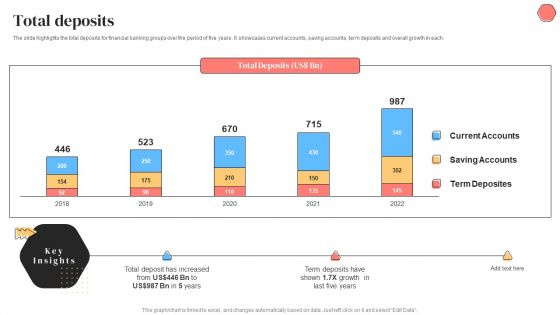
Banking Solutions Company Overview Total Deposits Inspiration PDF
The slide highlights the total deposits for financial banking groups over the period of five years. It showcases current accounts, saving accounts, term deposits and overall growth in each. Deliver and pitch your topic in the best possible manner with this Banking Solutions Company Overview Total Deposits Inspiration PDF. Use them to share invaluable insights on Growth, Term Deposits and impress your audience. This template can be altered and modified as per your expectations. So, grab it now.
Bar Chart Ppt PowerPoint Presentation Icon Information
This is a bar chart ppt powerpoint presentation icon information. This is a one stage process. The stages in this process are product, sales in percentage, financial years, bar graph, growth.

Clustered Column Line Ppt PowerPoint Presentation Show Influencers
This is a clustered column line ppt powerpoint presentation show influencers. This is a four stage process. The stages in this process are financial year, sales in percentage, product, growth, success.
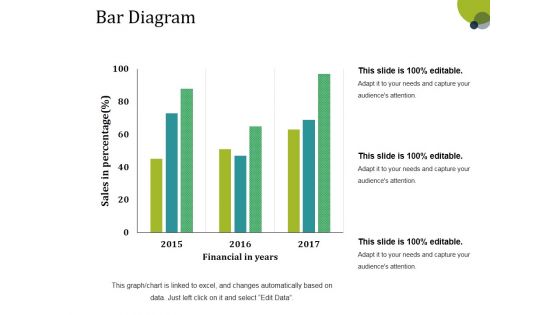
Bar Diagram Ppt PowerPoint Presentation Gallery Structure
This is a bar diagram ppt powerpoint presentation gallery structure. This is a three stage process. The stages in this process are financial in years, sales in percentage, bar graph, growth, success.

Column Chart Ppt PowerPoint Presentation Layouts Tips
This is a column chart ppt powerpoint presentation layouts tips. This is a six stage process. The stages in this process are sales in percentage, financial year, bar graph, growth, success.

Bar Diagram Ppt PowerPoint Presentation Pictures Background Image
This is a bar diagram ppt powerpoint presentation pictures background image. This is a three stage process. The stages in this process are financial in years, sales in percentage, bar graph, growth, success.
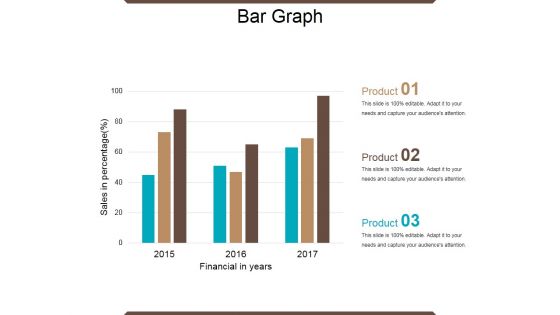
Bar Graph Ppt PowerPoint Presentation Ideas Graphic Tips
This is a bar graph ppt powerpoint presentation ideas graphic tips. This is a three stage process. The stages in this process are financial year, sales in percentage, product, bar graph, growth.

Column Chart Ppt PowerPoint Presentation Ideas Vector
This is a column chart ppt powerpoint presentation ideas vector. This is a two stage process. The stages in this process are column chart, product, financial years, sales in percentage, growth.

Column Chart Ppt PowerPoint Presentation Slides Show
This is a column chart ppt powerpoint presentation slides show. This is a two stage process. The stages in this process are column chart, product, sales in percentage, financial year, growth.

Column Chart Ppt PowerPoint Presentation Slides Visual Aids
This is a column chart ppt powerpoint presentation slides visual aids. This is a six stage process. The stages in this process are bar graph, growth, success, sales in percentage, financial year.
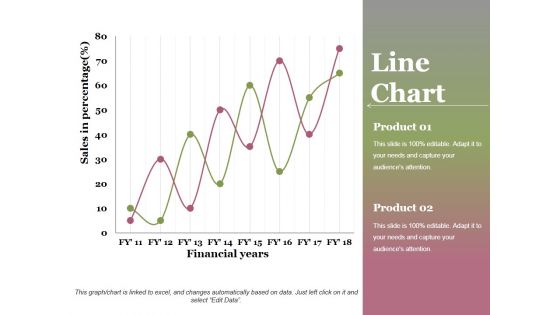
Line Chart Ppt PowerPoint Presentation Professional Graphics Design
This is a line chart ppt powerpoint presentation professional graphics design. This is a two stage process. The stages in this process are financial years, sales in percentage, product, growth, success.

Clustered Column Ppt PowerPoint Presentation File Graphics
This is a clustered column ppt powerpoint presentation file graphics. This is a two stage process. The stages in this process are product, financial year, sales in percentage, graph, growth.

Business Intelligence And Analytics Timeline Ppt PowerPoint Presentation Shapes
This is a business intelligence and analytics timeline ppt powerpoint presentation shapes. This is a five stage process. The stages in this process are year, business, growth, success, timeline.
Clustered Column Line Ppt PowerPoint Presentation Icon Good
This is a clustered column line ppt powerpoint presentation icon good. This is a three stage process. The stages in this process are product, financial year, bar graph, business, growth.

Combo Chart Ppt PowerPoint Presentation Slides Outline
This is a combo chart ppt powerpoint presentation slides outline. This is a three stage process. The stages in this process are combo chart, growth, product, financial year, business.

Line Chart Ppt PowerPoint Presentation Outline Infographic Template
This is a line chart ppt powerpoint presentation outline infographic template. This is a two stage process. The stages in this process are in percentage, product, in year, growth, success.
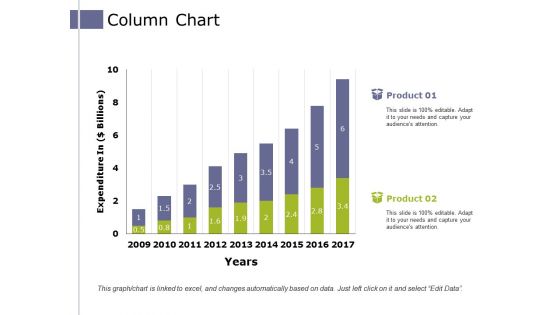
Column Chart Ppt PowerPoint Presentation Styles Graphics Design
This is a column chart ppt powerpoint presentation styles graphics design. This is a two stage process. The stages in this process are expenditure in, product, years, growth, success.

Area Chart Ppt PowerPoint Presentation Show Layout Ideas
This is a area chart ppt powerpoint presentation show layout ideas. This is a two stage process. The stages in this process are product, in percentage, financial year, growth.

Line Chart Ppt PowerPoint Presentation Layouts Show
This is a line chart ppt powerpoint presentation layouts show. This is a two stage process. The stages in this process are product, in years, in percentage, line chart, growth.
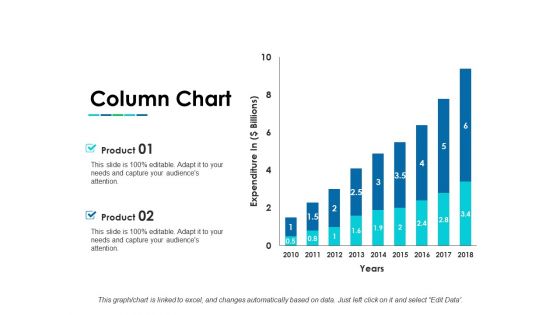
Column Chart Ppt PowerPoint Presentation Gallery Background Images
This is a column chart ppt powerpoint presentation gallery background images. This is a two stage process. The stages in this process are column chart, product, year, growth, expenditure.
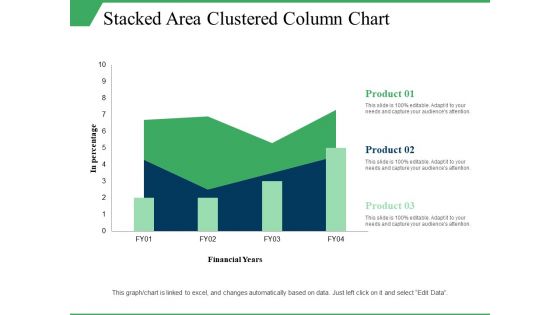
Stacked Area Clustered Column Chart Ppt PowerPoint Presentation Visual Aids Model
This is a stacked area clustered column chart ppt powerpoint presentation visual aids model. This is a three stage process. The stages in this process are in percentage, product, financial years, growth, column chart.
Column Chart Ppt PowerPoint Presentation Icon Show
This is a column chart ppt powerpoint presentation icon show. This is a two stage process. The stages in this process are column chart, product, years, bar graph, growth.

Stacked Column Chart Ppt PowerPoint Presentation Summary Gallery
This is a stacked column chart ppt powerpoint presentation summary gallery. This is a two stage process. The stages in this process are stacked column chart, product, in years, growth, percentage.
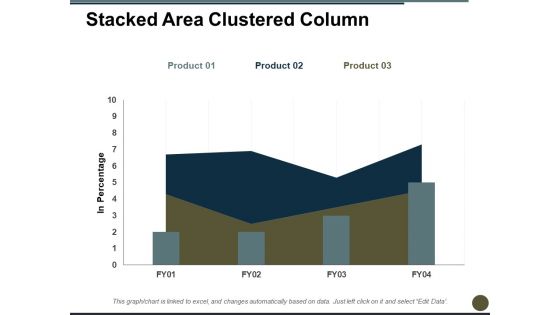
Stacked Area Clustered Column Ppt PowerPoint Presentation Professional Graphics
This is a stacked area clustered column ppt powerpoint presentation professional graphics. This is a three stage process. The stages in this process are in percentage, bar chart, product, growth, year.

Timeline For Digital Marketing Development Ppt PowerPoint Presentation Visuals
This is a timeline for digital marketing development ppt powerpoint presentation visuals. This is a five stage process. The stages in this process are year, success, arrows, time planning, growth.
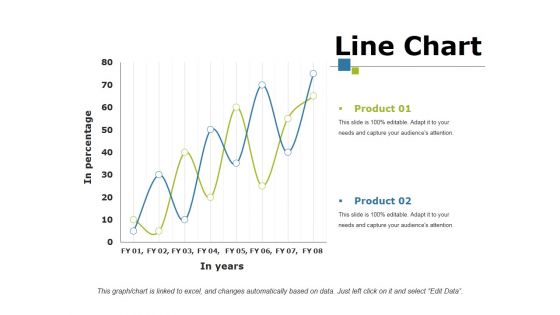
Line Chart Ppt PowerPoint Presentation Portfolio Mockup
This is a line chart ppt powerpoint presentation portfolio mockup. This is a two stage process. The stages in this process are product, in percentage, in year, growth, success.
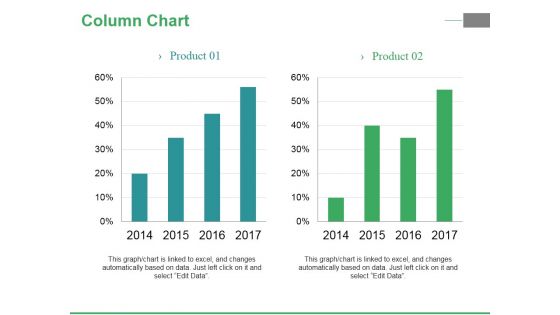
Column Chart Ppt PowerPoint Presentation Pictures Graphic Images
This is a column chart ppt powerpoint presentation pictures graphic images. This is a two stage process. The stages in this process are product, years, growth, success, bar graph.
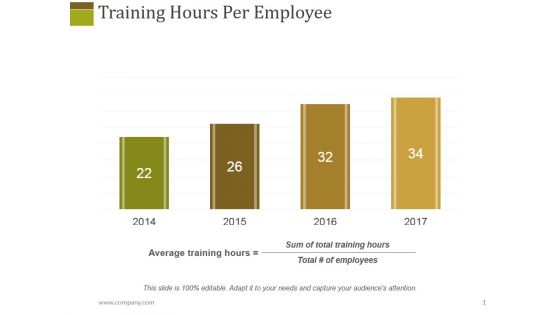
Training Hours Per Employee Ppt PowerPoint Presentation Styles Influencers
This is a training hours per employee ppt powerpoint presentation styles influencers. This is a four stage process. The stages in this process are average training hours, sum of total training hours, year, growth.

Planning For Future Workforce Needs Ppt PowerPoint Presentation Outline Smartart
This is a planning for future workforce needs ppt powerpoint presentation outline smartart. This is a three stage process. The stages in this process are growth, percentage, number of headcount, year, finance.

Line Chart Ppt PowerPoint Presentation File Example File
This is a line chart ppt powerpoint presentation file example file. This is a two stage process. The stages in this process are product, in percentage, in years, growth, success.
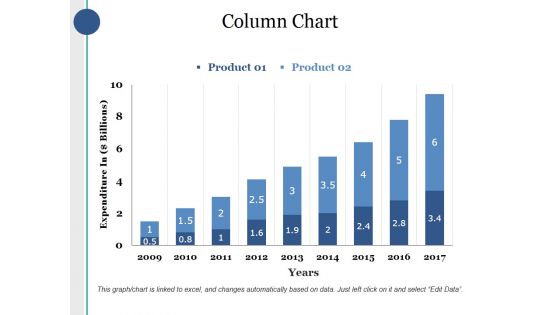
Column Chart Ppt PowerPoint Presentation Infographics Deck
This is a column chart ppt powerpoint presentation infographics deck. This is a two stage process. The stages in this process are product, expenditure in, years, bar graph, growth.
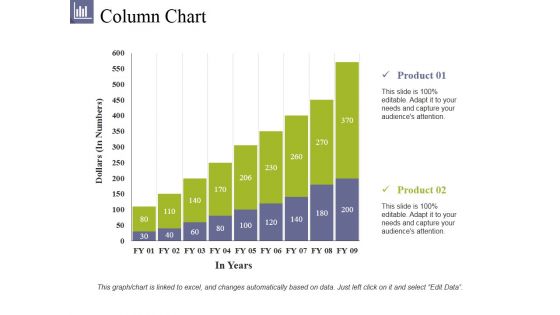
Column Chart Ppt PowerPoint Presentation File Summary
This is a column chart ppt powerpoint presentation file summary. This is a two stage process. The stages in this process are product, dollars, in years, bar graph, growth.
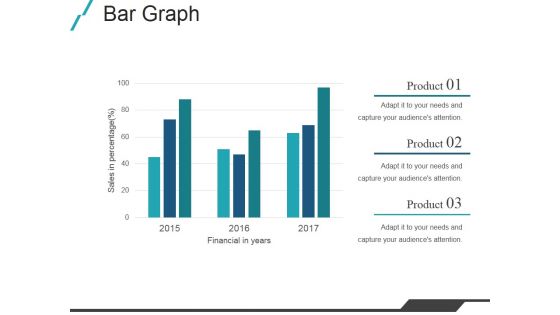
Bar Graph Ppt PowerPoint Presentation Slides Deck
This is a bar graph ppt powerpoint presentation slides deck. This is a three stage process. The stages in this process are financial in years, product, sales in percentage.
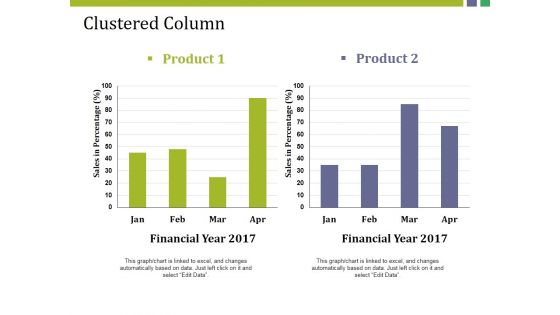
Clustered Column Ppt PowerPoint Presentation Gallery Structure
This is a clustered column ppt powerpoint presentation gallery structure. This is a two stage process. The stages in this process are product, sales in percentage, financial year, bar graph, finance.
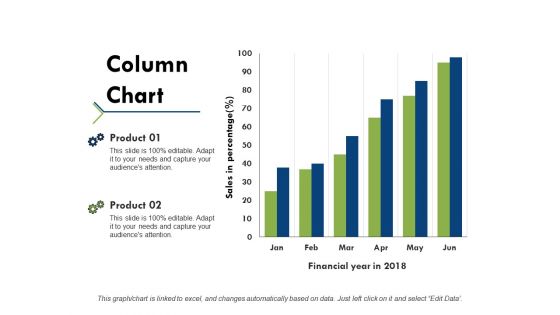
Column Chart Ppt PowerPoint Presentation Portfolio Example Topics
This is a column chart ppt powerpoint presentation portfolio example topics. This is a two stage process. The stages in this process are product, financial year, sales in percentage, column chart.

Clustered Column Ppt PowerPoint Presentation File Slide
This is a clustered column ppt powerpoint presentation file slide. This is a two stage process. The stages in this process are product, financial year, sales in percentage, bar graph.

 Home
Home