Year Over Year Growth
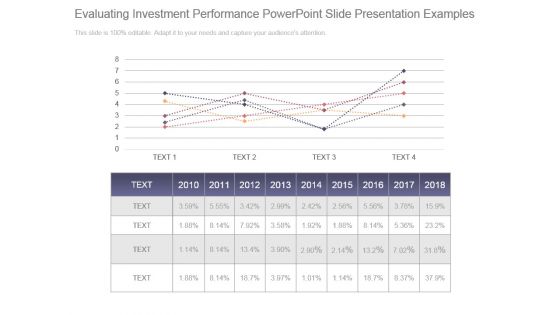
Evaluating Investment Performance Powerpoint Slide Presentation Examples
This is a evaluating investment performance powerpoint slide presentation examples. This is a five stage process. The stages in this process are graph, year, planning, growth, success.
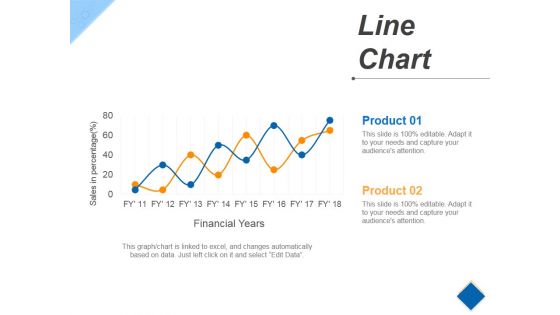
Line Chart Ppt PowerPoint Presentation Pictures Maker
This is a line chart ppt powerpoint presentation pictures maker. This is a two stage process. The stages in this process are financial years, product, growth, success.

Line Chart Ppt PowerPoint Presentation Pictures Layout
This is a line chart ppt powerpoint presentation pictures layout. This is a two stage process. The stages in this process are product, financial years, sales in percentage.

Line Chart Ppt PowerPoint Presentation Layouts Templates
This is a line chart ppt powerpoint presentation layouts templates. This is a two stage process. The stages in this process are product, in percentage, in years.

Historical Revenue Wireless Communication Services Provider Company Profile CP SS V
Mentioned slide displays company previous five years revenue along with year on year growth and decline. It includes key points such as yearly revenue in US dollar Billion, CAGR, YoY decline and growth, and key insights.Formulating a presentation can take up a lot of effort and time, so the content and message should always be the primary focus. The visuals of the PowerPoint can enhance the presenters message, so our Historical Revenue Wireless Communication Services Provider Company Profile CP SS V was created to help save time. Instead of worrying about the design, the presenter can concentrate on the message while our designers work on creating the ideal templates for whatever situation is needed. Slidegeeks has experts for everything from amazing designs to valuable content, we have put everything into Historical Revenue Wireless Communication Services Provider Company Profile CP SS V.
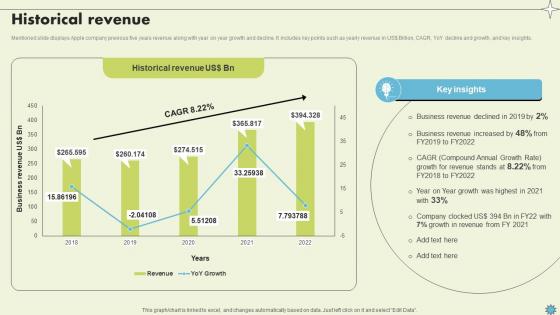
Historical Revenue Consumer Electronics Company Profile CP SS V
Mentioned slide displays Apple company previous five years revenue along with year on year growth and decline. It includes key points such as yearly revenue in USdollar Billion, CAGR, YoY decline and growth, and key insights.Do you know about Slidesgeeks Historical Revenue Consumer Electronics Company Profile CP SS V These are perfect for delivering any kind od presentation. Using it, create PowerPoint presentations that communicate your ideas and engage audiences. Save time and effort by using our pre-designed presentation templates that are perfect for a wide range of topic. Our vast selection of designs covers a range of styles, from creative to business, and are all highly customizable and easy to edit. Download as a PowerPoint template or use them as Google Slides themes.

Network Marketing Company Profile Netsurf Turnover 2002 2022 Rules PDF
This slide represents the Netsurf turnover from last 20 years from 2002 to 2022 which shows increasing trend year after year. It also showcases compound annual growth rate From laying roadmaps to briefing everything in detail, our templates are perfect for you. You can set the stage with your presentation slides. All you have to do is download these easy to edit and customizable templates. Network Marketing Company Profile Netsurf Turnover 2002 2022 Rules PDF will help you deliver an outstanding performance that everyone would remember and praise you for. Do download this presentation today.

Quantum Computing For Everyone IT Quantum Computing At A Glance Pictures PDF
This slide depicts the growth of quantum computers in different years, starting from the year 1980 to the year 2019. Presenting quantum computing for everyone it quantum computing at a glance pictures pdf to provide visual cues and insights. Share and navigate important information on seven stages that need your due attention. This template can be used to pitch topics like quantum computing at a glance, 1980 to 2019. In addtion, this PPT design contains high resolution images, graphics, etc, that are easily editable and available for immediate download.
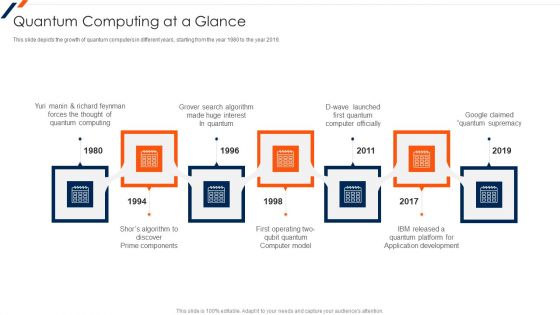
Quantum Computing At A Glance Ppt Infographic Template Graphics Example PDF
This slide depicts the growth of quantum computers in different years, starting from the year 1980 to the year 2019. Presenting Quantum Computing At A Glance Ppt Infographic Template Graphics Example PDF to provide visual cues and insights. Share and navigate important information on seven stages that need your due attention. This template can be used to pitch topics like Application Development, Computer Model. In addtion, this PPT design contains high resolution images, graphics, etc, that are easily editable and available for immediate download.
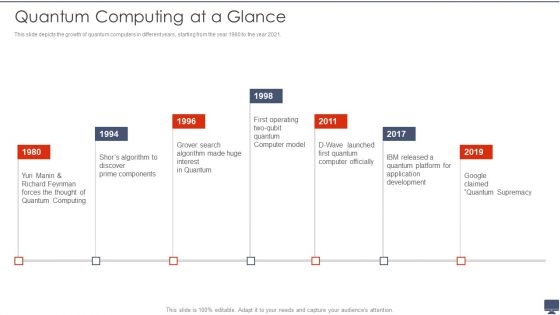
Quantum Computing At A Glance Ppt Show Example File PDF
This slide depicts the growth of quantum computers in different years, starting from the year 1980 to the year 2021.This is a Quantum Computing At A Glance Ppt Show Example File PDF template with various stages. Focus and dispense information on seven stages using this creative set, that comes with editable features. It contains large content boxes to add your information on topics like Quantum Computing, Application Development, Prime Components. You can also showcase facts, figures, and other relevant content using this PPT layout. Grab it now.
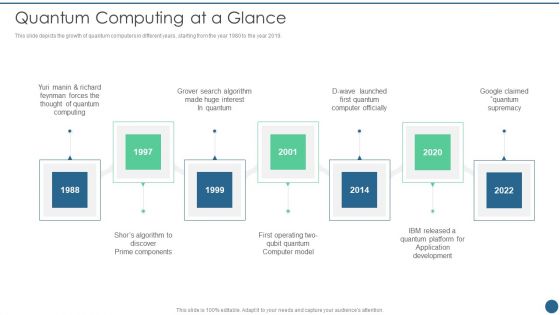
Quantum Key Distribution Quantum Computing At A Glance Background PDF
This slide depicts the growth of quantum computers in different years, starting from the year 1980 to the year 2019.Presenting Quantum Key Distribution Quantum Computing At A Glance Background PDF to provide visual cues and insights. Share and navigate important information on seven stages that need your due attention. This template can be used to pitch topics like Thought Of Quantum, Search Algorithm, Computer Officially In addtion, this PPT design contains high resolution images, graphics, etc, that are easily editable and available for immediate download.
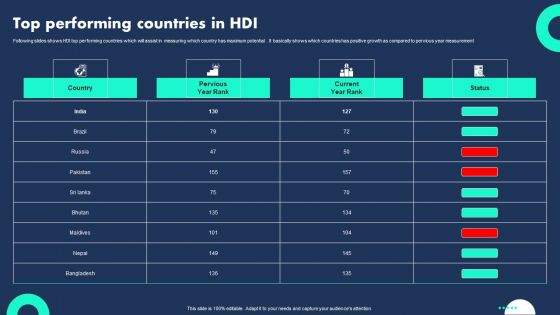
Top Performing Countries In HDI Guidelines PDF
Following slides shows HDI top performing countries which will assist in measuring which country has maximum potential . It basically shows which countries has positive growth as compared to pervious year measurement. Showcasing this set of slides titled Top Performing Countries In HDI Guidelines PDF. The topics addressed in these templates are Country, Pervious Year Rank, Current Year Rank . All the content presented in this PPT design is completely editable. Download it and make adjustments in color, background, font etc. as per your unique business setting.

Area Ppt PowerPoint Presentation Show
This is a area ppt powerpoint presentation show. This is a two stage process. The stages in this process are area, bar graph, growth, years, business.

Combo Chart Ppt PowerPoint Presentation Portfolio Infographics
This is a combo chart ppt powerpoint presentation portfolio infographics. This is a eight stage process. The stages in this process are market size, growth, years, finance, business.
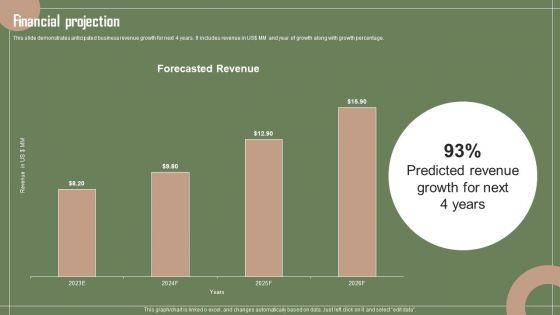
Data Automation Solution Investor Funding Presentation Financial Projection Structure PDF
This slide demonstrates anticipated business revenue growth for next 4 years. It includes revenue in USdoller MM and year of growth along with growth percentage. Present like a pro with Data Automation Solution Investor Funding Presentation Financial Projection Structure PDF Create beautiful presentations together with your team, using our easy to use presentation slides. Share your ideas in real time and make changes on the fly by downloading our templates. So whether you are in the office, on the go, or in a remote location, you can stay in sync with your team and present your ideas with confidence. With Slidegeeks presentation got a whole lot easier. Grab these presentations today.
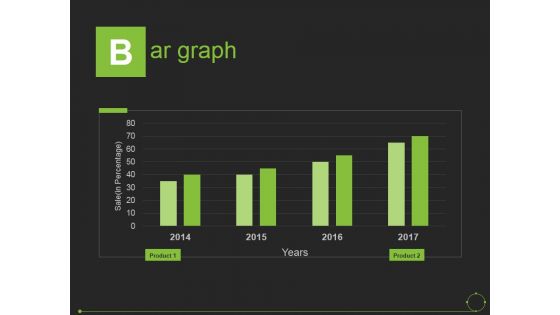
Bar Graph Ppt PowerPoint Presentation Portfolio Background
This is a bar graph ppt powerpoint presentation portfolio background. This is a four stage process. The stages in this process are sale, years, product.
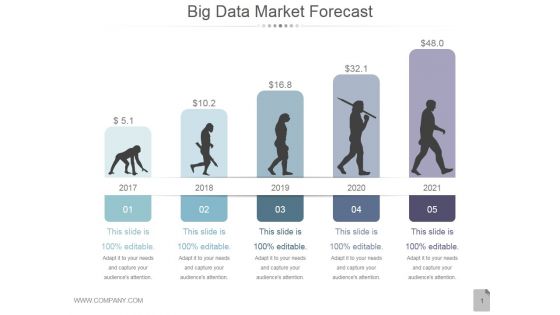
Big Data Market Forecast Ppt PowerPoint Presentation Clipart
This is a big data market forecast ppt powerpoint presentation clipart. This is a five stage process. The stages in this process are business, marketing, management, planning, years.
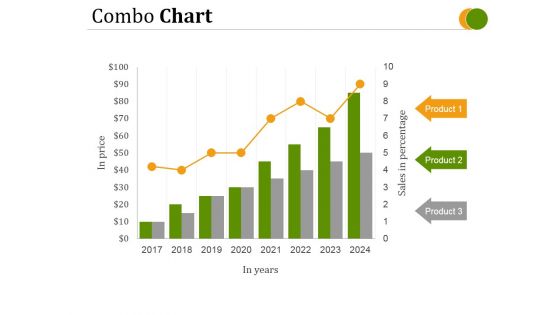
Combo Chart Ppt PowerPoint Presentation Deck
This is a combo chart ppt powerpoint presentation deck. This is a eight stage process. The stages in this process are in price, in years, product.

Line Chart Ppt PowerPoint Presentation Ideas Portfolio
This is a line chart ppt powerpoint presentation ideas portfolio. This is a two stage process. The stages in this process are line chart, in years, in percentage.

Stacked Column Ppt PowerPoint Presentation Slides Introduction
This is a stacked column ppt powerpoint presentation slides introduction. This is a nine stage process. The stages in this process are years, profit, product, business, marketing.

Column Chart Ppt PowerPoint Presentation Ideas Styles
This is a column chart ppt powerpoint presentation ideas styles. This is a two stage process. The stages in this process are dollars, product, planning, business, years.

Column Chart Ppt PowerPoint Presentation Ideas Guidelines
This is a column chart ppt powerpoint presentation ideas guidelines. This is a two stage process. The stages in this process are column chart, product, year, business, marketing.

Intelligent Architecture Market Overview Ppt Slides Display PDF
The slide provides the market size of Intelligent Infrastructure Market from the year 2018 to 2021. It also provides the forecast for the year 2026, along with the key reasons for growth Deliver an awe inspiring pitch with this creative intelligent architecture market overview ppt slides display pdf bundle. Topics like investment, digitalization, business operations can be discussed with this completely editable template. It is available for immediate download depending on the needs and requirements of the user.
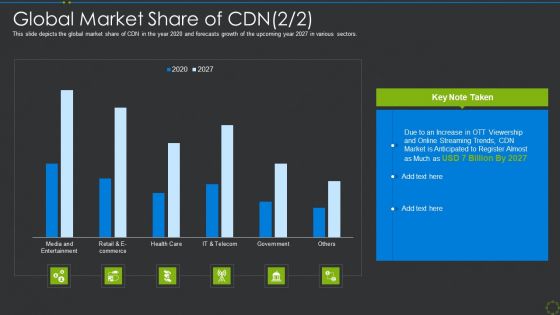
Global Market Share Of Cdn Ppt Show Gallery PDF
This slide depicts the global market share of CDN in the year 2020 and forecasts growth of the upcoming year 2027 in various sectors. Deliver and pitch your topic in the best possible manner with this global market share of cdn ppt show gallery pdf. Use them to share invaluable insights on global market share of cdn and impress your audience. This template can be altered and modified as per your expectations. So, grab it now.
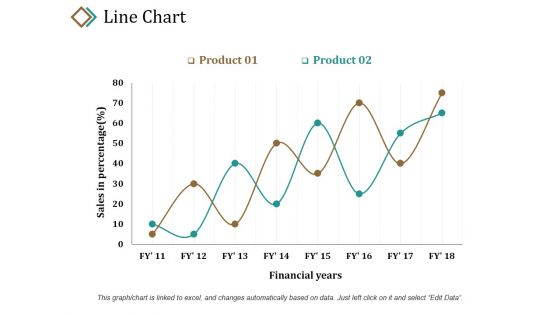
Line Chart Ppt PowerPoint Presentation Layouts Example
This is a line chart ppt powerpoint presentation layouts example. This is a two stage process. The stages in this process are sales in percentage, product, financial years, growth, success.
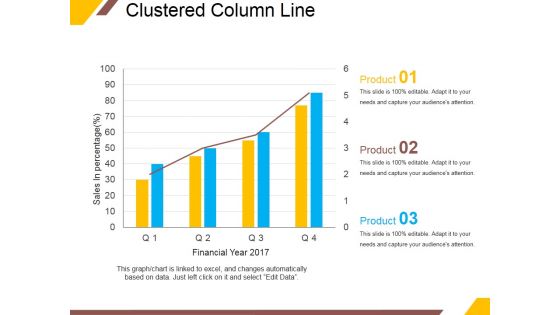
Clustered Column Line Ppt PowerPoint Presentation Portfolio Outline
This is a clustered column line ppt powerpoint presentation portfolio outline. This is a four stage process. The stages in this process are sales in percentage, financial year, product, graph, growth.

Column Chart Ppt PowerPoint Presentation Gallery Slide Portrait
This is a column chart ppt powerpoint presentation gallery slide portrait. This is a two stage process. The stages in this process are sales in percentage, financial year, product, bar graph, growth.

Line Chart Ppt PowerPoint Presentation Show Guide
This is a line chart ppt powerpoint presentation show guide. This is a two stage process. The stages in this process are product, sales in percentage, financial years, growth, success.

Line Chart Ppt PowerPoint Presentation Gallery Rules
This is a line chart ppt powerpoint presentation gallery rules. This is a two stage process. The stages in this process are financial years, product, sales in percentage, line chart, growth.
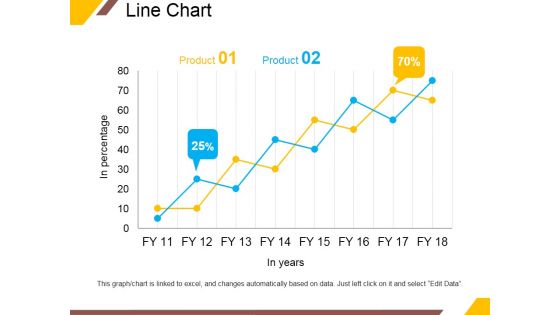
Line Chart Ppt PowerPoint Presentation Portfolio Infographic Template
This is a line chart ppt powerpoint presentation portfolio infographic template. This is a two stage process. The stages in this process are product, in years, business, percentage, growth.
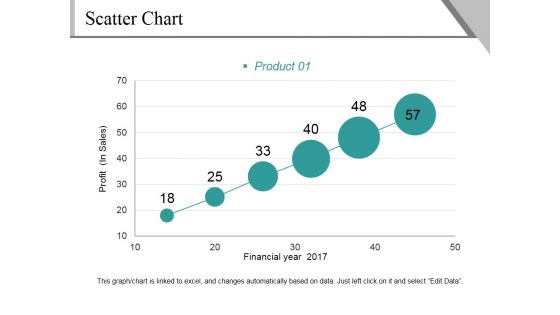
Scatter Chart Ppt PowerPoint Presentation File Background Image
This is a scatter chart ppt powerpoint presentation file background image. This is a six stage process. The stages in this process are profit, financial year, product, growth, success.
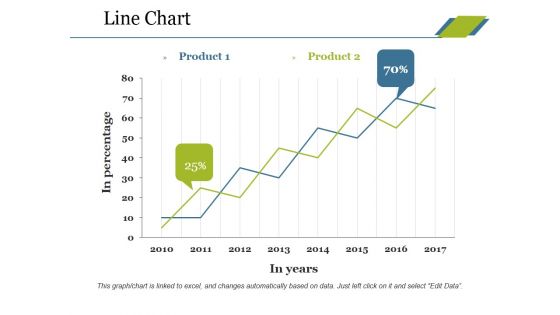
Line Chart Ppt PowerPoint Presentation Professional Tips
This is a line chart ppt powerpoint presentation professional tips. This is a two stage process. The stages in this process are product, in percentage, in years, growth, success.

Line Chart Ppt PowerPoint Presentation Slides Ideas
This is a line chart ppt powerpoint presentation slides ideas. This is a two stage process. The stages in this process are product, in percentage, in years, growth, success.
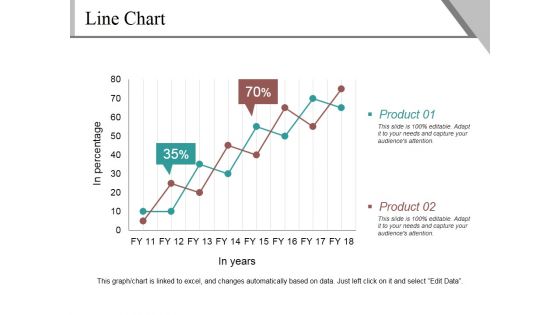
Line Chart Ppt PowerPoint Presentation Infographics Example
This is a line chart ppt powerpoint presentation infographics example. This is a two stage process. The stages in this process are product, in percentage, in years, finance, growth.

Line Chart Ppt PowerPoint Presentation Slides Mockup
This is a line chart ppt powerpoint presentation slides mockup. This is a two stage process. The stages in this process are in percentage, in years, product, growth, success.

Executive Summary Market Overview Ppt PowerPoint Presentation Background Designs
This is a executive summary market overview ppt powerpoint presentation background designs. This is a ten stage process. The stages in this process are market stage, market revenue, base year market growth rate, compound annual growth rate, customer price sensitivity, degree of technical change, market concentration.

Executive Summarymarket Overview Ppt PowerPoint Presentation Background Images
This is a executive summarymarket overview ppt powerpoint presentation background images. This is a eight stage process. The stages in this process are market revenue, base year market growth rate, compound annual growth rate, average price per-unit, industrial cameras, degree of technical change, market concentration.
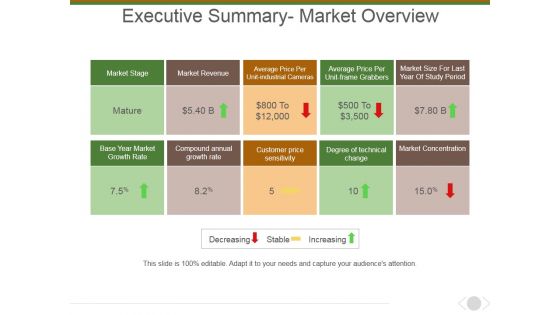
Executive Summary Market Overview Ppt PowerPoint Presentation Model Professional
This is a executive summary market overview ppt powerpoint presentation model professional. This is a ten stage process. The stages in this process are market stage, base year market growth rate, compound annual growth rate, customer price sensitivity, degree of technical change.
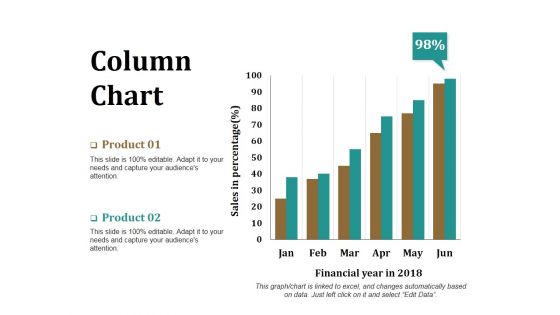
Column Chart Ppt PowerPoint Presentation Model Graphics Download
This is a column chart ppt powerpoint presentation model graphics download. This is a two stage process. The stages in this process are product, financial year, sales in percentage, bar graph, success.

Line Chart Ppt PowerPoint Presentation Infographics Infographics
This is a line chart ppt powerpoint presentation infographics infographics. This is a two stage process. The stages in this process are product, sales in percentage, financial year, line chart, finance.

Line Chart Ppt PowerPoint Presentation Gallery Templates
This is a line chart ppt powerpoint presentation gallery templates. This is a two stage process. The stages in this process are product, financial years, sales in percentage, line chart.

Line With Markers Ppt PowerPoint Presentation Styles Slide Portrait
This is a line with markers ppt powerpoint presentation styles slide portrait. This is a two stage process. The stages in this process are sales in percentage, financial years, product.

Bar Chart Ppt PowerPoint Presentation Infographics Format Ideas
This is a bar chart ppt powerpoint presentation infographics format ideas. This is a two stage process. The stages in this process are bar graph, product, financial year, sales in percentage.
Scatter Bubble Chart Ppt PowerPoint Presentation Icon Elements
This is a scatter bubble chart ppt powerpoint presentation icon elements. This is a six stage process. The stages in this process are highest profit, profit, financial year, product.
Area Chart Ppt PowerPoint Presentation Icon Show
This is a area chart ppt powerpoint presentation icon show. This is a two stage process. The stages in this process are product, financial year, in percentage, area chart.

Clustered Chart Ppt PowerPoint Presentation Outline Templates
This is a clustered chart ppt powerpoint presentation outline templates. This is a three stage process. The stages in this process are product, in percentage, in years, clustered chart.

Statistics Highlighting Marketing Tech Vendors Rise Comprehensive Guide For Marketing Technology
Mentioned slide demonstrates business marketing technology vendors growth over the years. It includes key elements such as number od vendors, years of growth, and key insights. Want to ace your presentation in front of a live audience Our Statistics Highlighting Marketing Tech Vendors Rise Comprehensive Guide For Marketing Technology can help you do that by engaging all the users towards you. Slidegeeks experts have put their efforts and expertise into creating these impeccable powerpoint presentations so that you can communicate your ideas clearly. Moreover, all the templates are customizable, and easy-to-edit and downloadable. Use these for both personal and commercial use.
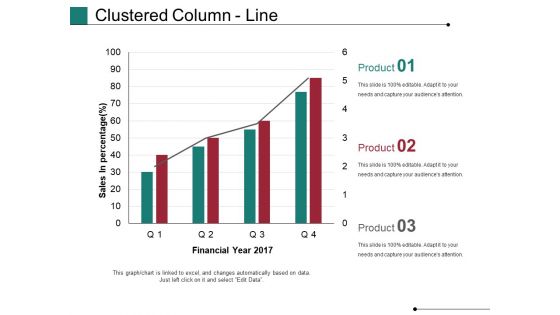
Clustered Column Line Ppt PowerPoint Presentation Model Rules
This is a clustered column line ppt powerpoint presentation model rules. This is a four stage process. The stages in this process are financial year, sales in percentage, business, marketing, growth, graph.
Crm Dashboard Deals By Expected Close Date Ppt PowerPoint Presentation Icon
This is a crm dashboard deals by expected close date ppt powerpoint presentation icon. This is a three stage process. The stages in this process are deals by expected close date, years, planning, business, growth.
Financial Projection Graph Template 1 Ppt PowerPoint Presentation Icon Summary
This is a financial projection graph template 1 ppt powerpoint presentation icon summary. This is a three stage process. The stages in this process are annual sales forecast, years, business, marketing, management.
Area Chart Ppt PowerPoint Presentation Icon Layout Ideas
This is a area chart ppt powerpoint presentation icon layout ideas. This is a two stage process. The stages in this process are area chart, sales in percentage, years, planning, business.

Column Chart Ppt PowerPoint Presentation Gallery Design Inspiration
This is a column chart ppt powerpoint presentation gallery design inspiration. This is a two stage process. The stages in this process are column chart, product, sales in percentage, financial years.

Area Chart Financial Ppt PowerPoint Presentation Outline Professional
This is a area chart financial ppt powerpoint presentation outline professional. This is a four stage process. The stages in this process are product, sales in percentage, financial year.

Bar Chart Template 1 Ppt PowerPoint Presentation Background Images
This is a bar chart template 1 ppt powerpoint presentation background images. This is a twelve stage process. The stages in this process are product, bar chart, dollars, year.

Bar Graph Template 2 Ppt PowerPoint Presentation Introduction
This is a bar graph template 2 ppt powerpoint presentation introduction. This is a four stage process. The stages in this process are bar graph, presentation, year, planning, marketing.
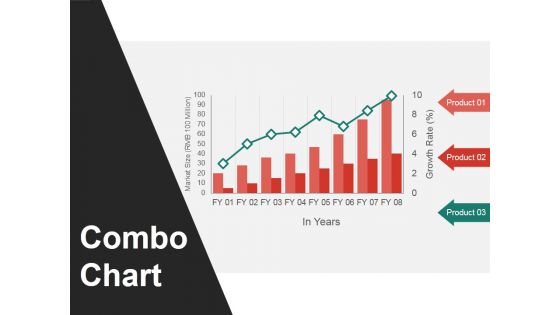
Combo Chart Ppt PowerPoint Presentation Gallery Visual Aids
This is a combo chart ppt powerpoint presentation gallery visual aids. This is a three stage process. The stages in this process are combo chart, in years, market size, product.

Staked Line With Markers Ppt PowerPoint Presentation Pictures Examples
This is a staked line with markers ppt powerpoint presentation pictures examples. This is a one stage process. The stages in this process are years, profit, product, business, marketing.

Combo Chart Ppt PowerPoint Presentation Infographics Summary
This is a combo chart ppt powerpoint presentation infographics summary. This is a three stage process. The stages in this process are market size, product, combo chart, years, business.
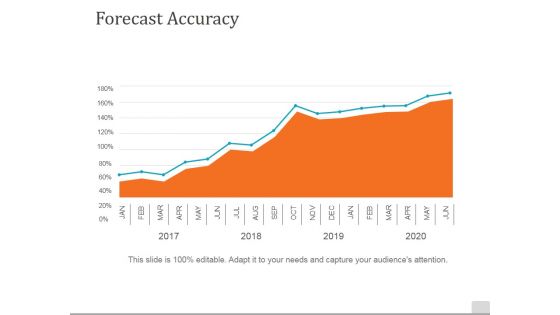
Forecast Accuracy Template 2 Ppt PowerPoint Presentation Pictures Grid
This is a forecast accuracy template 2 ppt powerpoint presentation pictures grid. This is a one stage process. The stages in this process are forecast accuracy, business, marketing, planning, years.
Dividend Per Share Ppt PowerPoint Presentation Icon Design Templates
This is a dividend per share ppt powerpoint presentation icon design templates. This is a five stage process. The stages in this process are business, years, planning, management, marketing.

 Home
Home