Year Over Year Growth

Bar Graph Ppt PowerPoint Presentation Design Templates
This is a bar graph ppt powerpoint presentation design templates. This is a four stage process. The stages in this process are business, marketing, success, growth, years.
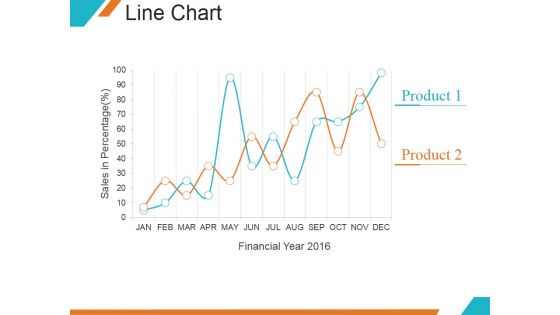
Line Chart Ppt PowerPoint Presentation Samples
This is a line chart ppt powerpoint presentation samples. This is a two stage process. The stages in this process are financial year, product, growth, marketing.
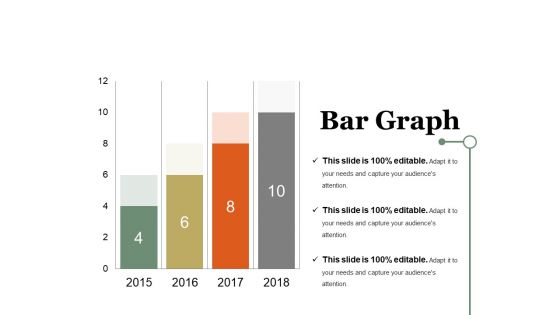
Bar Graph Ppt PowerPoint Presentation Summary Inspiration
This is a bar graph ppt powerpoint presentation summary inspiration. This is a four stage process. The stages in this process are graph, business, marketing, growth, years.

Area Chart Ppt PowerPoint Presentation Samples
This is a area chart ppt powerpoint presentation samples. This is a two stage process. The stages in this process are financial year, sales in percentage, jan, feb.

Bar Graph Ppt PowerPoint Presentation Pictures Display
This is a bar graph ppt powerpoint presentation pictures display. This is a one stage process. The stages in this process are sales in percentage, financial year.
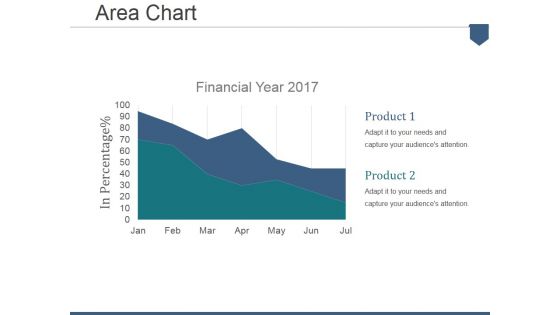
Area Chart Ppt PowerPoint Presentation Summary Example
This is a area chart ppt powerpoint presentation summary example. This is a two stage process. The stages in this process are financial year, in percentage, product.

Line Chart Ppt PowerPoint Presentation Layouts Background Image
This is a line chart ppt powerpoint presentation layouts background image. This is a two stage process. The stages in this process are in percentage, in years, product.
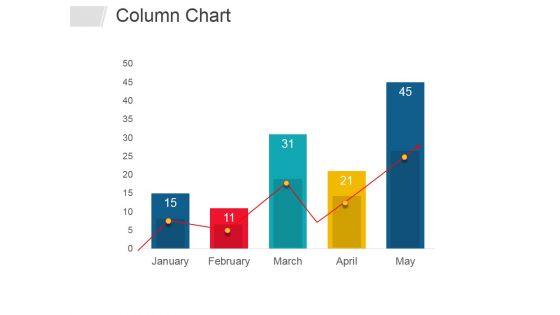
Column Chart Ppt PowerPoint Presentation Layouts Layout
This is a column chart ppt powerpoint presentation layouts layout. This is a five stage process. The stages in this process are column chart, years, business, management, marketing.

Combo Chart Ppt PowerPoint Presentation Slides Introduction
This is a combo chart ppt powerpoint presentation slides introduction. This is a four stage process. The stages in this process are profit, years, business, marketing, graph.

Battery Chart With Percentage Values For Comparison PowerPoint Slides
This year?s sales has matched up with your expectations. Now match this slide with your presentation to show the same. Show your company?s performance or business growth with this four staged battery chart PowerPoint template. With this slide, you can easily convince your colleagues how your company gave a tremendous growth over the years or months. Perfect illustration to show that the targets are achieved. This PPT template is easy to edit. You can choose the color of your choice. Your colleagues are already impressed with the sales growth. Now impress others and choose this PPT innovative designed template.
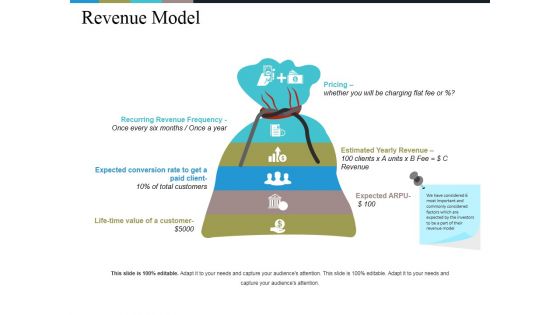
Revenue Model Ppt PowerPoint Presentation Professional Maker
This is a revenue model ppt powerpoint presentation professional maker. This is a six stage process. The stages in this process are recurring revenue frequency, life time value of a customer, pricing, estimated yearly revenue, expected arpu.
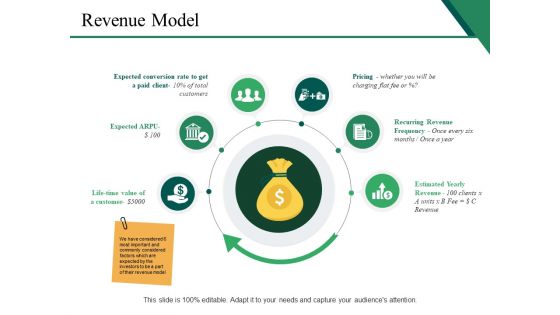
Revenue Model Ppt PowerPoint Presentation Ideas Objects
This is a revenue model ppt powerpoint presentation ideas objects. This is a six stage process. The stages in this process are expected arpu, expected conversion rate to get a paid client, pricing, recurring revenue frequency, estimated yearly revenue.

Evolution Of Quality Management System Ppt PowerPoint Presentation Visuals
This is a evolution of quality management system ppt powerpoint presentation visuals. This is a six stage process. The stages in this process are growth, year, business, marketing, success.
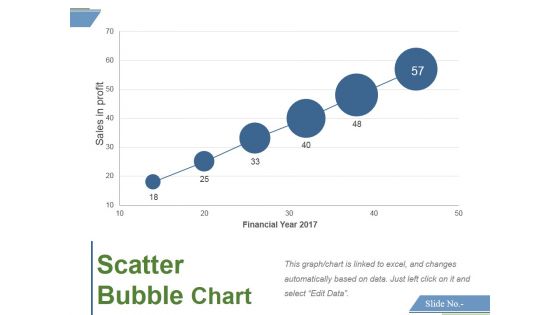
Scatter Bubble Chart Ppt PowerPoint Presentation Professional Model
This is a scatter bubble chart ppt powerpoint presentation professional model. This is a six stage process. The stages in this process are sales in profit, financial year, growth, business, marketing, strategy.

Line Bubble Chart Ppt PowerPoint Presentation Portfolio Slide Portrait
This is a line bubble chart ppt powerpoint presentation portfolio slide portrait. This is a six stage process. The stages in this process are highest profit, financial year, profit in sales, growth, business.
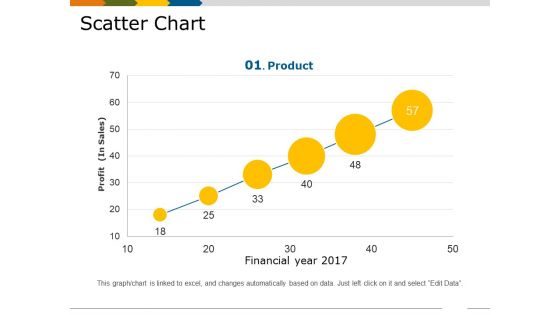
Scatter Chart Template 1 Ppt PowerPoint Presentation Show Slides
This is a scatter chart template 1 ppt powerpoint presentation show slides. This is a six stage process. The stages in this process are financial year, profit in sales, growth, business, marketing, product.
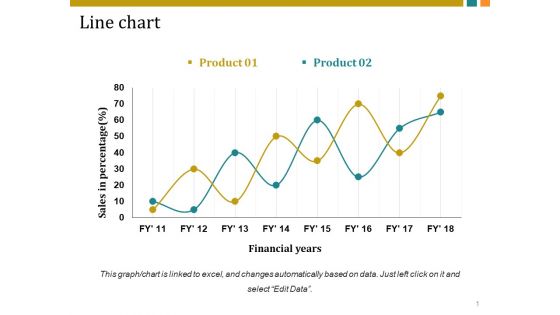
Line Chart Ppt PowerPoint Presentation Inspiration Vector
This is a line chart ppt powerpoint presentation inspiration vector. This is a two stage process. The stages in this process are sales in percentage, financial years, business, marketing, growth.

Line Chart Ppt PowerPoint Presentation Infographics Graphic Images
This is a line chart ppt powerpoint presentation infographics graphic images. This is a two stage process. The stages in this process are sales in percentage, financial years, growth, business, marketing.
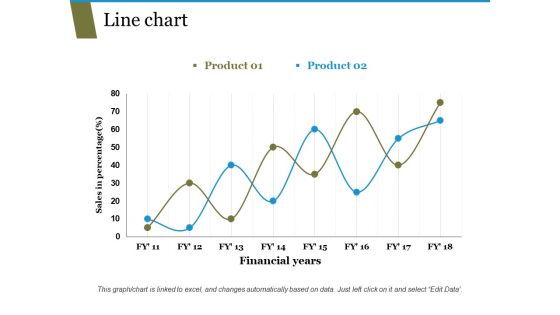
Line Chart Ppt PowerPoint Presentation Pictures Templates
This is a line chart ppt powerpoint presentation pictures templates. This is a two stage process. The stages in this process are sales in percentage, financial years, business, marketing, growth.

Big Data Market Forecast Ppt PowerPoint Presentation Ideas Information
This is a big data market forecast ppt powerpoint presentation ideas information. This is a five stage process. The stages in this process are years, planning, growth, business, marketing.

Line Chart Ppt PowerPoint Presentation Gallery Objects
This is a line chart ppt powerpoint presentation gallery objects. This is a two stage process. The stages in this process are product, business, marketing, growth, in years, in percentage.
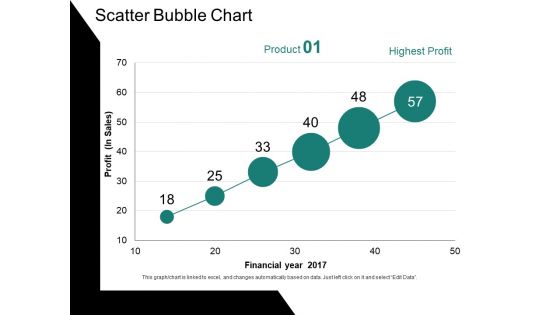
Scatter Bubble Chart Ppt PowerPoint Presentation Ideas Gallery
This is a scatter bubble chart ppt powerpoint presentation ideas gallery. This is a six stage process. The stages in this process are profit, financial year, chart, business, growth.

Combo Chart Ppt PowerPoint Presentation Show Elements
This is a combo chart ppt powerpoint presentation show elements. This is a three stage process. The stages in this process are in price, in years, business, marketing, growth.
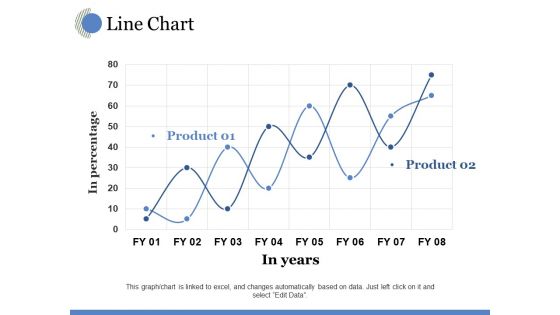
Line Chart Ppt PowerPoint Presentation Model Visual Aids
This is a line chart ppt powerpoint presentation model visual aids. This is a two stage process. The stages in this process are in years, in percentage, growth, business, marketing.
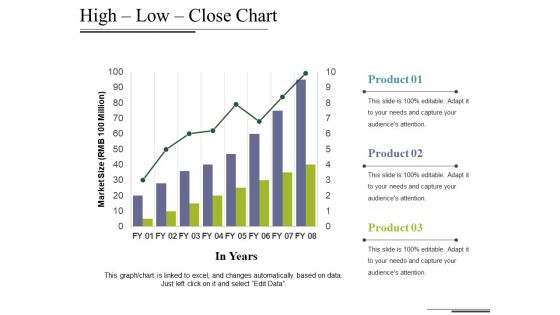
High Low Close Chart Ppt PowerPoint Presentation Styles Maker
This is a high low close chart ppt powerpoint presentation styles maker. This is a three stage process. The stages in this process are market size, in years, growth, business, marketing, graph.

Clustered Column Line Ppt PowerPoint Presentation Infographic Template Deck
This is a clustered column line ppt powerpoint presentation infographic template deck. This is a three stage process. The stages in this process are business, strategy, analysis, planning, sales in percentage, financial year.
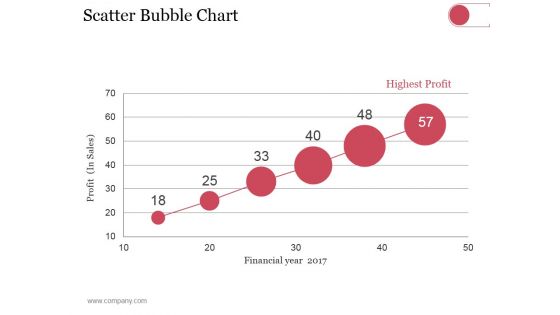
Scatter Bubble Chart Ppt PowerPoint Presentation Summary Pictures
This is a scatter bubble chart ppt powerpoint presentation summary pictures. This is a six stage process. The stages in this process are highest profit, financial year, profit in sales.
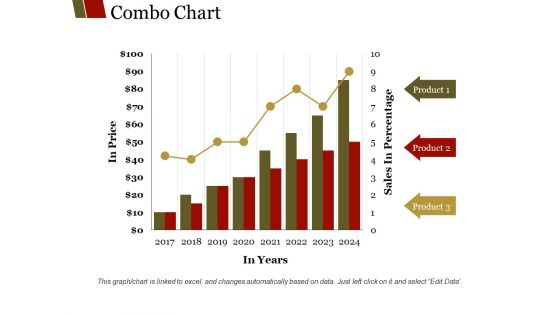
Combo Chart Ppt PowerPoint Presentation Summary Layouts
This is a combo chart ppt powerpoint presentation summary layouts. This is a eight stage process. The stages in this process are product, sales in percentage, in years, in price, graph.

Line Chart Template 2 Ppt PowerPoint Presentation Model Background Image
This is a line chart template 2 ppt powerpoint presentation model background image. This is a two stage process. The stages in this process are sales in percentage, financial years, business, marketing, strategy, graph.

Line Chart Ppt PowerPoint Presentation Infographic Template Slides
This is a line chart ppt powerpoint presentation infographic template slides. This is a two stage process. The stages in this process are sales in percentage, financial years, business, marketing, graph.

Line Chart Ppt PowerPoint Presentation Styles Themes
This is a line chart ppt powerpoint presentation styles themes. This is a two stage process. The stages in this process are business, marketing, financial years, sales in percentage.
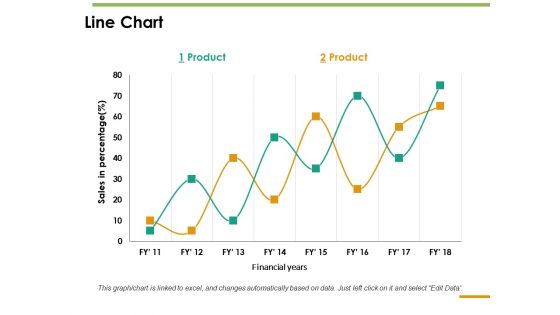
Line Chart Ppt PowerPoint Presentation Inspiration Guide
This is a line chart ppt powerpoint presentation inspiration guide. This is a two stage process. The stages in this process are line chart, sales in percentage, product, financial years.

Clustered Column Ppt PowerPoint Presentation File Designs Download
This is a clustered column ppt powerpoint presentation file designs download. This is a six stage process. The stages in this process are dollars in thousands, financial year, product.
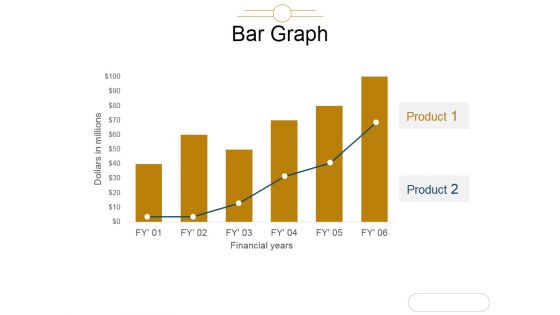
Bar Graph Ppt PowerPoint Presentation Model Graphic Tips
This is a bar graph ppt powerpoint presentation model graphic tips. This is a two stage process. The stages in this process are we are dollars in millions, financials years, bar graph, product, business.
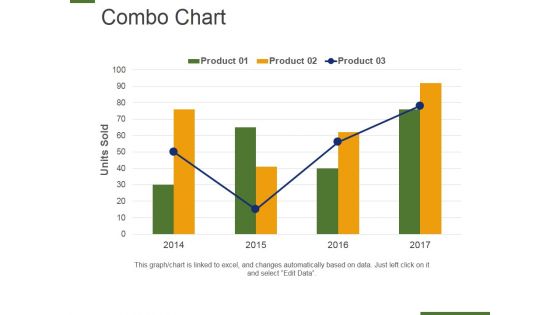
Combo Chart Ppt PowerPoint Presentation Summary Design Templates
This is a combo chart ppt powerpoint presentation summary design templates. This is a four stage process. The stages in this process are units sold, product, combo chart, years, planning.
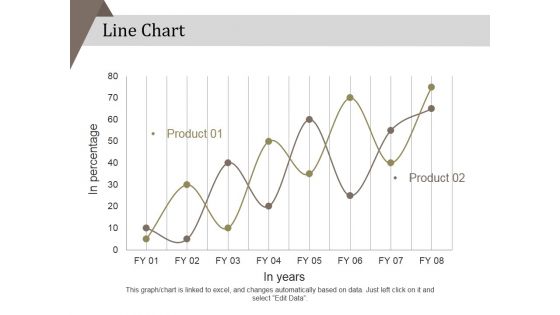
Line Chart Ppt PowerPoint Presentation Layouts Professional
This is a line chart ppt powerpoint presentation layouts professional. This is a two stage process. The stages in this process are in percentage, product, in years, strategy, marketing, business.
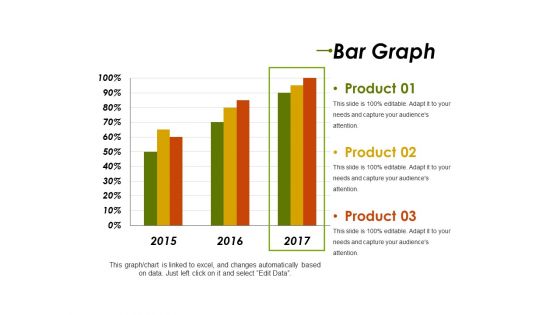
Bar Graph Template 1 Ppt PowerPoint Presentation Slides Format Ideas
This is a bar graph template 1 ppt powerpoint presentation slides format ideas. This is a three stage process. The stages in this process are product, years, bar graph, business, marketing.
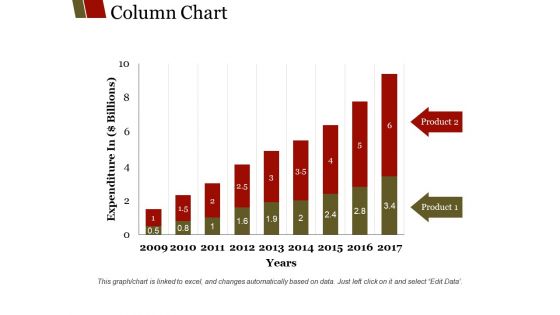
Column Chart Ppt PowerPoint Presentation Summary Graphics
This is a column chart ppt powerpoint presentation summary graphics. This is a nine stage process. The stages in this process are product, years, expenditure in billions, graph, business.
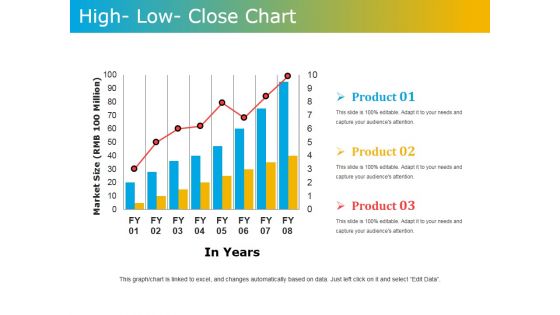
High Low Close Chart Ppt PowerPoint Presentation Model Graphics Tutorials
This is a high low close chart ppt powerpoint presentation model graphics tutorials. This is a three stage process. The stages in this process are market size, in years, product.
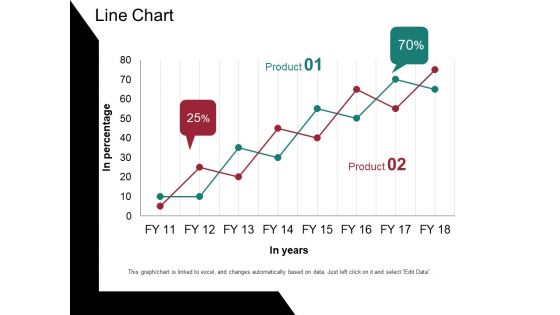
Line Chart Ppt PowerPoint Presentation Portfolio Design Templates
This is a line chart ppt powerpoint presentation portfolio design templates. This is a two stage process. The stages in this process are in percentage, in years, percentage, business, graph.
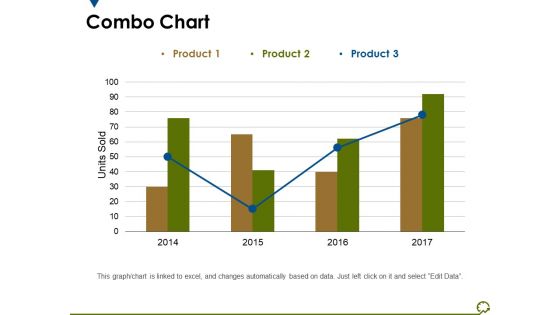
Combo Chart Ppt PowerPoint Presentation Outline Graphics Tutorials
This is a combo chart ppt powerpoint presentation outline graphics tutorials. This is a three stage process. The stages in this process are units sold, years, business, marketing, graph.

Line Chart Ppt PowerPoint Presentation Outline Diagrams
This is a line chart ppt powerpoint presentation outline diagrams. This is a two stage process. The stages in this process are in percentage, in years, percentage, business, marketing.
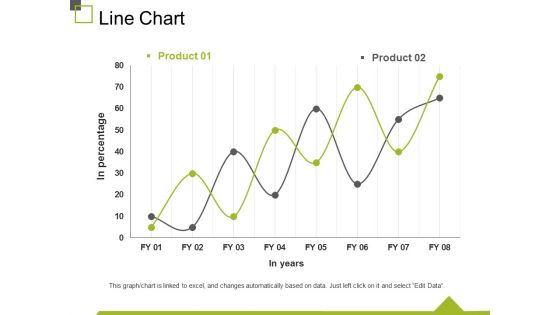
Line Chart Ppt PowerPoint Presentation Infographics Display
This is a line chart ppt powerpoint presentation infographics display. This is a two stage process. The stages in this process are in percentage, in years, chart, business, marketing.
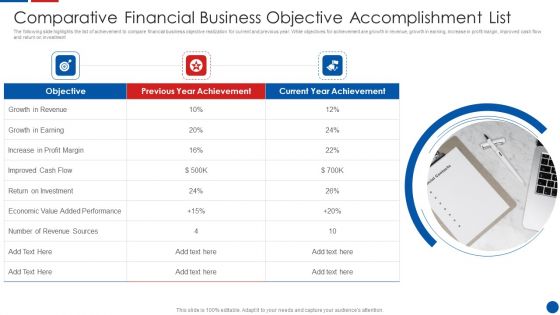
Comparative Financial Business Objective Accomplishment List Ppt PowerPoint Presentation Gallery Slides PDF
The following slide highlights the list of achievement to compare financial business objective realization for current and previous year. While objectives for achievement are growth in revenue, growth in earning, increase in profit margin, improved cash flow and return on investment. Presenting comparative financial business objective accomplishment list ppt powerpoint presentation gallery slides pdf to dispense important information. This template comprises three stages. It also presents valuable insights into the topics including objective, previous year achievement, current year achievement. This is a completely customizable PowerPoint theme that can be put to use immediately. So, download it and address the topic impactfully.
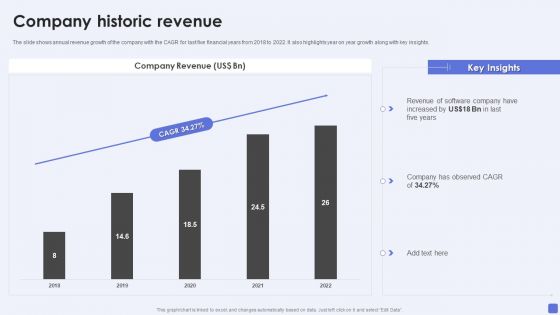
Software Services Business Profile Company Historic Revenue Ppt PowerPoint Presentation Gallery Graphics Download PDF
The slide shows annual revenue growth of the company with the CAGR for last five financial years from 2018 to 2022. It also highlights year on year growth along with key insights. Deliver and pitch your topic in the best possible manner with this Software Services Business Profile Company Historic Revenue Ppt PowerPoint Presentation Gallery Graphics Download PDF. Use them to share invaluable insights on Company Revenue, Observed CAGR, 2018 To 2022 and impress your audience. This template can be altered and modified as per your expectations. So, grab it now.
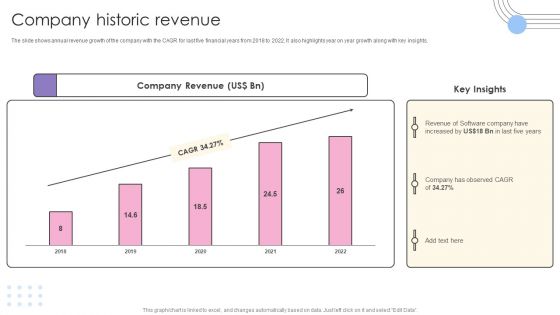
Software Products And Solutions Firm Details Company Historic Revenue Portrait PDF
The slide shows annual revenue growth of the company with the CAGR for last five financial years from 2018 to 2022. It also highlights year on year growth along with key insights. Deliver and pitch your topic in the best possible manner with this Software Products And Solutions Firm Details Company Historic Revenue Portrait PDF. Use them to share invaluable insights on Company Revenue, Observed CAGR, 2018 To 2022 and impress your audience. This template can be altered and modified as per your expectations. So, grab it now.
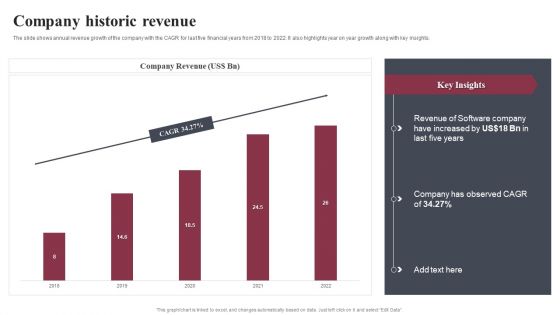
Business Software Development Company Profile Company Historic Revenue Graphics PDF
The slide shows annual revenue growth of the company with the CAGR for last five financial years from 2018 to 2022. It also highlights year on year growth along with key insights. Deliver and pitch your topic in the best possible manner with this Business Software Development Company Profile Company Historic Revenue Graphics PDF. Use them to share invaluable insights on Company Revenue, Observed CAGR, 2018 To 2022 and impress your audience. This template can be altered and modified as per your expectations. So, grab it now.
IT Application Services Company Outline Company Revenue Icons PDF
The slide shows annual revenue growth of the company with the CAGR for last five financial years from 2018 to 2022. It also highlights year on year growth along with key insights. Deliver and pitch your topic in the best possible manner with this IT Application Services Company Outline Company Revenue Icons PDF. Use them to share invaluable insights on Gross Profit Margin, Revenue, Business and impress your audience. This template can be altered and modified as per your expectations. So, grab it now.
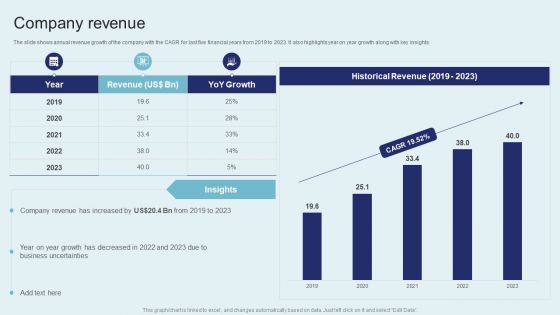
IT Firm Financial Statement Company Revenue Demonstration PDF
The slide shows annual revenue growth of the company with the CAGR for last five financial years from 2019 to 2023. It also highlights year on year growth along with key insights. Find a pre designed and impeccable IT Firm Financial Statement Company Revenue Demonstration PDF. The templates can ace your presentation without additional effort. You can download these easy to edit presentation templates to make your presentation stand out from others. So, what are you waiting for Download the template from Slidegeeks today and give a unique touch to your presentation.
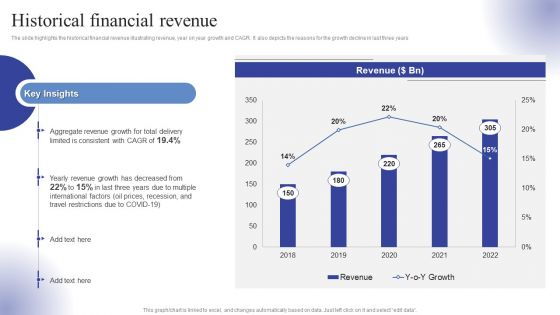
Logistics Transport Company Financial Report Historical Financial Revenue Ppt Outline Slides PDF
The slide highlights the historical financial revenue illustrating revenue, year on year growth and CAGR. It also depicts the reasons for the growth decline in last three years. Present like a pro with Logistics Transport Company Financial Report Historical Financial Revenue Ppt Outline Slides PDF Create beautiful presentations together with your team, using our easy-to-use presentation slides. Share your ideas in real-time and make changes on the fly by downloading our templates. So whether you are in the office, on the go, or in a remote location, you can stay in sync with your team and present your ideas with confidence. With Slidegeeks presentation got a whole lot easier. Grab these presentations today.
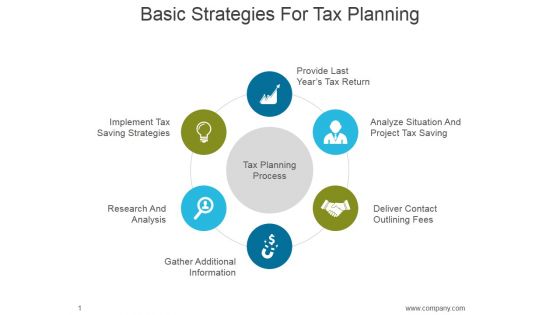
Basic Strategies For Tax Planning Ppt PowerPoint Presentation Deck
This is a basic strategies for tax planning ppt powerpoint presentation deck. This is a six stage process. The stages in this process are provide last years tax return, analyze situation and project tax saving, deliver contact outlining fees, gather additional information, research and analysis, implement tax saving strategies.

Revenue Streams Template 1 Ppt PowerPoint Presentation Inspiration Skills
This is a revenue streams template 1 ppt powerpoint presentation inspiration skills. This is a six stage process. The stages in this process are expected conversion rate to get a paid client, expected arpu, life time value of a customer, pricing, recurring revenue frequency, estimated yearly revenue.

Competitive Analysis Template 1 Ppt PowerPoint Presentation Clipart
This is a competitive analysis template 1 ppt powerpoint presentation clipart. This is a five stage process. The stages in this process are competitive factor, years of existence, location, products or service, business reputation.
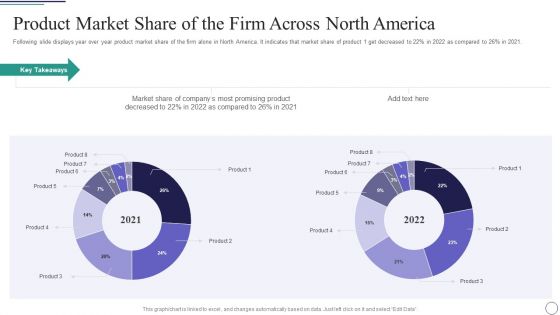
Successful Brand Development Plan Product Market Share Of The Firm Across North America Background PDF
Following slide displays year over year product market share of the firm alone in North America. It indicates that market share of product 1 get decreased to 22persent in 2022 as compared to 26persent in 2021.Deliver an awe inspiring pitch with this creative successful brand development plan product market share of the firm across north america background pdf bundle. Topics like product market share of the firm across north america can be discussed with this completely editable template. It is available for immediate download depending on the needs and requirements of the user.

Establishing Successful Brand Strategy To Captivate Consumers Product Market Share Of The Firm Across North America Topics PDF
Following slide displays year over year product market share of the firm alone in North America. It indicates that market share of product 1 get decreased to 22 percent in 2021 as compared to 26 percent in 2020. Deliver an awe inspiring pitch with this creative establishing successful brand strategy to captivate consumers product market share of the firm across north america topics pdf bundle. Topics like product market share of the firm across north america can be discussed with this completely editable template. It is available for immediate download depending on the needs and requirements of the user.

Byjus Investor Capital Financing Pitch Deck Awards Earned By Byjus Structure PDF
This slide provides information about the awards that are acquired by Byjus over past few years and in the current year 2021.This is a Byjus Investor Capital Financing Pitch Deck Awards Earned By Byjus Structure PDF template with various stages. Focus and dispense information on six stages using this creative set, that comes with editable features. It contains large content boxes to add your information on topics like Forbes Entrepreneur, Bloomberg Businessweeks, Emerging Markets You can also showcase facts, figures, and other relevant content using this PPT layout. Grab it now.

Decoding Netflix Strategies Drives OTT Market Dominance Timeline Showcasing Netflix History Themes PDF
This slide showcases timeline that highlights history, progress and achievements of Netflix company over the years. It highlights timeline from year 1997 to 2021 and shows information about Netflix content, service offerings, new launches etc. From laying roadmaps to briefing everything in detail, our templates are perfect for you. You can set the stage with your presentation slides. All you have to do is download these easy to edit and customizable templates. Decoding Netflix Strategies Drives OTT Market Dominance Timeline Showcasing Netflix History Themes PDF will help you deliver an outstanding performance that everyone would remember and praise you for. Do download this presentation today.
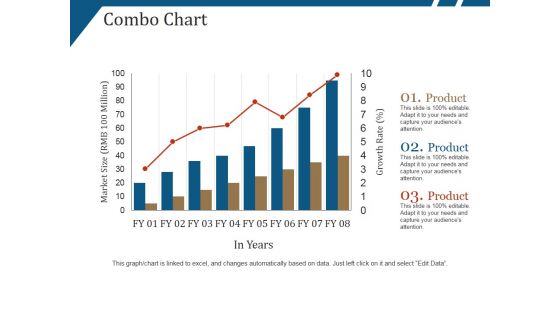
Combo Chart Ppt PowerPoint Presentation Summary Ideas
This is a combo chart ppt powerpoint presentation summary ideas. This is a eight stage process. The stages in this process are market size, growth rate, product, in years.

Combo Chart Ppt PowerPoint Presentation Design Ideas
This is a combo chart ppt powerpoint presentation design ideas. This is a eight stage process. The stages in this process are market size, combo chart, in years, product, growth rate.

Column Chart Ppt PowerPoint Presentation Infographics Model
This is a column chart ppt powerpoint presentation infographics model. This is a two stage process. The stages in this process are bar graph, growth, product, percentage, year.

 Home
Home