Percentage Charts

Area Stacked Ppt PowerPoint Presentation Infographics Shapes
This is a area stacked ppt powerpoint presentation infographics shapes. This is a two stage process. The stages in this process are product, area stacked, sales in percentage, financial year.

Pie Of Pie Ppt PowerPoint Presentation Visual Aids Backgrounds
This is a pie of pie ppt powerpoint presentation visual aids backgrounds. This is a two stage process. The stages in this process are pie, process, percentage, finance, business.

Stacked Area Clustered Column Ppt PowerPoint Presentation Infographics Portrait
This is a stacked area clustered column ppt powerpoint presentation infographics portrait. This is a three stage process. The stages in this process are percentage, product, business, management, marketing.
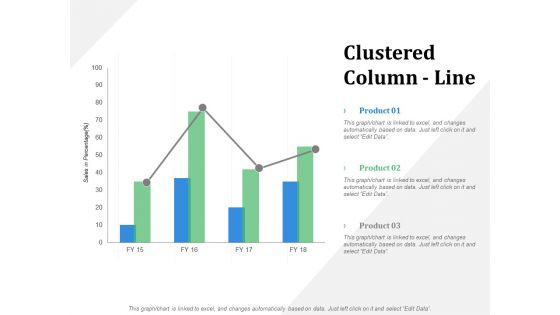
Clustered Column Line Financial Ppt PowerPoint Presentation Summary Slide
This is a clustered column line financial ppt powerpoint presentation summary slide. This is a three stage process. The stages in this process are business, management, marketing, product, percentage.
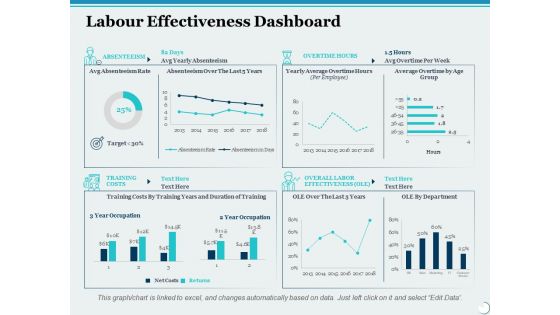
Labour Effectiveness Dashboard Ppt PowerPoint Presentation Slides File Formats
This is a labour effectiveness dashboard ppt powerpoint presentation slides file formats. This is a four stage process. The stages in this process are percentage, product, management, marketing, business.

Negative Impacts Of Workplace Stress Ppt PowerPoint Presentation Outline Slide Download
This is a negative impacts of workplace stress ppt powerpoint presentation outline slide download. This is a five stage process. The stages in this process are percentage, product, management, marketing, business.

Cost Performance Index Ppt PowerPoint Presentation Inspiration Graphics Example
This is a cost performance index ppt powerpoint presentation inspiration graphics example. This is a three stage process. The stages in this process are business, management, marketing, percentage, product.

Project Health Card Resourcing Ppt PowerPoint Presentation Summary Graphics Download
This is a project health card resourcing ppt powerpoint presentation summary graphics download. This is a six stage process. The stages in this process are business, management, marketing, percentage, product.
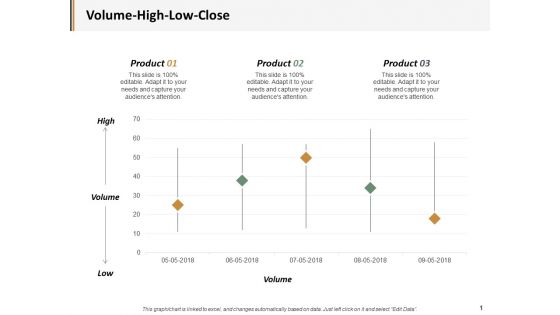
Volume High Low Close Ppt PowerPoint Presentation Ideas Example Introduction
This is a volume high low close ppt powerpoint presentation ideas example introduction. This is a three stage process. The stages in this process are business, management, marketing, percentage, product.
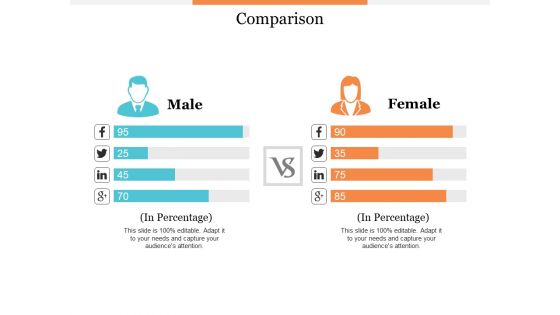
Comparison Male And Female Ppt PowerPoint Presentation Professional Skills
This is a comparison male and female ppt powerpoint presentation professional skills. This is a two stage process. The stages in this process are product, percentage, business, management, marketing.
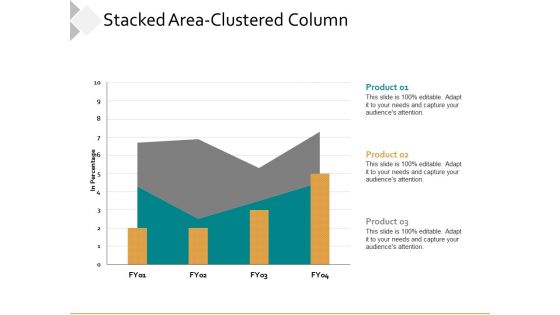
Stacked Area Clustered Column Ppt PowerPoint Presentation Model Slides
This is a stacked area clustered column ppt powerpoint presentation model slides. This is a three stage process. The stages in this process are business, management, percentage, product, marketing.

Cost Performance Index Ppt PowerPoint Presentation Infographics Mockup
This is a cost performance index ppt powerpoint presentation infographics mockup. This is a three stage process. The stages in this process are finance, marketing, management, investment, product, percentage.
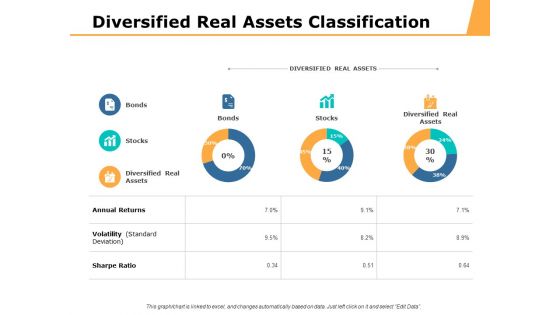
Diversified Real Assets Classification Ppt PowerPoint Presentation Ideas Tips
This is a diversified real assets classification ppt powerpoint presentation ideas tips. This is a three stage process. The stages in this process are percentage, product, business, management, marketing.
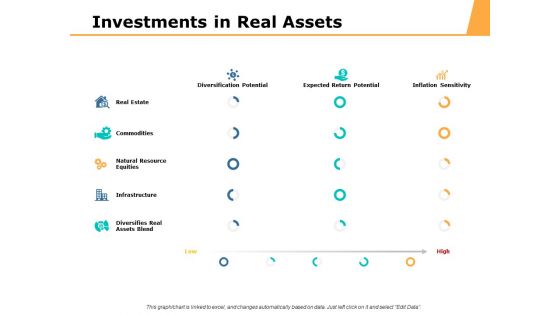
Investments In Real Assets Ppt PowerPoint Presentation Styles Pictures
This is a investments in real assets ppt powerpoint presentation styles pictures. This is a three stage process. The stages in this process are percentage, product, business, management, marketing.

Clustered Column Line Analysis Ppt PowerPoint Presentation Layouts Visual Aids
This is a clustered column line analysis ppt powerpoint presentation layouts visual aids. This is a three stage process. The stages in this process are percentage, product, business, management.

Determine The First Platform You Want To Build The App On Ios Or Android Ppt PowerPoint Presentation Pictures Master Slide
This is a determine the first platform you want to build the app on ios or android ppt powerpoint presentation pictures master slide. This is a two stage process. The stages in this process are business, management, marketing, percentage, product.
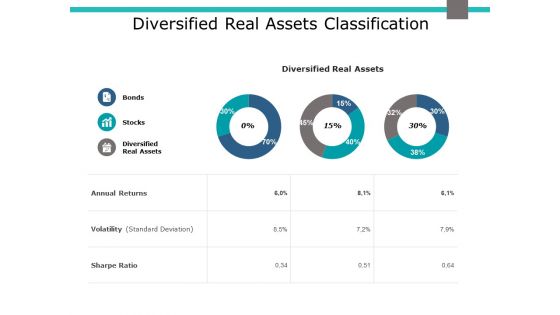
Diversified Real Assets Classification Ppt PowerPoint Presentation Slides Grid
This is a diversified real assets classification ppt powerpoint presentation slides grid. This is a three stage process. The stages in this process are business, management, marketing, percentage, product.

Information Technology Project Analysis With Kpi Dashboard Portrait PDF
The following slide highlights various key performance indicators to ensure successful information technology IT project completion. It also includes components such as risks, status, budget, deadlines, average task handle time, overdue activities etc. Pitch your topic with ease and precision using this Information Technology Project Analysis With Kpi Dashboard Portrait PDF. This layout presents information on Planning Completed, Design Completed, Development . It is also available for immediate download and adjustment. So, changes can be made in the color, design, graphics or any other component to create a unique layout.
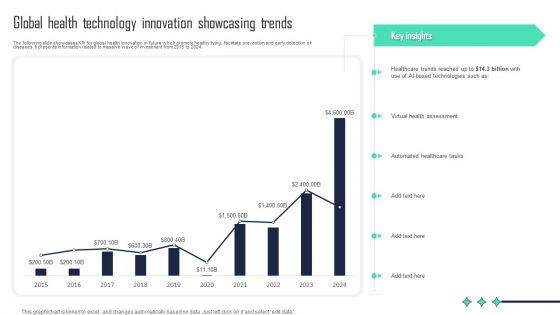
Global Health Technology Innovation Showcasing Trends Formats PDF
The following slide showcases KPI for global health innovation in future which promote healthy living, facilitate prevention and early detection of diseases. It presents information related to massive wave of investment from 2015 to 2024. Showcasing this set of slides titled Global Health Technology Innovation Showcasing Trends Formats PDF. The topics addressed in these templates are Virtual Health Assessment, Automated Healthcare Tasks, Key Insights. All the content presented in this PPT design is completely editable. Download it and make adjustments in color, background, font etc. as per your unique business setting.
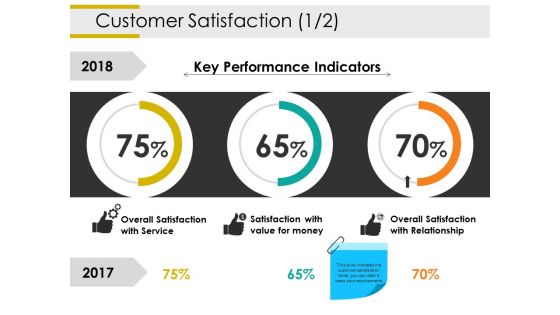
Customer Satisfaction Template 1 Ppt PowerPoint Presentation Portfolio Graphics Example
This is a customer satisfaction template 1 ppt powerpoint presentation portfolio graphics example. This is a three stage process. The stages in this process are overall satisfaction with service, satisfaction with value for money, overall satisfaction with relationship, key performance indicators, business, percentage.

Bar Graph Ppt PowerPoint Presentation Layouts Pictures
This is a bar graph ppt powerpoint presentation layouts pictures. This is a four stage process. The stages in this process are fire, earthquake, axis title, in percentage.

Our Market Template Ppt PowerPoint Presentation Design Templates
This is a our market template ppt powerpoint presentation design templates. This is a four stage process. The stages in this process are pie, percentage, finance, division, analysis.

Clustered Column Line Ppt PowerPoint Presentation Backgrounds
This is a clustered column line ppt powerpoint presentation backgrounds. This is a four stage process. The stages in this process are fire, earthquake, axis title, in percentage.
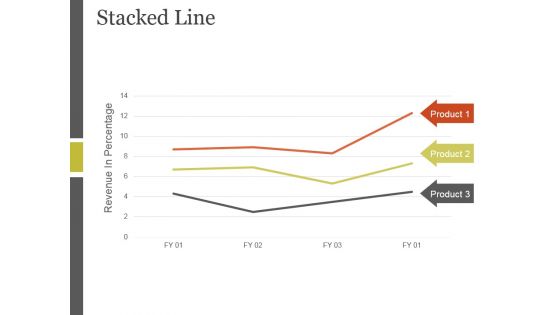
Stacked Line Ppt PowerPoint Presentation Inspiration
This is a stacked line ppt powerpoint presentation inspiration. This is a three stage process. The stages in this process are revenue in percentage, stacked line, product.
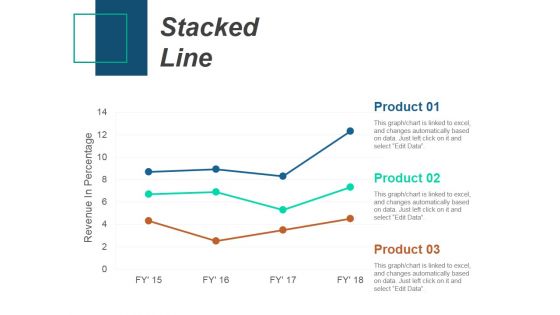
Stacked Line Ppt PowerPoint Presentation Infographics Slideshow
This is a stacked line ppt powerpoint presentation infographics slideshow. This is a three stage process. The stages in this process are stacked line, revenue in percentage, product.

Stacked Bar Template 2 Ppt PowerPoint Presentation Pictures
This is a stacked bar template 2 ppt powerpoint presentation pictures. This is a four stage process. The stages in this process are in percentage, product, stacked bar.
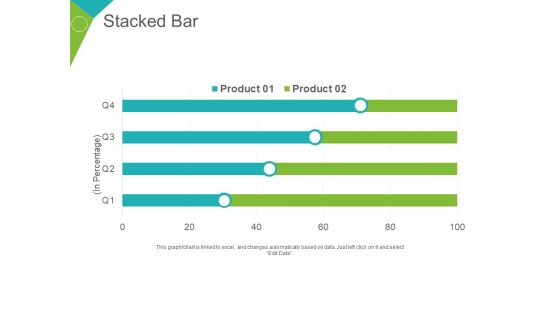
Stacked Bar Ppt PowerPoint Presentation Summary Portfolio
This is a stacked bar ppt powerpoint presentation summary portfolio. This is a two stage process. The stages in this process are product, business, planning, marketing, in percentage.
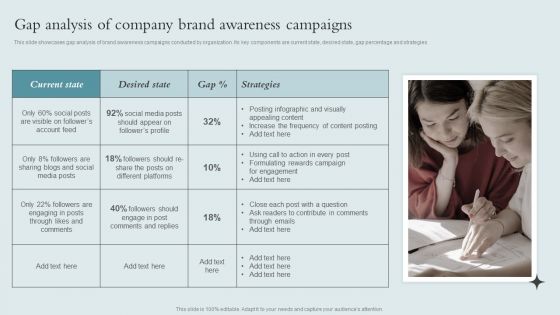
Brand Awareness Strategy Gap Analysis Of Company Brand Awareness Campaigns Rules PDF
This slide showcases gap analysis of brand awareness campaigns conducted by organization. Its key components are current state, desired state, gap percentage and strategies If you are looking for a format to display your unique thoughts, then the professionally designed Brand Awareness Strategy Gap Analysis Of Company Brand Awareness Campaigns Rules PDF is the one for you. You can use it as a Google Slides template or a PowerPoint template. Incorporate impressive visuals, symbols, images, and other charts. Modify or reorganize the text boxes as you desire. Experiment with shade schemes and font pairings. Alter, share or cooperate with other people on your work. Download Brand Awareness Strategy Gap Analysis Of Company Brand Awareness Campaigns Rules PDF and find out how to give a successful presentation. Present a perfect display to your team and make your presentation unforgettable.

Effective Revenue Generation Model For Digital Digital Marketing Business Designs Pdf
The slide shows the effective revenue model of the digital marketing agency industry, which displays the cost incurred and the various sources of income. The revenue is calculated based on the percentage of the population captured by the company from the year 2023 to the year 2027. If you are looking for a format to display your unique thoughts, then the professionally designed Effective Revenue Generation Model For Digital Digital Marketing Business Designs Pdf is the one for you. You can use it as a Google Slides template or a PowerPoint template. Incorporate impressive visuals, symbols, images, and other charts. Modify or reorganize the text boxes as you desire. Experiment with shade schemes and font pairings. Alter, share or cooperate with other people on your work. Download Effective Revenue Generation Model For Digital Digital Marketing Business Designs Pdf and find out how to give a successful presentation. Present a perfect display to your team and make your presentation unforgettable.
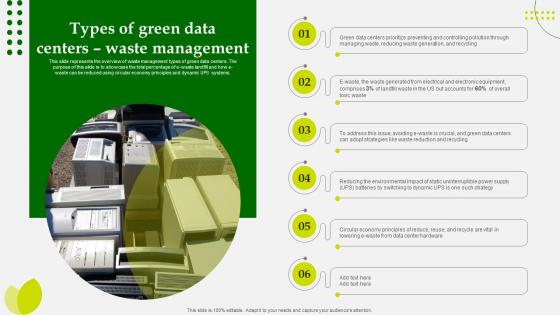
Green Computing Types Of Green Data Centers Waste Management
This slide represents the overview of waste management types of green data centers. The purpose of this slide is to showcase the total percentage of e-waste landfill and how e-waste can be reduced using circular economy principles and dynamic UPS systems. If you are looking for a format to display your unique thoughts, then the professionally designed Green Computing Types Of Green Data Centers Waste Management is the one for you. You can use it as a Google Slides template or a PowerPoint template. Incorporate impressive visuals, symbols, images, and other charts. Modify or reorganize the text boxes as you desire. Experiment with shade schemes and font pairings. Alter, share or cooperate with other people on your work. Download Green Computing Types Of Green Data Centers Waste Management and find out how to give a successful presentation. Present a perfect display to your team and make your presentation unforgettable.
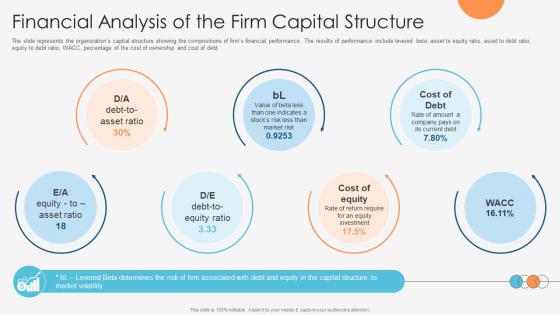
Enhancing Profitability Modelling Financial Analysis Of The Firm Capital Structure
The slide represents the organizations capital structure showing the compositions of firms financial performance. The results of performance include levered beta, asset to equity ratio, asset to debt ratio, equity to debt ratio, WACC, percentage of the cost of ownership and cost of debt. If you are looking for a format to display your unique thoughts, then the professionally designed Enhancing Profitability Modelling Financial Analysis Of The Firm Capital Structure is the one for you. You can use it as a Google Slides template or a PowerPoint template. Incorporate impressive visuals, symbols, images, and other charts. Modify or reorganize the text boxes as you desire. Experiment with shade schemes and font pairings. Alter, share or cooperate with other people on your work. Download Enhancing Profitability Modelling Financial Analysis Of The Firm Capital Structure and find out how to give a successful presentation. Present a perfect display to your team and make your presentation unforgettable.
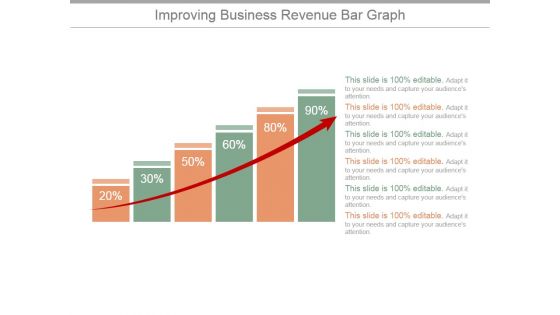
Improving Business Revenue Bar Graph Ppt PowerPoint Presentation Infographic Template
This is a improving business revenue bar graph ppt powerpoint presentation infographic template. This is a six stage process. The stages in this process are graph, arrow, finance, percentage, success.
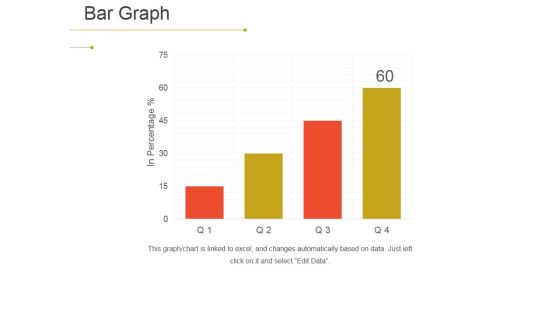
Bar Graph Ppt PowerPoint Presentation File Vector
This is a bar graph ppt powerpoint presentation file vector. This is a four stage process. The stages in this process are in percentage, bar graph, growth, business, process.
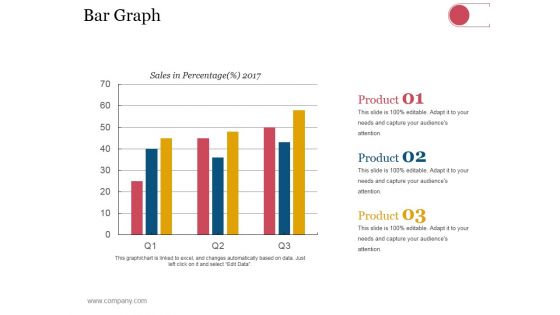
Bar Graph Ppt PowerPoint Presentation Visual Aids Model
This is a bar graph ppt powerpoint presentation visual aids model. This is a three stage process. The stages in this process are business, strategy, analysis, planning, sales in percentage.
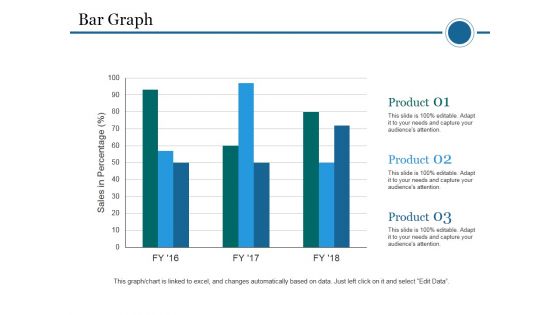
Bar Graph Ppt PowerPoint Presentation Infographic Template Template
This is a bar graph ppt powerpoint presentation infographic template template. This is a three stage process. The stages in this process are bar graph, sales in percentage, product, planning, business.
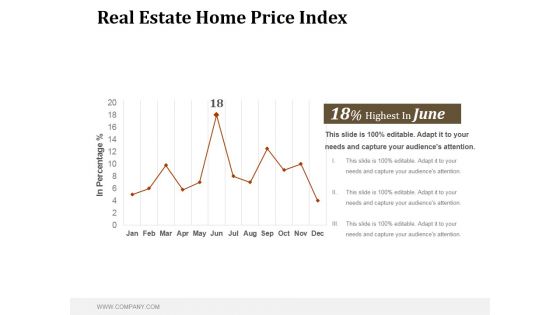
Real Estate Home Price Index Ppt PowerPoint Presentation Samples
This is a real estate home price index ppt powerpoint presentation samples. This is a one stage process. The stages in this process are in percentage, business, bar graph, marketing, success, management.

Bar Graph Ppt PowerPoint Presentation Gallery Skills
This is a bar graph ppt powerpoint presentation gallery skills. This is a four stage process. The stages in this process are in percentage, bar graph, business, marketing, product.
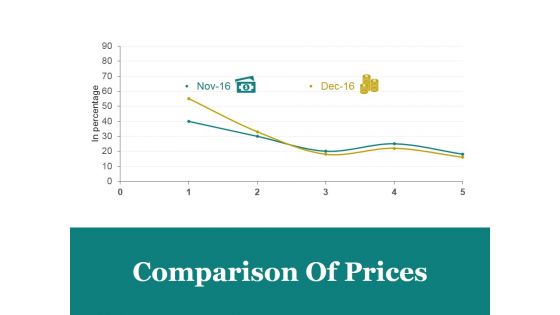
Comparison Of Prices Ppt PowerPoint Presentation Designs Download
This is a comparison of prices ppt powerpoint presentation designs download. This is a two stage process. The stages in this process are comparison of prices, marketing, in percentage, bar graph, business.
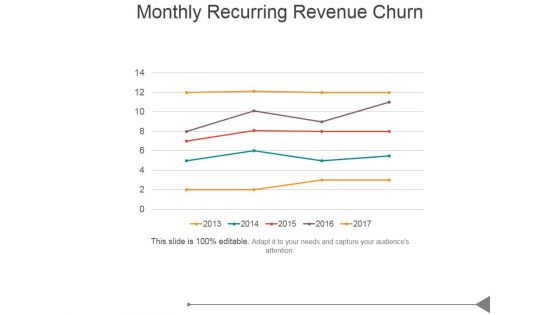
Monthly Recurring Revenue Churn Template 1 Ppt PowerPoint Presentation Clipart
This is a monthly recurring revenue churn template 1 ppt powerpoint presentation clipart. This is a one stage process. The stages in this process are business, marketing, success, in percentage, growth.

Stacked Area Clustered Column Ppt PowerPoint Presentation Clipart
This is a stacked area clustered column ppt powerpoint presentation clipart. This is a four stage process. The stages in this process are in percentage, stacked area clustered column, product.
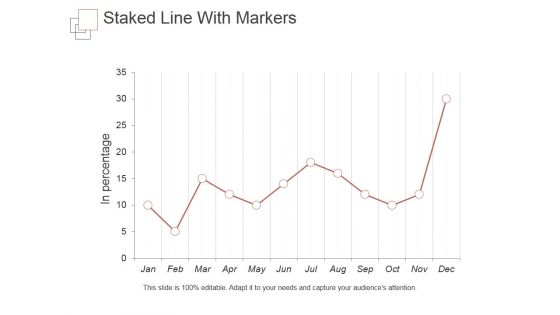
Staked Line With Markers Ppt PowerPoint Presentation Introduction
This is a staked line with markers ppt powerpoint presentation introduction. This is a one stage process. The stages in this process are in percentage, business, marketing, success, management.
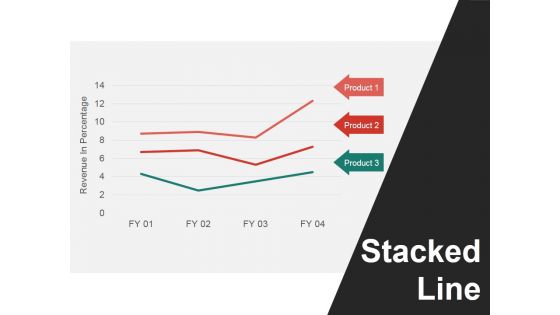
Stacked Line Ppt PowerPoint Presentation Summary Master Slide
This is a stacked line ppt powerpoint presentation summary master slide. This is a three stage process. The stages in this process are revenue in percentage, stacked line, product.
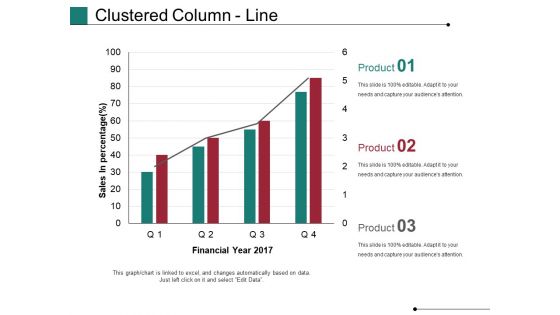
Clustered Column Line Ppt PowerPoint Presentation Model Rules
This is a clustered column line ppt powerpoint presentation model rules. This is a four stage process. The stages in this process are financial year, sales in percentage, business, marketing, growth, graph.

Stacked Line Ppt PowerPoint Presentation File Display
This is a stacked line ppt powerpoint presentation file display. This is a three stage process. The stages in this process are business, strategy, marketing, analysis, revenue in percentage, stacked line.
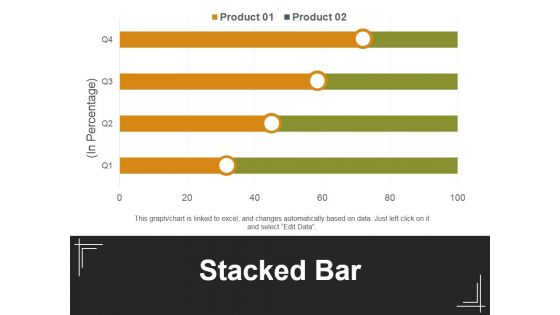
Stacked Bar Template 1 Ppt PowerPoint Presentation Inspiration Background Designs
This is a stacked bar template 1 ppt powerpoint presentation inspiration background designs. This is a four stage process. The stages in this process are in percentage, stacked bar, product, business, marketing.
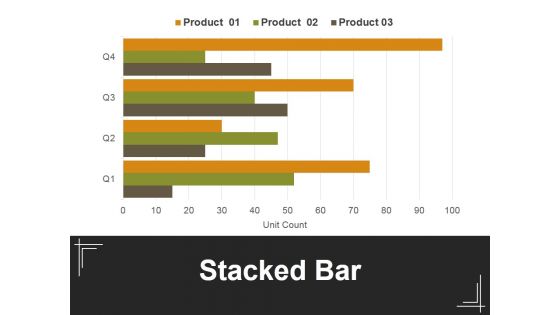
Stacked Bar Template 2 Ppt PowerPoint Presentation Professional Example
This is a stacked bar template 2 ppt powerpoint presentation professional example. This is a four stage process. The stages in this process are in percentage, stacked bar, product, business, marketing.

Scatter With Smooth Lines And Markers Ppt PowerPoint Presentation Outline Inspiration
This is a scatter with smooth lines and markers ppt powerpoint presentation outline inspiration. This is a two stage process. The stages in this process are product, percentage, finance, growth, line graph.

Youtube Analytics Ppt PowerPoint Presentation Layouts Graphic Images
This is a youtube analytics ppt powerpoint presentation layouts graphic images. This is a three stage process. The stages in this process are youtube analytics, finance, percentage, bar graph.
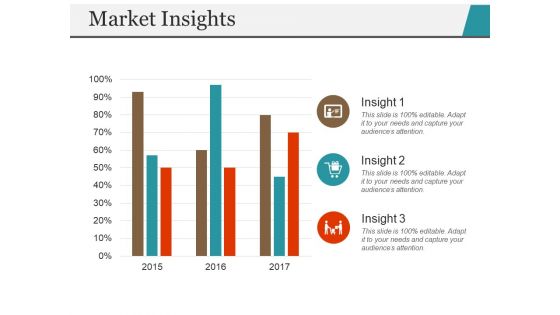
Market Insights Template 1 Ppt PowerPoint Presentation Ideas Topics
This is a market insights template 1 ppt powerpoint presentation ideas topics. This is a three stage process. The stages in this process are insight, finance, percentage, business, marketing, graph.

Sales Revenue Product Ppt PowerPoint Presentation Styles Skills
This is a sales revenue product ppt powerpoint presentation styles skills. This is a three stage process. The stages in this process are productwise revenue, income product, business, percentage, strategy.
Creating Referral Program For Increasing Viral Video Outreach Plan Graphics Pdf
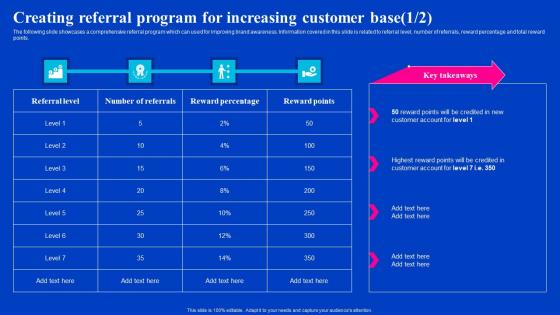
The following slide showcases a comprehensive referral program which can used for improving brand awareness. Information covered in this slide is related to referral level, number of referrals, reward percentage and total reward points.Welcome to our selection of the Creating Referral Program For Increasing Viral Video Outreach Plan Graphics Pdf. These are designed to help you showcase your creativity and bring your sphere to life. Planning and Innovation are essential for any business that is just starting out. This collection contains the designs that you need for your everyday presentations. All of our PowerPoints are 100Precent editable, so you can customize them to suit your needs. This multi-purpose template can be used in various situations. Grab these presentation templates today.

Coinbase Fee Schedule For Advanced Trades Complete Roadmap To Blockchain BCT SS V
This slide covers percentage charges related to trading volume based on taker and marker fee for cryptocurrencies. It includes charges related to different ranges for advanced crypto trades. Present like a pro with Coinbase Fee Schedule For Advanced Trades Complete Roadmap To Blockchain BCT SS V. Create beautiful presentations together with your team, using our easy-to-use presentation slides. Share your ideas in real-time and make changes on the fly by downloading our templates. So whether you are in the office, on the go, or in a remote location, you can stay in sync with your team and present your ideas with confidence. With Slidegeeks presentation got a whole lot easier. Grab these presentations today.
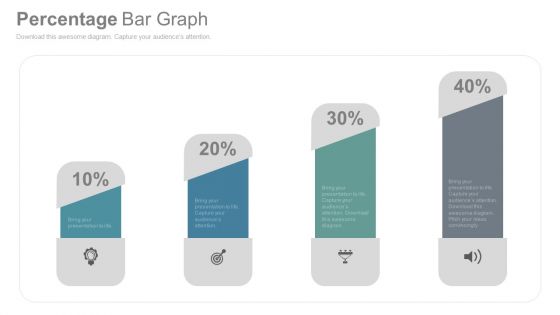
Bar Graph To Compare Business Data PowerPoint Slides
This is the slide which can solve many purposes of yours. Be it growth in your company, need to show your company?s status in the market as compared to others, or how your business has improved so far. An ideal PowerPoint template to display all of these. You can easily use this graph to show the growth of your company using the percentage icons. You can use this visual to show the status of your company in the market in comparison with others. You can edit the icons and replace them with the logo of your company and the others. You can also show it to your colleagues how your company has built its image in the market or how it has improved over the time. A perfect bar graph image which needs to be included in your business PPT presentations.

Creating Referral Program For Increasing Customer Base Designing Approaches Rules Pdf
The following slide showcases a comprehensive referral program which can used for improving brand awareness. Information covered in this slide is related to referral level, number of referrals, reward percentage and total reward points. Present like a pro with Creating Referral Program For Increasing Customer Base Designing Approaches Rules Pdf Create beautiful presentations together with your team, using our easy-to-use presentation slides. Share your ideas in real-time and make changes on the fly by downloading our templates. So whether you are in the office, on the go, or in a remote location, you can stay in sync with your team and present your ideas with confidence. With Slidegeeks presentation got a whole lot easier. Grab these presentations today.

Creating Referral Program For Increasing Customer Base Organizing Buzzworthy Social Ideas Pdf
The following slide showcases a comprehensive referral program which can used for improving brand awareness. Information covered in this slide is related to referral level, number of referrals, reward percentage and total reward points. Get a simple yet stunning designed Creating Referral Program For Increasing Customer Base Organizing Buzzworthy Social Ideas Pdf It is the best one to establish the tone in your meetings. It is an excellent way to make your presentations highly effective. So, download this PPT today from Slidegeeks and see the positive impacts. Our easy-to-edit Creating Referral Program For Increasing Customer Base Organizing Buzzworthy Social Ideas Pdf can be your go-to option for all upcoming conferences and meetings. So, what are you waiting for Grab this template today.

Strategic Guide To Attract Creating Referral Program For Increasing Customer Base Microsoft Pdf
The following slide showcases a comprehensive referral program which can used for improving brand awareness. Information covered in this slide is related to referral level, number of referrals, reward percentage and total reward points. Slidegeeks is here to make your presentations a breeze with Strategic Guide To Attract Creating Referral Program For Increasing Customer Base Microsoft Pdf With our easy-to-use and customizable templates, you can focus on delivering your ideas rather than worrying about formatting. With a variety of designs to choose from, you are sure to find one that suits your needs. And with animations and unique photos, illustrations, and fonts, you can make your presentation pop. So whether you are giving a sales pitch or presenting to the board, make sure to check out Slidegeeks first.

Star Diagram With Five Solutions PowerPoint Slides
Rating is an integral part of corporate industry. We have made it easier for you. You can use this PowerPoint slide for multiple purposes. It can be used to rate the performance of a particular employee or a department in a very professional manner. It can be very useful to easily explain the 5 steps required for the completion of a project or to reach a target. It can be used to highlight or bring special attention to a particular point. One can creatively use this slide to show different solutions to a single problem to show the different options available for the audience. The star can also be used to show the percentage of sales target achieved in a stipulated time.
Business Persons 3d Man Circular Pie Hovering Between Hands PowerPoint Templates
We present our business persons 3d man circular pie hovering between hands PowerPoint templates.Present our People PowerPoint Templates because Our PowerPoint Templates and Slides have the Brilliant backdrops. Guaranteed to illuminate the minds of your audience. Present our Business PowerPoint Templates because Our PowerPoint Templates and Slides offer you the widest possible range of options. Use our Pie charts PowerPoint Templates because Our PowerPoint Templates and Slides has conjured up a web of all you need with the help of our great team. Use them to string together your glistening ideas. Download and present our Marketing PowerPoint Templates because You have gained great respect for your brilliant ideas. Use our PowerPoint Templates and Slides to strengthen and enhance your reputation. Use our Success PowerPoint Templates because You have a driving passion to excel in your field. Our PowerPoint Templates and Slides will prove ideal vehicles for your ideas.Use these PowerPoint slides for presentations relating to 3d, account, accounting, analysis, blue, business, chart, colorful,company, concept, conference, corporate, data, diagram, earnings, economic,economy, enterprise, finance, financial, forecast, graph, graphic, growth,illustration, information, investment, management, market, marketing, meeting,money, office, percentage, performance, pie, plan, presentation, profit, progress,render, report, research, results, sales, slice, statistics, success. The prominent colors used in the PowerPoint template are White, Blue, Green. Professionals tell us our business persons 3d man circular pie hovering between hands PowerPoint templates effectively help you save your valuable time. People tell us our blue PowerPoint templates and PPT Slides are effectively colour coded to prioritise your plans They automatically highlight the sequence of events you desire. We assure you our business persons 3d man circular pie hovering between hands PowerPoint templates have awesome images to get your point across. Presenters tell us our analysis PowerPoint templates and PPT Slides are specially created by a professional team with vast experience. They diligently strive to come up with the right vehicle for your brilliant Ideas. We assure you our business persons 3d man circular pie hovering between hands PowerPoint templates will make the presenter look like a pro even if they are not computer savvy. PowerPoint presentation experts tell us our business PowerPoint templates and PPT Slides are second to none.
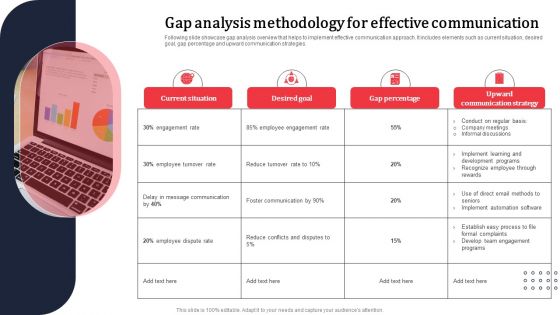
Gap Analysis Methodology For Effective Communication Ppt PowerPoint Presentation Diagram Lists PDF
Following slide showcase gap analysis overview that helps to implement effective communication approach. It includes elements such as current situation, desired goal, gap percentage and upward communication strategies. Find highly impressive Gap Analysis Methodology For Effective Communication Ppt PowerPoint Presentation Diagram Lists PDF on Slidegeeks to deliver a meaningful presentation. You can save an ample amount of time using these presentation templates. No need to worry to prepare everything from scratch because Slidegeeks experts have already done a huge research and work for you. You need to download Gap Analysis Methodology For Effective Communication Ppt PowerPoint Presentation Diagram Lists PDF for your upcoming presentation. All the presentation templates are 100 percent editable and you can change the color and personalize the content accordingly. Download now.
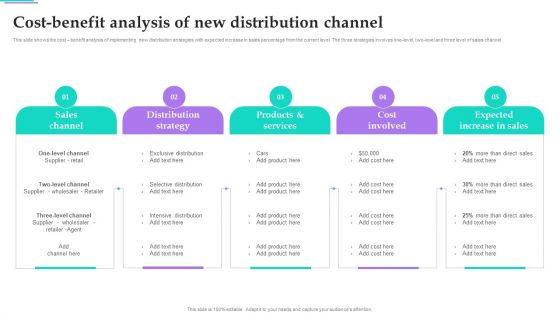
Distribution Strategies For Increasing Cost Benefit Analysis Of New Distribution Channel Download PDF
This slide shows the cost benefit analysis of implementing new distribution strategies with expected increase in sales percentage from the current level. The three strategies involves one-level, two-level and three level of sales channel. Whether you have daily or monthly meetings, a brilliant presentation is necessary. Distribution Strategies For Increasing Cost Benefit Analysis Of New Distribution Channel Download PDF can be your best option for delivering a presentation. Represent everything in detail using Distribution Strategies For Increasing Cost Benefit Analysis Of New Distribution Channel Download PDF and make yourself stand out in meetings. The template is versatile and follows a structure that will cater to your requirements. All the templates prepared by Slidegeeks are easy to download and edit. Our research experts have taken care of the corporate themes as well. So, give it a try and see the results.

 Home
Home