Percentage Infographic
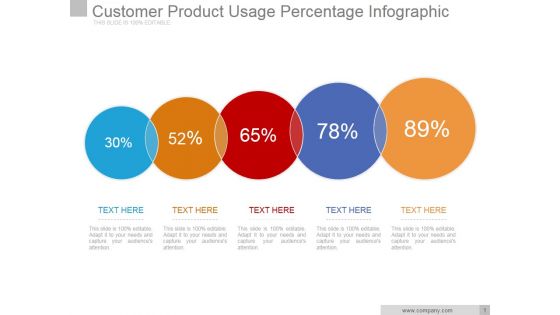
Customer Product Usage Percentage Infographic Ppt PowerPoint Presentation Clipart
This is a customer product usage percentage infographic ppt powerpoint presentation clipart. This is a five stage process. The stages in this process are business, marketing, finance, planning, strategy.
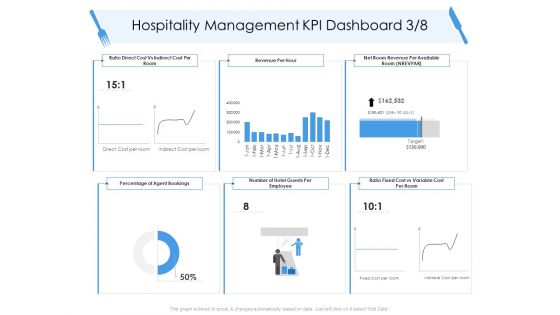
Tourism And Hospitality Industry Hospitality Management KPI Dashboard Percentage Infographics PDF
Deliver an awe inspiring pitch with this creative tourism and hospitality industry hospitality management kpi dashboard percentage infographics pdf bundle. Topics like revenue, agent, employee, fixedcost, variable cost can be discussed with this completely editable template. It is available for immediate download depending on the needs and requirements of the user.
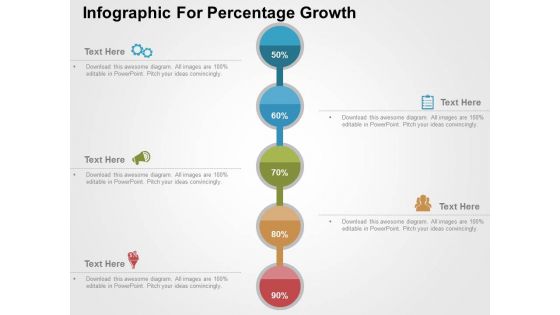
Infographic For Percentage Growth Powerpoint Templates
Create dynamic presentations with our professional template of infographic. This diagram helps to present percentage profit growth. Download this template to leave permanent impression on your audience.

Pie Chart Infographic With Percentage Share Ppt Infographic Template Inspiration PDF
Presenting pie chart infographic with percentage share ppt infographic template inspiration pdf. to dispense important information. This template comprises three stages. It also presents valuable insights into the topics including pie chart infographic with percentage share. This is a completely customizable PowerPoint theme that can be put to use immediately. So, download it and address the topic impactfully.
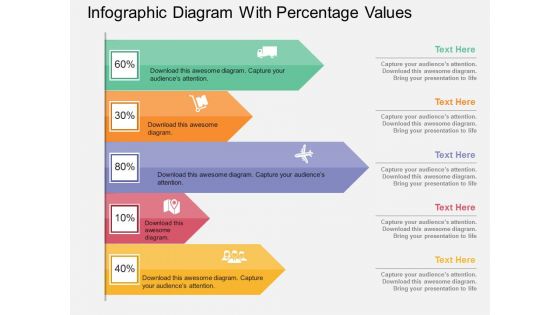
Infographic Diagram With Percentage Values Powerpoint Template
Visually support your presentation with our above template containing infographic diagram with percentage values. This diagram is excellent visual tools for explaining huge amounts of information where complex data needs to be explained immediately and clearly.
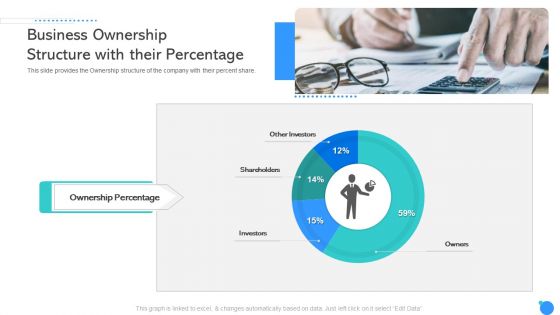
Business Ownership Structure With Their Percentage Ppt Infographics Graphics Pictures PDF
This slide provides the Ownership structure of the company with their percent share. Deliver an awe inspiring pitch with this creative business ownership structure with their percentage ppt infographics graphics pictures pdf bundle. Topics like business ownership structure with their percentage can be discussed with this completely editable template. It is available for immediate download depending on the needs and requirements of the user.
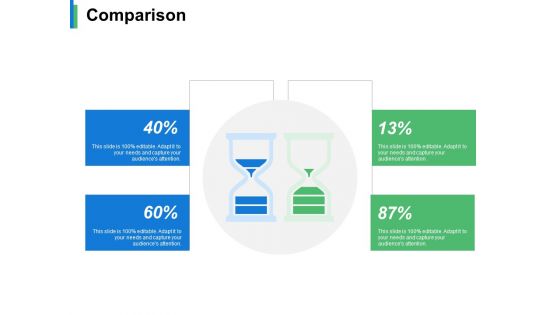
Comparison Percentage Ppt PowerPoint Presentation Infographic Template Slides
This is a comparison percentage ppt powerpoint presentation infographic template slides. This is a two stage process. The stages in this process are business, management, comparison, strategy, analysis.

Comparison Business Percentage Ppt PowerPoint Presentation Infographic Template Elements
This is a comparison business percentage ppt powerpoint presentation infographic template elements. This is a three stage process. The stages in this process are compare, management, strategy, analysis, marketing.
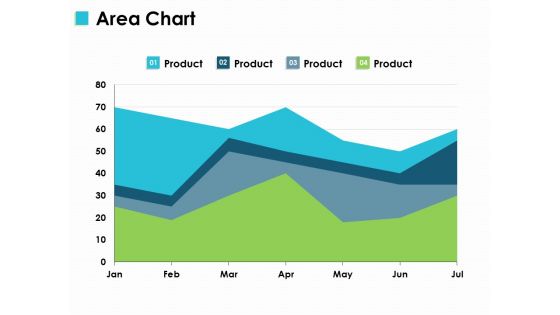
Area Chart Product Percentage Ppt PowerPoint Presentation Infographic Template Slide
This is a area chart product percentage ppt powerpoint presentation infographic template slide. This is a four stage process. The stages in this process are area chart, finance, marketing, management, investment.
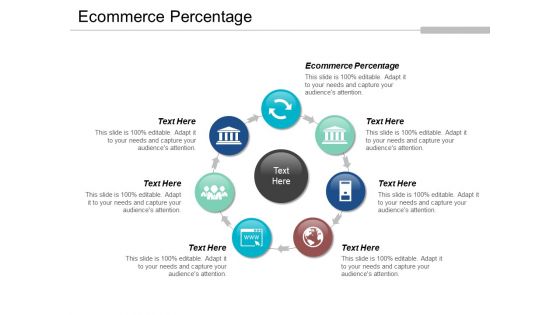
Ecommerce Percentage Ppt PowerPoint Presentation Infographic Template Model Cpb
Presenting this set of slides with name ecommerce percentage ppt powerpoint presentation infographic template model cpb. This is a seven stage process. The stages in this process are ecommerce percentage. This is a completely editable PowerPoint presentation and is available for immediate download. Download now and impress your audience.

Clustered Column Line Percentage Ppt PowerPoint Presentation Infographics Visual Aids
This is a clustered column line percentage ppt powerpoint presentation infographics visual aids. This is a three stage process. The stages in this process are.
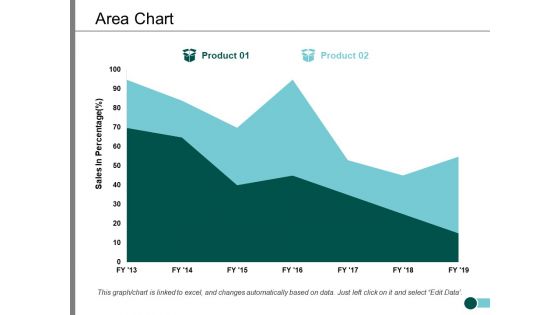
Area Chart Percentage Product Ppt PowerPoint Presentation Infographic Template Slide
This is a area chart percentage product ppt powerpoint presentation infographic template slide. This is a two stage process. The stages in this process are area chart, finance, marketing, management, investment.
Personality Traits Percentage Scale Ppt PowerPoint Presentation Infographics Icon
This is a personality traits percentage scale ppt powerpoint presentation infographics icon. This is a six stage process. The stages in this process are circular, continuity, continuum.
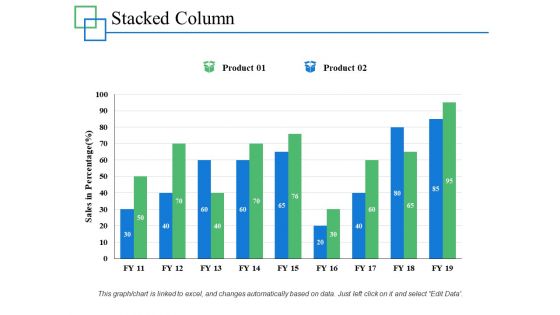
Stacked Column Percentage Product Ppt PowerPoint Presentation Infographics Outfit
This is a stacked column percentage product ppt powerpoint presentation infographics outfit. This is a two stage process. The stages in this process are marketing, business, management, percentage, product.

Customer Analysis Percentage Chart Ppt PowerPoint Presentation Infographics Master Slide
This is a customer analysis percentage chart ppt powerpoint presentation infographics master slide. This is a four stage process. The stages in this process are comparison chart, comparison table, comparison matrix.

Percentage Outcome Of Customer Satisfaction Survey Infographics PDF
The following slide presents percentage results of customer satisfaction survey to understand user perception related to product or service. It includes key questions like goals achievements with product, time of using product and user role. Pitch your topic with ease and precision using this Percentage Outcome Of Customer Satisfaction Survey Infographics PDF. This layout presents information on Percentage Outcome, Customer Satisfaction Survey. It is also available for immediate download and adjustment. So, changes can be made in the color, design, graphics or any other component to create a unique layout.

Donut Chart Infographic For Percentage Ratio Analysis Ppt PowerPoint Presentation File Graphics Example PDF
Persuade your audience using this donut chart infographic for percentage ratio analysis ppt powerpoint presentation file graphics example pdf. This PPT design covers four stages, thus making it a great tool to use. It also caters to a variety of topics including donut chart infographic for percentage ratio analysis. Download this PPT design now to present a convincing pitch that not only emphasizes the topic but also showcases your presentation skills.
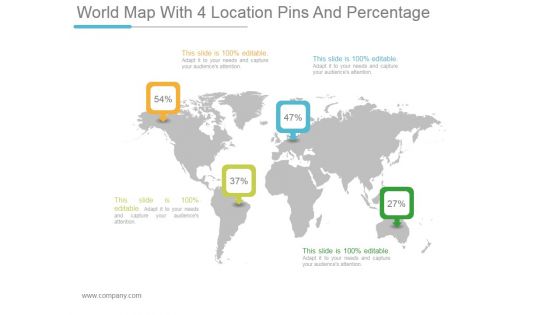
World Map With 4 Location Pins And Percentage Ppt PowerPoint Presentation Infographics
This is a world map with 4 location pins and percentage ppt powerpoint presentation infographics. This is a four stage process. The stages in this process are business, marketing, success, planning, map.
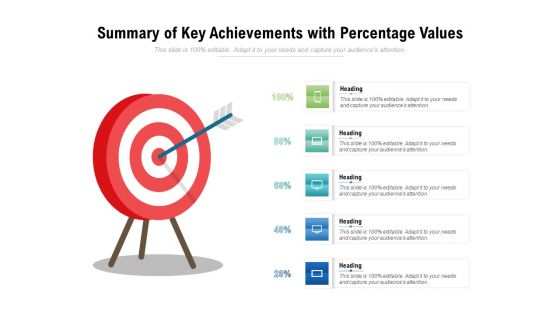
Summary Of Key Achievements With Percentage Values Ppt PowerPoint Presentation Infographics Graphics Design
Presenting this set of slides with name summary of key achievements with percentage values ppt powerpoint presentation infographics graphics design. This is a five stage process. The stages in this process are summary of key achievements with percentage values. This is a completely editable PowerPoint presentation and is available for immediate download. Download now and impress your audience.
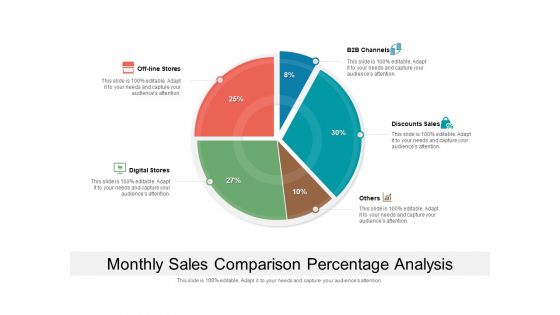
Monthly Sales Comparison Percentage Analysis Ppt PowerPoint Presentation File Infographic Template PDF
Pitch your topic with ease and precision using this monthly sales comparison percentage analysis ppt powerpoint presentation file infographic template pdf. This layout presents information on monthly sales comparison percentage analysis. It is also available for immediate download and adjustment. So, changes can be made in the color, design, graphics or any other component to create a unique layout.
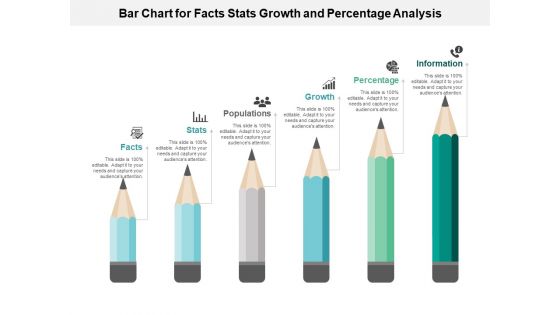
Bar Chart For Facts Stats Growth And Percentage Analysis Ppt PowerPoint Presentation Styles Infographic Template
Presenting this set of slides with name bar chart for facts stats growth and percentage analysis ppt powerpoint presentation styles infographic template. This is a six stage process. The stages in this process are education, growth, pencil bar graph. This is a completely editable PowerPoint presentation and is available for immediate download. Download now and impress your audience.
Hands Showing Percentage Vector Icon Ppt PowerPoint Presentation Portfolio Infographic Template PDF
Presenting this set of slides with name hands showing percentage vector icon ppt powerpoint presentation portfolio infographic template pdf. This is a three stage process. The stages in this process are hands showing percentage vector icon. This is a completely editable PowerPoint presentation and is available for immediate download. Download now and impress your audience.
Business Percentage Shown On Monitor Vector Icon Ppt PowerPoint Presentation Infographic Template Slide PDF
Presenting this set of slides with name business percentage shown on monitor vector icon ppt powerpoint presentation infographic template slide pdf. This is a three stage process. The stages in this process are business percentage shown on monitor vector icon. This is a completely editable PowerPoint presentation and is available for immediate download. Download now and impress your audience.
Seven Percentage Bars With Business Icons Ppt PowerPoint Presentation Infographics Example Topics
Presenting this set of slides with name seven percentage bars with business icons ppt powerpoint presentation infographics example topics. This is a seven stage process. The stages in this process are seven percentage bars with business icons. This is a completely editable PowerPoint presentation and is available for immediate download. Download now and impress your audience.

Five Tags Displaying Percentage Growth Powerpoint Template
This diagram contains colored tags infographic set. Download this diagram slide to display business planning and growth. This diagram is editable you can edit text, color, shade and style as per you need.
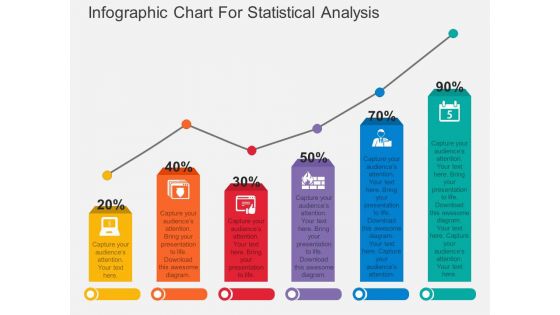
Infographic Chart For Statistical Analysis Powerpoint Template
Download this exclusive business diagram to display statistical analysis. This PowerPoint template contains bar chart with percentage values. This diagram is useful for business presentations.
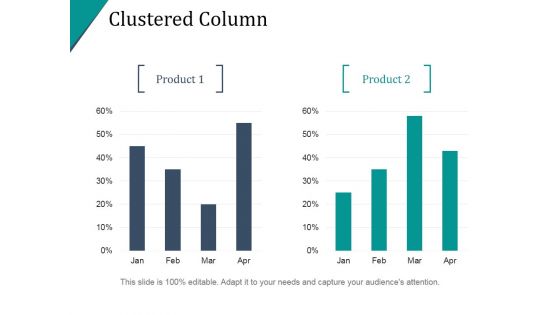
Clustered Column Ppt PowerPoint Presentation Infographic Template
This is a clustered column ppt powerpoint presentation infographic template. This is a two stage process. The stages in this process are finance, percentage, bar graph, business, marketing.
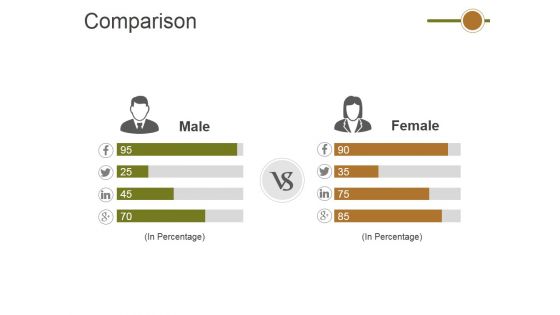
Comparison Ppt PowerPoint Presentation Infographic Template Show
This is a comparison ppt powerpoint presentation infographic template show. This is a two stage process. The stages in this process are male, female, in percentage.
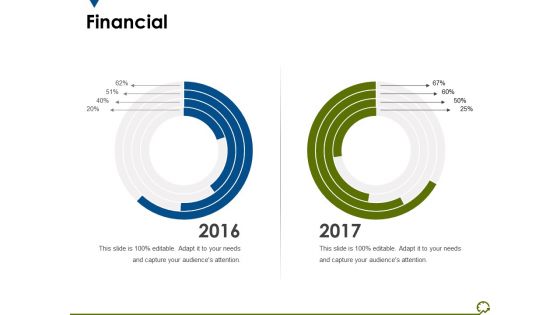
Financial Ppt PowerPoint Presentation Infographic Template Demonstration
This is a financial ppt powerpoint presentation infographic template demonstration. This is a two stage process. The stages in this process are finance, years, business, marketing, percentage.
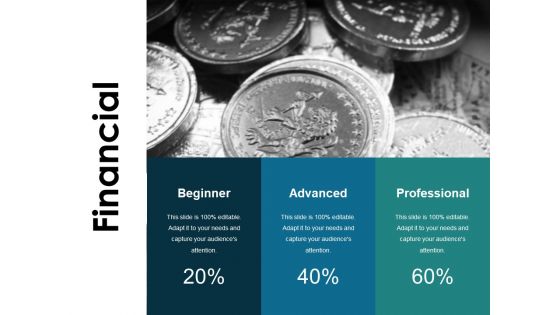
Financial Ppt PowerPoint Presentation Infographic Template
This is a financial ppt powerpoint presentation infographic template. This is a three stage process. The stages in this process are beginner, advanced, professional, finance, percentage.

Comparison Ppt PowerPoint Presentation Infographic Template Files
This is a comparison ppt powerpoint presentation infographic template files. This is a two stage process. The stages in this process are male accounts, percentage, compare, business, management.
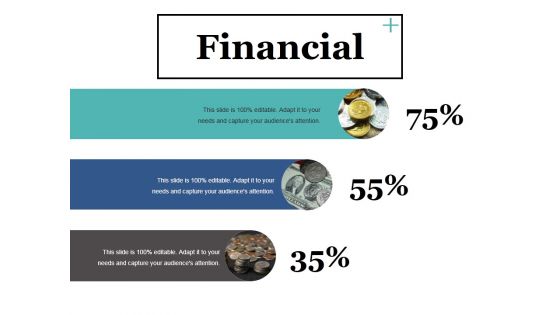
Financial Ppt PowerPoint Presentation Infographic Template Display
This is a financial ppt powerpoint presentation infographic template display. This is a three stage process. The stages in this process are business, percentage, finance, management, marketing.

Dashboard Ppt PowerPoint Presentation Infographic Template Show
This is a dashboard ppt powerpoint presentation infographic template show. This is one stage process. The stages in this process are business, dashboard, marketing, percentage, process.

Financial Ppt PowerPoint Presentation Infographic Template Ideas
This is a financial ppt powerpoint presentation infographic template ideas. This is a two stage process. The stages in this process are business, minimum, maximum, financial, percentage, marketing.

Financial Ppt PowerPoint Presentation Infographic Template Guide
This is a financial ppt powerpoint presentation infographic template guide. This is a three stage process. The stages in this process are product, percentage, marketing, business, financial.

Tasks Status Report Template Ppt PowerPoint Presentation Infographics Infographic Template
This is a tasks status report template ppt powerpoint presentation infographics infographic template. This is a five stage process. The stages in this process are task completion, assignment completion, work completion.

Area Chart Ppt PowerPoint Presentation Infographic Template Samples
This is a area chart ppt powerpoint presentation infographic template samples. This is a two stage process. The stages in this process are in percentage product, business, marketing, growth.
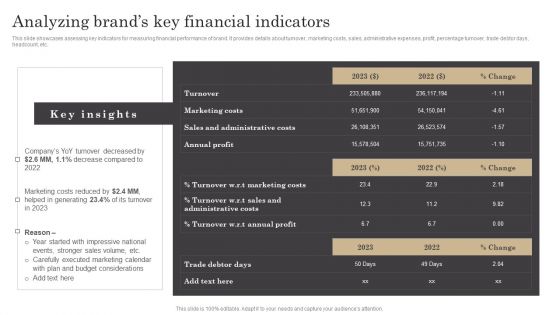
Analyzing Brands Key Financial Indicators Ppt Infographic Template Slides PDF
This slide showcases assessing key indicators for measuring financial performance of brand. It provides details about turnover, marketing costs, sales, administrative expenses, profit, percentage turnover, trade debtor days, headcount, etc. Are you in need of a template that can accommodate all of your creative concepts This one is crafted professionally and can be altered to fit any style. Use it with Google Slides or PowerPoint. Include striking photographs, symbols, depictions, and other visuals. Fill, move around, or remove text boxes as desired. Test out color palettes and font mixtures. Edit and save your work, or work with colleagues. Download Analyzing Brands Key Financial Indicators Ppt Infographic Template Slides PDF and observe how to make your presentation outstanding. Give an impeccable presentation to your group and make your presentation unforgettable.
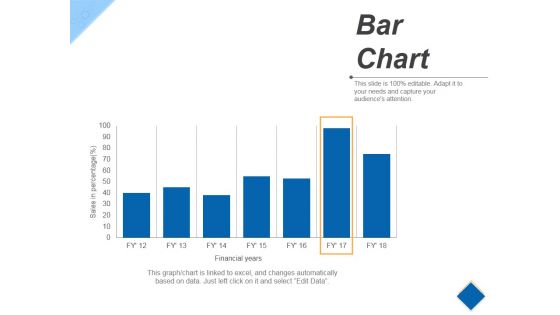
Bar Chart Ppt PowerPoint Presentation Infographic Template Example
This is a bar chart ppt powerpoint presentation infographic template example. This is a seven stage process. The stages in this process are business, finance, marketing, percentage.
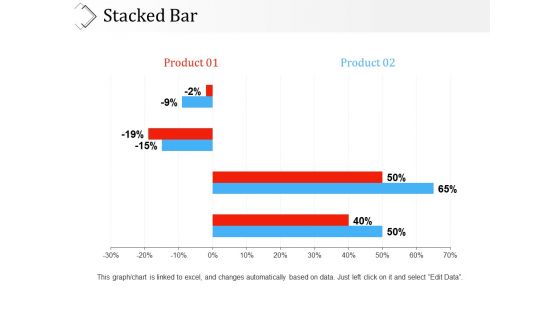
Stacked Bar Ppt PowerPoint Presentation Infographic Template Clipart
This is a stacked bar ppt powerpoint presentation infographic template clipart. This is a two stage process. The stages in this process are product, percentage, business, marketing, graph.
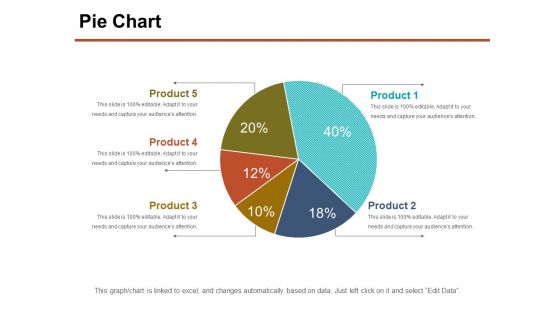
Pie Chart Ppt PowerPoint Presentation Outline Infographic Template
This is a pie chart ppt powerpoint presentation outline infographic template. This is a five stage process. The stages in this process are product, percentage, business, process.

Dashboard Ppt PowerPoint Presentation Infographic Template Background Image
This is a dashboard ppt powerpoint presentation infographic template background image. This is a three stage process. The stages in this process are dashboard, business, marketing, percentage, low.
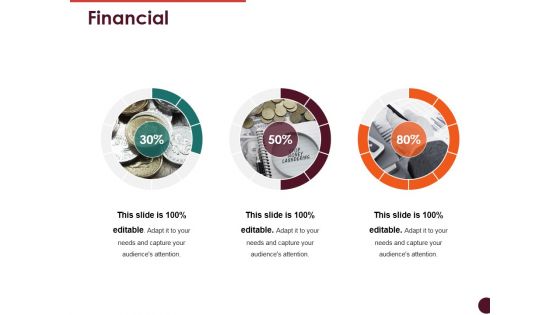
Financial Ppt PowerPoint Presentation Infographic Template Graphics Pictures
This is a financial ppt powerpoint presentation infographic template graphics pictures. This is a three stage process. The stages in this process are percentage, coin, business, finance, marketing.
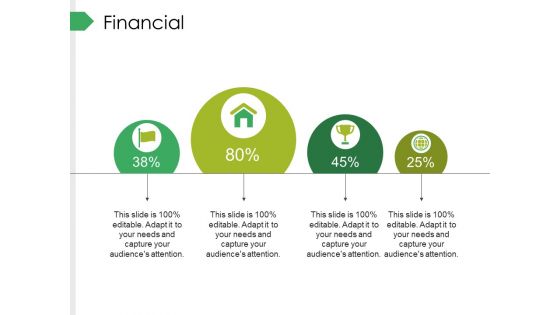
Financial Ppt PowerPoint Presentation Infographic Template Graphic Images
This is a financial ppt powerpoint presentation infographic template graphic images. This is a four stage process. The stages in this process are business, financial, marketing, percentage, strategy.

Pie Chart Ppt PowerPoint Presentation Infographic Template Topics
This is a pie chart ppt powerpoint presentation infographic template topics. This is a three stage process. The stages in this process are percentage, management, marketing, business.
Pie Chart Ppt PowerPoint Presentation Icon Infographic Template
This is a pie chart ppt powerpoint presentation icon infographic template. This is a three stage process. The stages in this process are percentage, product, management, business.

Area Chart Ppt PowerPoint Presentation Infographic Template Guidelines
This is a area chart ppt powerpoint presentation infographic template guidelines. This is a two stage process. The stages in this process are in percentage, chart, business, growth, strategy.
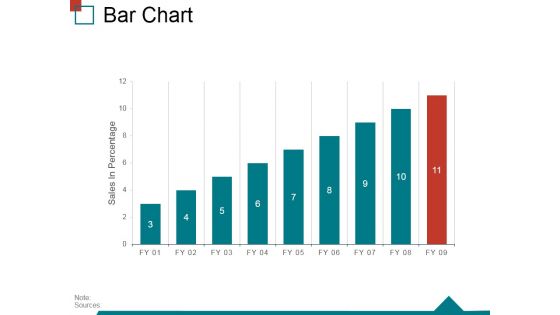
Bar Chart Ppt PowerPoint Presentation Infographic Template Skills
This is a bar chart ppt powerpoint presentation infographic template skills. This is a nine stage process. The stages in this process are sales in percentage, finance, business, marketing, strategy, success.

Clustered Column Line Ppt PowerPoint Presentation Infographic Template Deck
This is a clustered column line ppt powerpoint presentation infographic template deck. This is a three stage process. The stages in this process are business, strategy, analysis, planning, sales in percentage, financial year.

Line Chart Ppt PowerPoint Presentation Infographic Template Slides
This is a line chart ppt powerpoint presentation infographic template slides. This is a two stage process. The stages in this process are sales in percentage, financial years, business, marketing, graph.
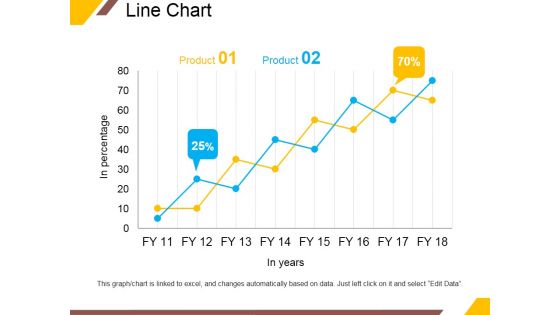
Line Chart Ppt PowerPoint Presentation Portfolio Infographic Template
This is a line chart ppt powerpoint presentation portfolio infographic template. This is a two stage process. The stages in this process are product, in years, business, percentage, growth.
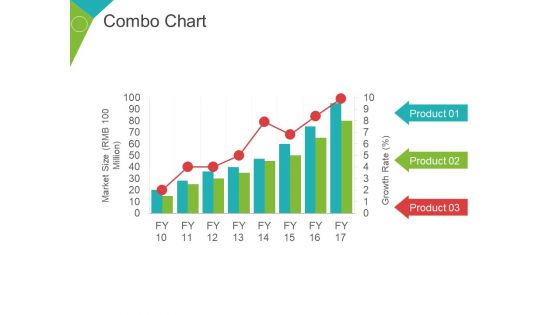
Combo Chart Ppt PowerPoint Presentation Infographic Template Graphic Images
This is a combo chart ppt powerpoint presentation infographic template graphic images. This is a three stage process. The stages in this process are market size, growth rate, percentage, business, marketing.
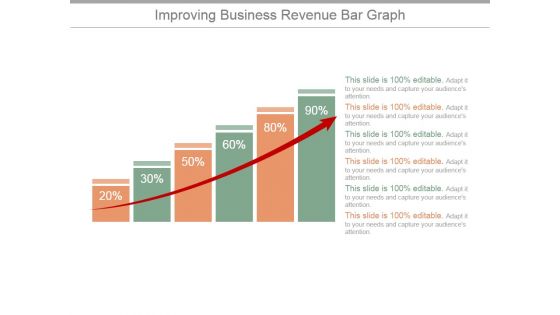
Improving Business Revenue Bar Graph Ppt PowerPoint Presentation Infographic Template
This is a improving business revenue bar graph ppt powerpoint presentation infographic template. This is a six stage process. The stages in this process are graph, arrow, finance, percentage, success.

Line Chart Ppt PowerPoint Presentation Outline Infographic Template
This is a line chart ppt powerpoint presentation outline infographic template. This is a two stage process. The stages in this process are in percentage, product, in year, growth, success.

Clustered Column Line Ppt PowerPoint Presentation Infographic Template Pictures
This is a clustered column line ppt powerpoint presentation infographic template pictures. This is a three stage process. The stages in this process are product, in percentage, bar graph, growth, success.

Area Chart Ppt PowerPoint Presentation Infographic Template Model
This is a area chart ppt powerpoint presentation infographic template model. This is a two stage process. The stages in this process are product, area chart, growth, percentage, success.
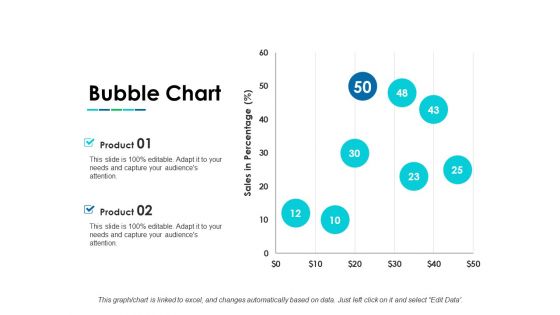
Bubble Chart Ppt PowerPoint Presentation Infographic Template Layouts
This is a bubble chart ppt powerpoint presentation infographic template layouts. This is a two stage process. The stages in this process are bubble chart, product, sales in percentage, growth.
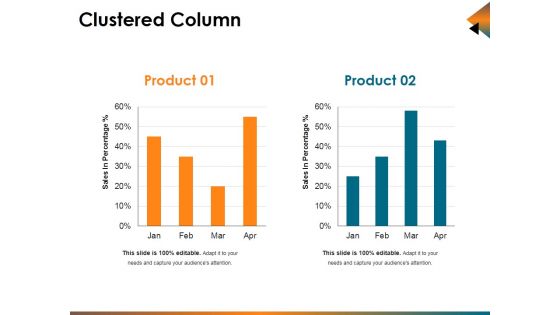
Clustered Column Ppt PowerPoint Presentation Infographic Template Background Designs
This is a clustered column ppt powerpoint presentation infographic template background designs. This is a two stage process. The stages in this process are sales in percentage, bar, business, marketing, planning.
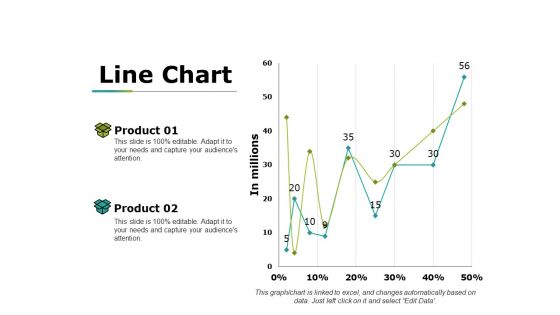
Line Chart Ppt PowerPoint Presentation Infographic Template Design Ideas
This is a line chart ppt powerpoint presentation infographic template design ideas. This is a two stage process. The stages in this process are product, in millions, percentage, line chart, success.
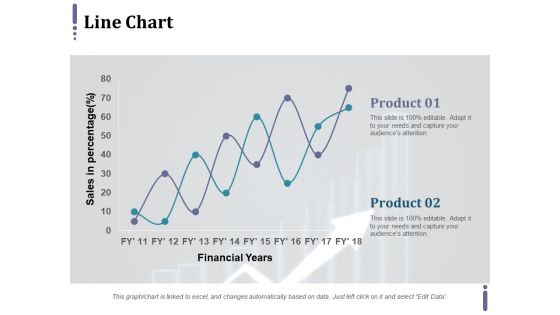
Line Chart Ppt PowerPoint Presentation Infographic Template Master Slide
This is a line chart ppt powerpoint presentation infographic template master slide. This is a two stage process. The stages in this process are product, financial years, sales in percentage.

 Home
Home