Percentage Charts

SEM Strategy For Customer Purchases Mockup PDF
This slide shows statistical percentage related to first time purchases of customers through online website or store with help of search engine marketing. It include statistics related to first time purchase, ordered groceries and online services comparison. Persuade your audience using this SEM Strategy For Customer Purchases Mockup PDF. This PPT design covers five stages, thus making it a great tool to use. It also caters to a variety of topics including Online Service, Purchase, Comparison Service. Download this PPT design now to present a convincing pitch that not only emphasizes the topic but also showcases your presentation skills.
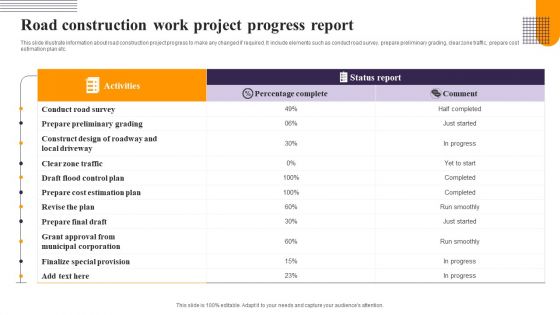
Road Construction Work Project Progress Report Background PDF
This slide illustrate information about road construction project progress to make any changed if required. It include elements such as conduct road survey, prepare preliminary grading, clear zone traffic, prepare cost estimation plan etc. Pitch your topic with ease and precision using this Road Construction Work Project Progress Report Background PDF. This layout presents information on Activities, Status Report, Percentage Complete. It is also available for immediate download and adjustment. So, changes can be made in the color, design, graphics or any other component to create a unique layout.
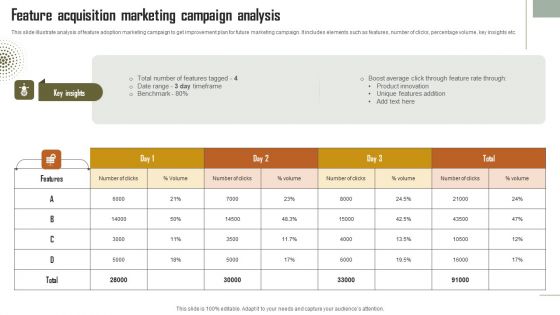
Feature Acquisition Marketing Campaign Analysis Slides PDF
This slide illustrate analysis of feature adoption marketing campaign to get improvement plan for future marketing campaign. It includes elements such as features, number of clicks, percentage volume, key insights etc. Pitch your topic with ease and precision using this Feature Acquisition Marketing Campaign Analysis Slides PDF. This layout presents information on Feature Acquisition, Marketing Campaign Analysis. It is also available for immediate download and adjustment. So, changes can be made in the color, design, graphics or any other component to create a unique layout.
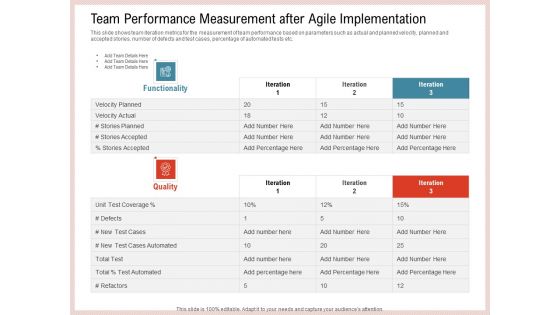
Agile Model Improve Task Team Performance Team Performance Measurement After Agile Implementation Slides PDF
This slide shows team iteration metrics for the measurement of team performance based on parameters such as actual and planned velocity, planned and accepted stories, number of defects and test cases, percentage of automated tests etc. Deliver and pitch your topic in the best possible manner with this agile model improve task team performance team performance measurement after agile implementation slides pdf. Use them to share invaluable insights on planned, actual, automated and impress your audience. This template can be altered and modified as per your expectations. So, grab it now.
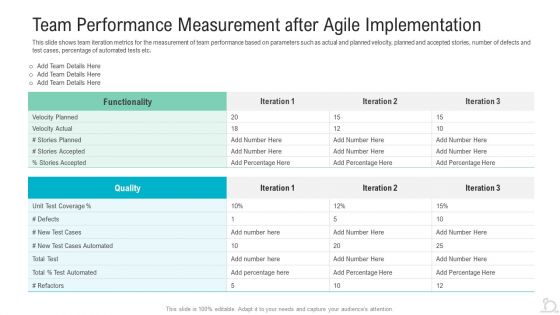
Team Performance Measurement After Agile Implementation Inspiration PDF
This slide shows team iteration metrics for the measurement of team performance based on parameters such as actual and planned velocity, planned and accepted stories, number of defects and test cases, percentage of automated tests etc. Deliver and pitch your topic in the best possible manner with this team performance measurement after agile implementation inspiration pdf. Use them to share invaluable insights on functionality, quality, velocity planned and impress your audience. This template can be altered and modified as per your expectations. So, grab it now.

Agile Methodologies Team Performance Measurement After Agile Implementation Infographics Ppt Infographic Template Ideas PDF
This slide shows team iteration metrics for the measurement of team performance based on parameters such as actual and planned velocity, planned and accepted stories, number of defects and test cases, percentage of automated tests etc. Deliver an awe inspiring pitch with this creative agile methodologies team performance measurement after agile implementation infographics ppt infographic template ideas pdf bundle. Topics like Team Performance Measurement After Agile Implementation can be discussed with this completely editable template. It is available for immediate download depending on the needs and requirements of the user.

Variance Analysis Techniques And Models For Production And Sales Technical Challenges Graphics PDF
This slide covers the planning table for gap analysis process. It also the sections for focus area, desired state, current state, identified gap percentage and action plan.Persuade your audience using this variance analysis techniques and models for production and sales technical challenges graphics pdf. This PPT design covers five stages, thus making it a great tool to use. It also caters to a variety of topics including production team, sales team, identified gap. Download this PPT design now to present a convincing pitch that not only emphasizes the topic but also showcases your presentation skills.
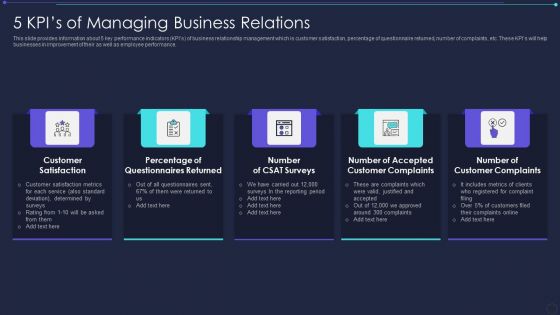
5 Kpis Of Managing Business Relations Elements PDF
This slide provides information about 5 key performance indicators KPIs of business relationship management which is customer satisfaction, percentage of questionnaire returned, number of complaints, etc. These KPIs will help businesses in improvement of their as well as employee performance. Presenting 5 kpis of managing business relations elements pdf to dispense important information. This template comprises five stages. It also presents valuable insights into the topics including customer satisfaction, determined surveys. This is a completely customizable PowerPoint theme that can be put to use immediately. So, download it and address the topic impactfully.

Quality Management Tools And Techniques For Analyzing Costs Brochure PDF
This slide focuses on the graphical representation of quality management tool for controlling costs which includes costs and percentage of defects on x and y axis respectively with prevention, inspection, internal and external failure, etc. Presenting quality management tools and techniques for analyzing costs brochure pdf to dispense important information. This template comprises five stages. It also presents valuable insights into the topics including cost, total cost of quality, prevention costs, optimal quality level, prevention, inspection, internal failure, external failure. This is a completely customizable PowerPoint theme that can be put to use immediately. So, download it and address the topic impactfully.
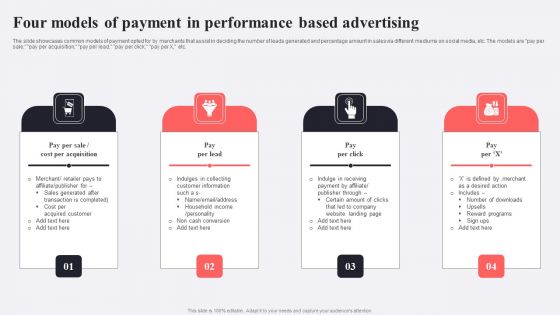
Four Models Of Payment In Performance Based Advertising Ideas PDF
The slide showcases common models of payment opted for by merchants that assist in deciding the number of leads generated and percentage amount in sales via different mediums on social media, etc. The models are pay per sale, pay per acquisition, pay per lead, pay per click, pay per X, etc. Presenting Four Models Of Payment In Performance Based Advertising Ideas PDF to dispense important information. This template comprises four stages. It also presents valuable insights into the topics including Cost Per Acquisition, Pay Per Lead, Pay Per Click. This is a completely customizable PowerPoint theme that can be put to use immediately. So, download it and address the topic impactfully.

Database Expansion And Optimization Budget Summary For Database Expansion And Optimization Ppt Styles Graphics Pictures
This slide represents the cost associated with each stage of the data repository expansion project. It also provides details regarding the percentage of the overall budget utilization at every step. Deliver an awe inspiring pitch with this creative database expansion and optimization budget summary for database expansion and optimization ppt styles graphics pictures bundle. Topics like planning, designing, implementation, testing, go live can be discussed with this completely editable template. It is available for immediate download depending on the needs and requirements of the user.

Project Portfolio Highlights Web Design And Development Company Profile Professional PDF
This slide showcases the project portfolio highlights which shows successfully designed websites along with company name and location Welcome to our selection of the Project Portfolio Highlights Web Design And Development Company Profile Professional PDF. These are designed to help you showcase your creativity and bring your sphere to life. Planning and Innovation are essential for any business that is just starting out. This collection contains the designs that you need for your everyday presentations. All of our PowerPoints are 100 percentage editable, so you can customize them to suit your needs. This multi purpose template can be used in various situations. Grab these presentation templates today.
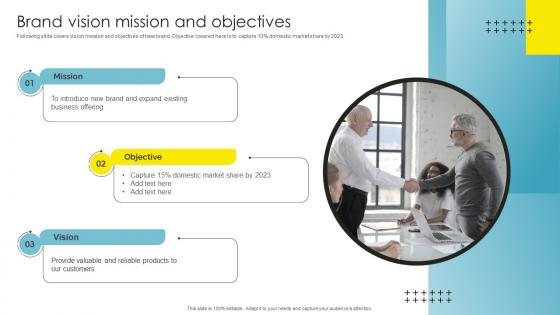
Strategic Brand Management Brand Vision Mission And Objectives Elements Pdf
Following slide covers vision mission and objectives of new brand. Objective covered here is to capture 10 percentage domestic market share by 2023. Welcome to our selection of the Strategic Brand Management Brand Vision Mission And Objectives Elements Pdf. These are designed to help you showcase your creativity and bring your sphere to life. Planning and Innovation are essential for any business that is just starting out. This collection contains the designs that you need for your everyday presentations. All of our PowerPoints are 100 percent editable, so you can customize them to suit your needs. This multi purpose template can be used in various situations. Grab these presentation templates today.
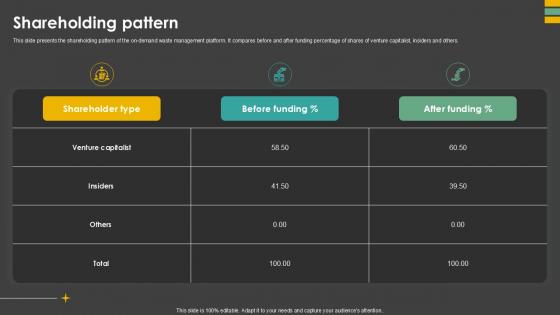
Shareholding Pattern Waste Control Platform Pitch Deck Ppt Sample
This slide presents the shareholding pattern of the on-demand waste management platform. It compares before and after funding percentage of shares of venture capitalist, insiders and others. Welcome to our selection of the Shareholding Pattern Waste Control Platform Pitch Deck Ppt Sample. These are designed to help you showcase your creativity and bring your sphere to life. Planning and Innovation are essential for any business that is just starting out. This collection contains the designs that you need for your everyday presentations. All of our PowerPoints are 100Percent editable, so you can customize them to suit your needs. This multi-purpose template can be used in various situations. Grab these presentation templates today.

Bar Graph Ppt PowerPoint Presentation Introduction
This is a bar graph ppt powerpoint presentation introduction. This is a eleven stage process. The stages in this process are management, marketing, business, fy, graph, sales in percentage.
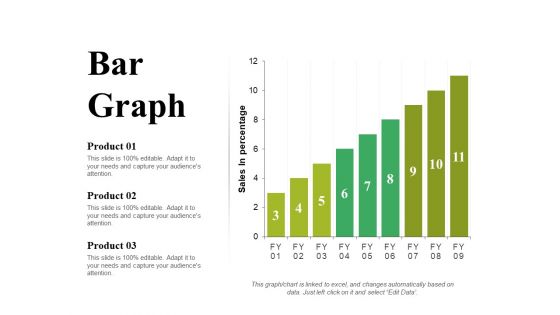
Bar Graph Ppt PowerPoint Presentation Portfolio Slide Portrait
This is a bar graph ppt powerpoint presentation portfolio slide portrait. This is a three stage process. The stages in this process are product, sales in percentage, bar graph, growth, success.
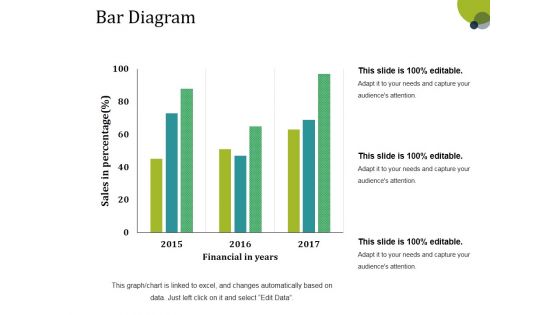
Bar Diagram Ppt PowerPoint Presentation Gallery Structure
This is a bar diagram ppt powerpoint presentation gallery structure. This is a three stage process. The stages in this process are financial in years, sales in percentage, bar graph, growth, success.

Bar Graph Product Ppt PowerPoint Presentation Model Graphic Tips
This is a bar graph product ppt powerpoint presentation model graphic tips. This is a three stage process. The stages in this process are product, percentage, business, management, marketing.
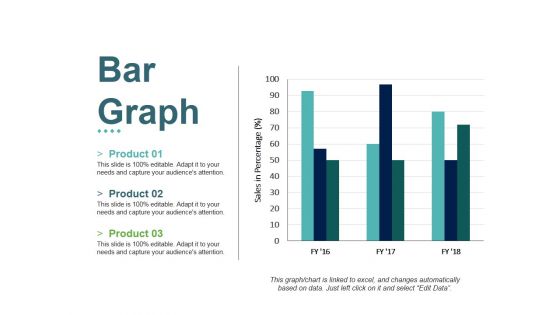
Bar Graph Ppt PowerPoint Presentation File Slides
This is a bar graph ppt powerpoint presentation file slides. This is a three stage process. The stages in this process are product, sales in percentage, bar graph, growth, success.

Bar Diagram Ppt PowerPoint Presentation Pictures Background Image
This is a bar diagram ppt powerpoint presentation pictures background image. This is a three stage process. The stages in this process are financial in years, sales in percentage, bar graph, growth, success.

Bar Graph Template 2 Ppt PowerPoint Presentation Ideas Files
This is a bar graph template 2 ppt powerpoint presentation ideas files. This is a five stage process. The stages in this process are in percentage, business, marketing, finance, graph.

Clustered Column Template 2 Ppt PowerPoint Presentation Summary Smartart
This is a clustered column template 2 ppt powerpoint presentation summary smartart. This is a two stage process. The stages in this process are product, bar graph, in percentage, clustered column, growth.

Clustered Column Line Ppt PowerPoint Presentation Infographic Template Pictures
This is a clustered column line ppt powerpoint presentation infographic template pictures. This is a three stage process. The stages in this process are product, in percentage, bar graph, growth, success.
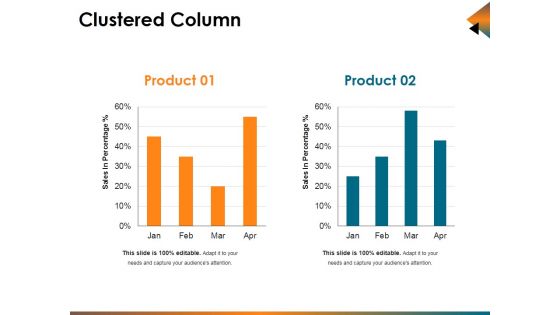
Clustered Column Ppt PowerPoint Presentation Infographic Template Background Designs
This is a clustered column ppt powerpoint presentation infographic template background designs. This is a two stage process. The stages in this process are sales in percentage, bar, business, marketing, planning.
Bar Graph Ppt PowerPoint Presentation Infographics Icon
This is a bar graph ppt powerpoint presentation infographics icon. This is a two stage process. The stages in this process are business, marketing, financial year, in percentage, graph.
Clustered Column Line Ppt PowerPoint Presentation Icon Ideas
This is a clustered column line ppt powerpoint presentation icon ideas. This is a three stage process. The stages in this process are product, in percentage, bar graph, success, growth.
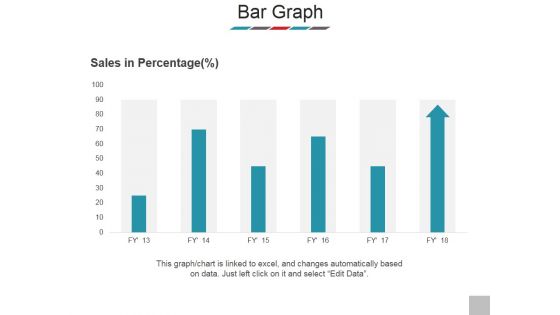
Bar Graph Ppt PowerPoint Presentation Model Clipart
This is a bar graph ppt powerpoint presentation model clipart. This is a six stage process. The stages in this process are sales in percentage, product, bar graph, business, marketing.
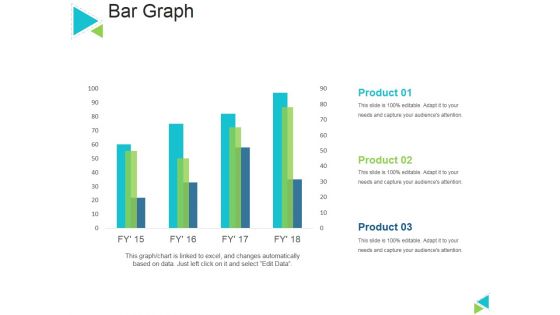
Bar Graph Ppt PowerPoint Presentation Outline Layout
This is a bar graph ppt powerpoint presentation outline layout. This is a four stage process. The stages in this process are sales in percentage, product, bar graph, business, marketing.

Bar Graph Ppt PowerPoint Presentation Summary Format
This is a bar graph ppt powerpoint presentation summary format. This is a three stage process. The stages in this process are bar graph, business, marketing, years, percentage, finance.
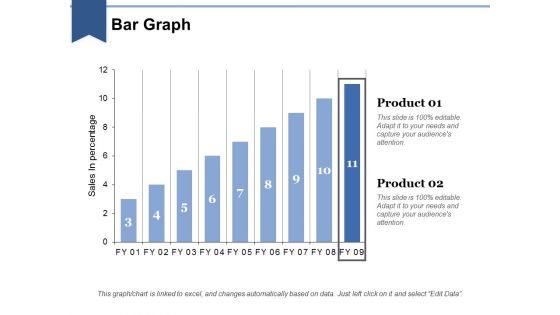
Bar Graph Ppt PowerPoint Presentation Layouts Influencers
This is a bar graph ppt powerpoint presentation layouts influencers. This is a two stage process. The stages in this process are business, marketing, in bar graph, sales in percentage, finance.
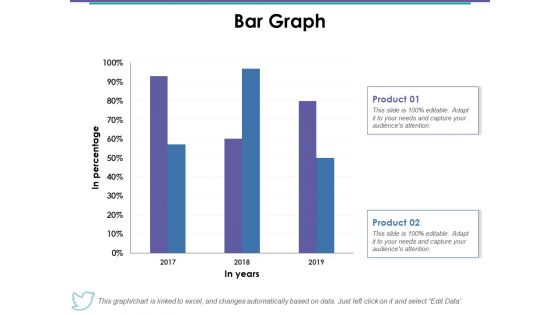
Bar Graph Ppt PowerPoint Presentation Styles Skills
This is a bar graph ppt powerpoint presentation styles skills. This is a two stage process. The stages in this process are bar graph, product, in year, in percentage, business.
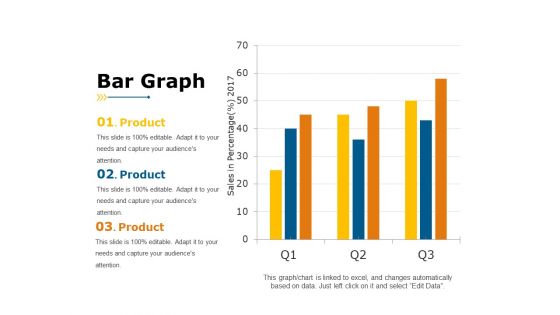
Bar Graph Ppt PowerPoint Presentation Portfolio Example
This is a bar graph ppt powerpoint presentation portfolio example. This is a three stage process. The stages in this process are sales in percentage, year, business, product, business, graph.

Stacked Area Clustered Column Ppt PowerPoint Presentation Model Guidelines
This is a stacked area clustered column ppt powerpoint presentation model guidelines. This is a three stage process. The stages in this process are product, in percentage, bar graph, growth, success.
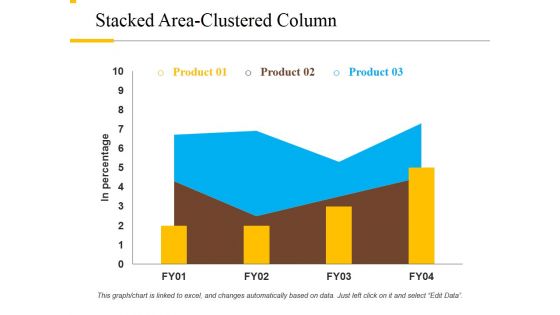
Stacked Area Clustered Column Ppt PowerPoint Presentation File Background Designs
This is a stacked area clustered column ppt powerpoint presentation file background designs. This is a three stage process. The stages in this process are product, in percentage, growth, success, bar graph.

Clustered Column Line Ppt PowerPoint Presentation Pictures Example
This is a clustered column line ppt powerpoint presentation pictures example. This is a three stage process. The stages in this process are product, in percentage, bar graph, growth, success.

Clustered Column Line Ppt PowerPoint Presentation Topics
This is a clustered column line ppt powerpoint presentation topics. This is a three stage process. The stages in this process are product, in percentage, growth, bar graph, business.

Scatter Line Ppt PowerPoint Presentation Visual Aids Diagrams
This is a scatter line ppt powerpoint presentation visual aids diagrams. This is a one stage process. The stages in this process are dollar in millions, sales in percentage, growth, business, marketing.
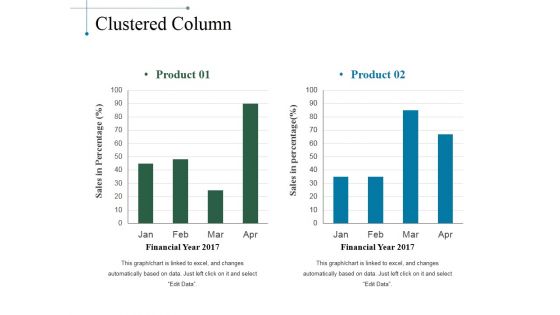
Clustered Column Ppt PowerPoint Presentation Slides Smartart
This is a clustered column ppt powerpoint presentation slides smartart. This is a two stage process. The stages in this process are product, sales in percentage, financial year, bar graph.

Stacked Area Clustered Column Ppt PowerPoint Presentation Gallery Gridlines
This is a stacked area clustered column ppt powerpoint presentation gallery gridlines. This is a three stage process. The stages in this process are bar graph, product, in percentage.

Stacked Area Clustered Column Ppt PowerPoint Presentation Summary Slides
This is a stacked area clustered column ppt powerpoint presentation summary slides. This is a three stage process. The stages in this process are product, in percentage, financial year, bar graph.
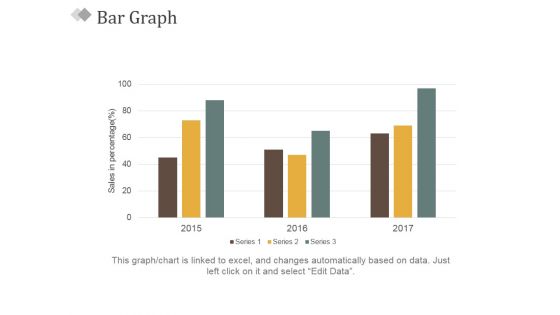
Bar Graph Ppt PowerPoint Presentation Slides Visual Aids
This is a bar graph ppt powerpoint presentation slides visual aids. This is a three stage process. The stages in this process are sales in percentage, bar graph, business, marketing, success.
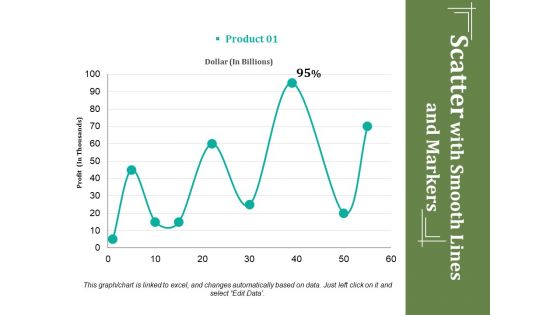
Scatter With Smooth Lines And Markers Ppt PowerPoint Presentation Ideas Deck
This is a scatter with smooth lines and markers ppt powerpoint presentation ideas deck. This is a one stage process. The stages in this process are profit, dollar, percentage, business, growth.
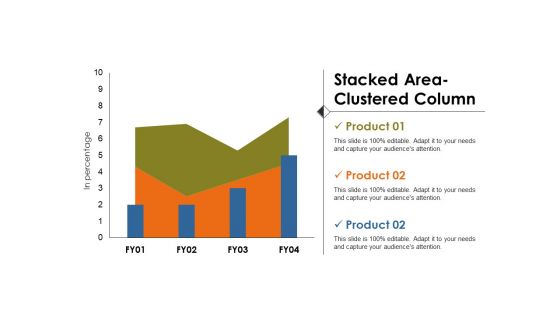
Stacked Area Clustered Column Ppt PowerPoint Presentation Summary Gallery
This is a stacked area clustered column ppt powerpoint presentation summary gallery. This is a three stage process. The stages in this process are in percentage, business, marketing, growth, strategy.

Clustered Column Line Ppt PowerPoint Presentation File Picture
This is a clustered column line ppt powerpoint presentation file picture. This is a three stage process. The stages in this process are business, in percentage, marketing, growth, strategy, graph.

Clustered Column Line Ppt PowerPoint Presentation Inspiration Layouts
This is a clustered column line ppt powerpoint presentation inspiration layouts. This is a four stage process. The stages in this process are in percentage, product, business, strategy, graph.

Stacked Area Clustered Column Ppt PowerPoint Presentation Pictures Brochure
This is a stacked area clustered column ppt powerpoint presentation pictures brochure. This is a three stage process. The stages in this process are in percentage, business, marketing, graph, strategy.
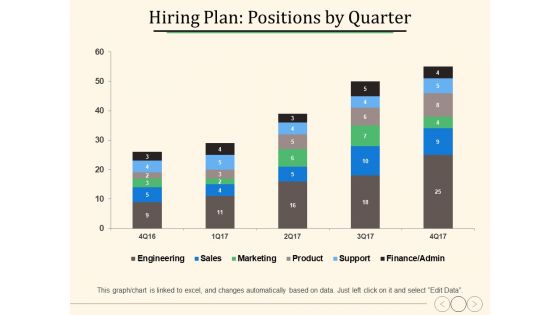
Hiring Plan Positions By Quarter Ppt PowerPoint Presentation Slides Deck
This is a hiring plan positions by quarter ppt powerpoint presentation slides deck. This is a five stage process. The stages in this process are percentage, product, business, management.

Stacked Bar Template 1 Ppt PowerPoint Presentation Gallery Clipart
This is a stacked bar template 1 ppt powerpoint presentation gallery clipart. This is a two stage process. The stages in this process are percentage, graph, business, marketing, finance.

Stacked Bar Template 1 Ppt PowerPoint Presentation Outline Good
This is a stacked bar template 1 ppt powerpoint presentation outline good. This is a two stage process. The stages in this process are in percentage, business, marketing, graph, strategy.

Stacked Bar Template 2 Ppt PowerPoint Presentation Professional Graphics Pictures
This is a stacked bar template 2 ppt powerpoint presentation professional graphics pictures. This is a two stage process. The stages in this process are in percentage, business, marketing, graph, strategy.
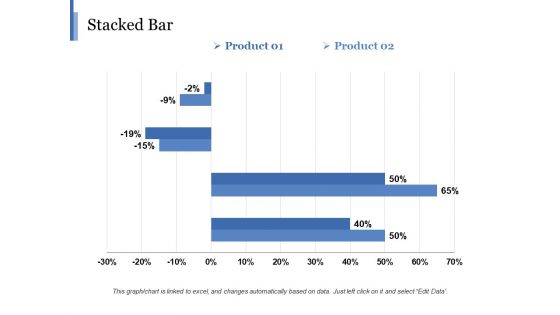
Stacked Bar Template 2 Ppt PowerPoint Presentation Gallery Background
This is a stacked bar template 2 ppt powerpoint presentation gallery background. This is a two stage process. The stages in this process are business, marketing, finance, graph, strategy, percentage.

Clustered Bar Finance Ppt Powerpoint Presentation Ideas Themes
This is a clustered bar finance ppt powerpoint presentation ideas themes. This is a three stage process. The stages in this process are clustered bar, product, in percentage, years, profit.

Stacked Bar Template 2 Ppt PowerPoint Presentation Model Graphic Images
This is a stacked bar template 2 ppt powerpoint presentation model graphic images. This is a two stage process. The stages in this process are business, years, marketing, percentage, finance.
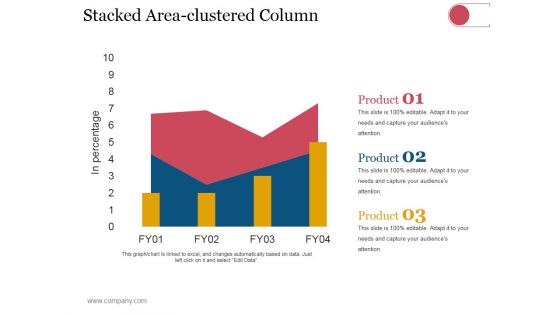
Stacked Area Clustered Column Ppt PowerPoint Presentation Styles Gridlines
This is a stacked area clustered column ppt powerpoint presentation styles gridlines. This is a three stage process. The stages in this process are dollars, in percentage, finance, growth strategy, business, strategy.
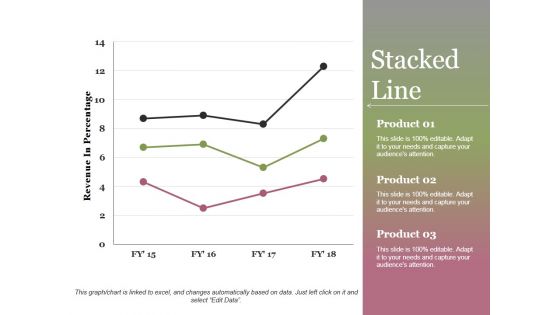
Stacked Line Ppt PowerPoint Presentation Show
This is a stacked line ppt powerpoint presentation show. This is a three stage process. The stages in this process are revenue in percentage, product, stacked line, growth, success.
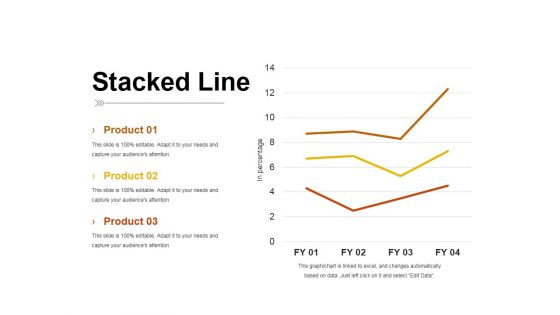
Stacked Line Ppt PowerPoint Presentation Inspiration Pictures
This is a stacked line ppt powerpoint presentation inspiration pictures. This is a three stage process. The stages in this process are product, stacked line, in percentage, business, growth.
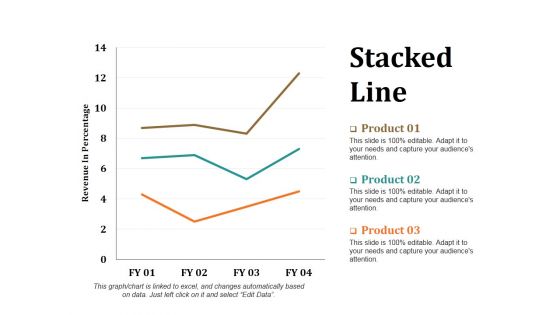
Stacked Line Ppt PowerPoint Presentation Layouts Portrait
This is a stacked line ppt powerpoint presentation layouts portrait. This is a three stage process. The stages in this process are revenue in percentage, stacked line, product, growth, success.

Clustered Column Line Ppt PowerPoint Presentation Summary Background Image
This is a clustered column line ppt powerpoint presentation summary background image. This is a four stage process. The stages in this process are in percentage, product, graph, growth, success.

Clustered Column Ppt PowerPoint Presentation File Graphics
This is a clustered column ppt powerpoint presentation file graphics. This is a two stage process. The stages in this process are product, financial year, sales in percentage, graph, growth.
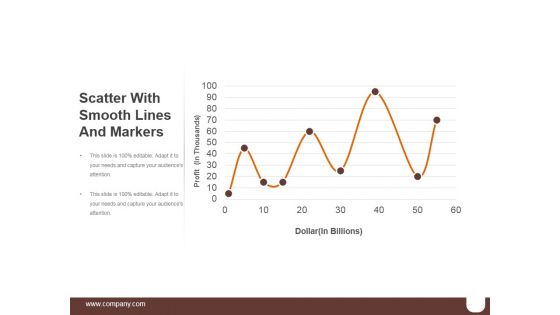
Scatter With Smooth Lines And Markers Ppt PowerPoint Presentation Ideas
This is a scatter with smooth lines and markers ppt powerpoint presentation ideas. This is a seven stage process. The stages in this process are business, marketing, percentage, success, finance.

 Home
Home