Comparison Dashboard

Business Diagram Five Staged Comparative Chart For Data Comparison Presentation Template
Five staged comparative chart has been used to design this power point template. This PPT contains the concept of data comparison. Use this PPT for your business and finance based data comparison in any financial presentation.

Comparison For Determining Best Lead Various Techniques For Managing Rules PDF
This slide covers the lead management software advantages such as collecting essential lead data, real-time lead analysis, regular follow-ups, collaboration with the sales team, automation, and keeping track of all interactions. Do you have an important presentation coming up Are you looking for something that will make your presentation stand out from the rest Look no further than Comparison For Determining Best Lead Various Techniques For Managing Rules PDF. With our professional designs, you can trust that your presentation will pop and make delivering it a smooth process. And with Slidegeeks, you can trust that your presentation will be unique and memorable. So why wait Grab Comparison For Determining Best Lead Various Techniques For Managing Rules PDF today and make your presentation stand out from the rest
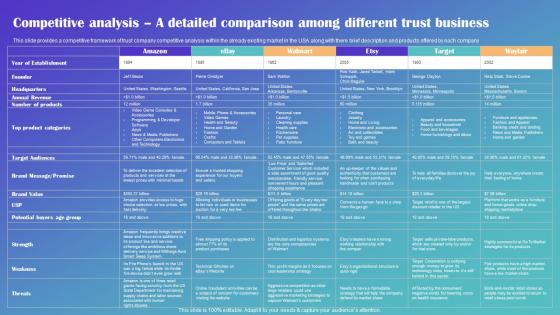
Competitive Analysis A Detailed Comparison Among Different Drop Shipping Business Plan Rules Pdf
This slide provides a competitive framework of trust company competitive analysis within the already existing market in the USA along with there brief description and products offered by each company The Competitive Analysis A Detailed Comparison Among Different Drop Shipping Business Plan Rules Pdf is a compilation of the most recent design trends as a series of slides. It is suitable for any subject or industry presentation, containing attractive visuals and photo spots for businesses to clearly express their messages. This template contains a variety of slides for the user to input data, such as structures to contrast two elements, bullet points, and slides for written information. Slidegeeks is prepared to create an impression.
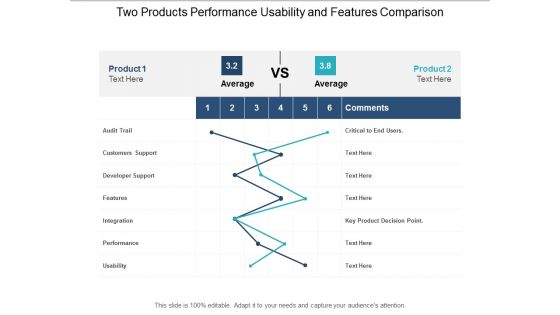
Two Products Performance Usability And Features Comparison Ppt Powerpoint Presentation Infographic Template Portrait
This is a two products performance usability and features comparison ppt powerpoint presentation infographic template portrait. This is a two stage process. The stages in this process are product differentiation, product comparison, brand differentiation.

Data Analysis Excel Driven Pie Chart For Easy Comparison PowerPoint Slides Templates
Our data analysis excel driven pie chart for easy comparison powerpoint slides Templates Abhor Doodling. They Never Let The Interest Flag.

Data Analysis In Excel 3d Bar Chart For Comparison Of Time Series PowerPoint Templates
Double Your Chances With Our data analysis in excel 3d bar chart for comparison of time series Powerpoint Templates . The Value Of Your Thoughts Will Increase Two-Fold.

Quantitative Data Analysis 3d Line Chart For Comparison Of PowerPoint Templates
Touch Base With Our quantitative data analysis 3d line chart for comparison of Powerpoint Templates . Review Your Growth With Your Audience.
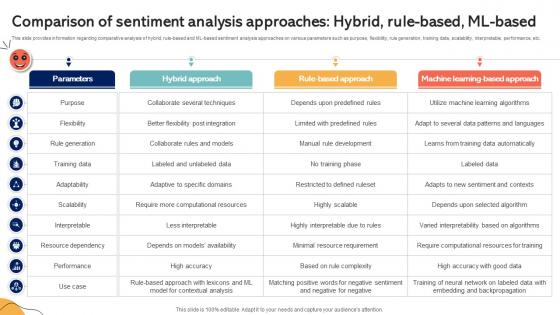
Comparison Of Sentiment Analysis Approaches Hybrid Rule Emotionally Intelligent Insights Leveraging AI SS V
This slide provides information regarding comparative analysis of hybrid, rule-based and ML-based sentiment analysis approaches on various parameters such as purpose, flexibility, rule generation, training data, scalability, interpretable, performance, etc. Present like a pro with Comparison Of Sentiment Analysis Approaches Hybrid Rule Emotionally Intelligent Insights Leveraging AI SS V. Create beautiful presentations together with your team, using our easy-to-use presentation slides. Share your ideas in real-time and make changes on the fly by downloading our templates. So whether you are in the office, on the go, or in a remote location, you can stay in sync with your team and present your ideas with confidence. With Slidegeeks presentation got a whole lot easier. Grab these presentations today.
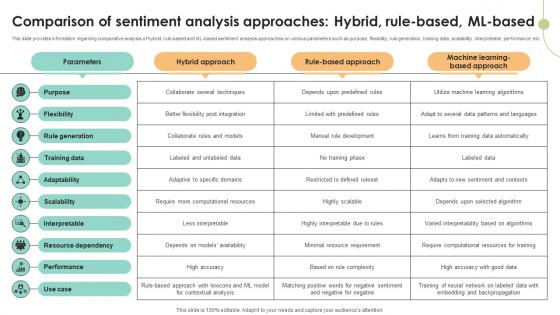
Comparison Of Sentiment Analysis Approaches Decoding User Emotions In Depth Exploration AI SS V
This slide provides information regarding comparative analysis of hybrid, rule-based and ML-based sentiment analysis approaches on various parameters such as purpose, flexibility, rule generation, training data, scalability, interpretable, performance, etc. Present like a pro with Comparison Of Sentiment Analysis Approaches Decoding User Emotions In Depth Exploration AI SS V. Create beautiful presentations together with your team, using our easy-to-use presentation slides. Share your ideas in real-time and make changes on the fly by downloading our templates. So whether you are in the office, on the go, or in a remote location, you can stay in sync with your team and present your ideas with confidence. With Slidegeeks presentation got a whole lot easier. Grab these presentations today.
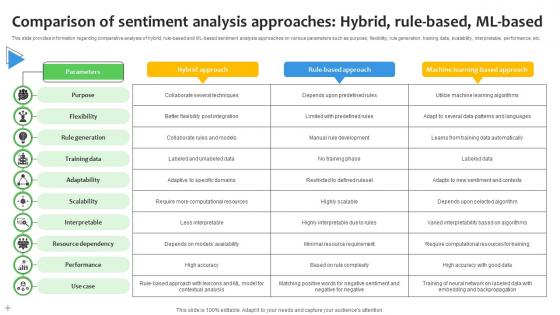
Comparison Of Sentiment Analysis Approaches Hybrid Rule Based ML Based AI SS V
This slide provides information regarding comparative analysis of hybrid, rule-based and ML-based sentiment analysis approaches on various parameters such as purpose, flexibility, rule generation, training data, scalability, interpretable, performance, etc. Present like a pro with Comparison Of Sentiment Analysis Approaches Hybrid Rule Based ML Based AI SS V. Create beautiful presentations together with your team, using our easy-to-use presentation slides. Share your ideas in real-time and make changes on the fly by downloading our templates. So whether you are in the office, on the go, or in a remote location, you can stay in sync with your team and present your ideas with confidence. With Slidegeeks presentation got a whole lot easier. Grab these presentations today.
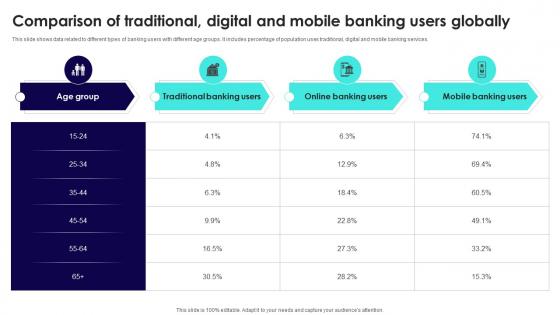
Wireless Banking To Improve Comparison Of Traditional Digital And Mobile Fin SS V
This slide shows data related to different types of banking users with different age groups. It includes percentage of population uses traditional, digital and mobile banking services. Are you in need of a template that can accommodate all of your creative concepts This one is crafted professionally and can be altered to fit any style. Use it with Google Slides or PowerPoint. Include striking photographs, symbols, depictions, and other visuals. Fill, move around, or remove text boxes as desired. Test out color palettes and font mixtures. Edit and save your work, or work with colleagues. Download Wireless Banking To Improve Comparison Of Traditional Digital And Mobile Fin SS V and observe how to make your presentation outstanding. Give an impeccable presentation to your group and make your presentation unforgettable.

Data Lake Architecture Future Of Data Analysis Comparison Between Data Warehouse Diagrams PDF
This slide represents the comparison between data warehouse, data lake and data lakehouse based on the period and components of both, along with information insights carried out.Deliver and pitch your topic in the best possible manner with this Data Lake Architecture Future Of Data Analysis Comparison Between Data Warehouse Diagrams PDF. Use them to share invaluable insights on Data Warehouse, Unstructured Data, Streaming Analytics and impress your audience. This template can be altered and modified as per your expectations. So, grab it now.
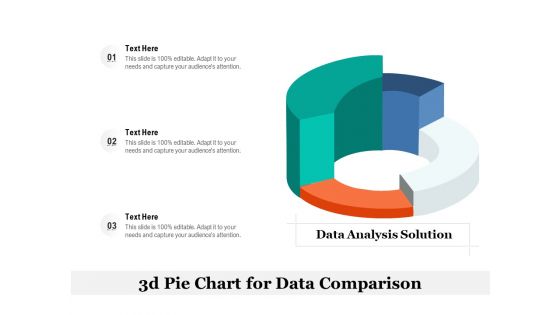
3D Pie Chart For Data Comparison Ppt Infographic Template Vector PDF
Presenting 3d pie chart for data comparison ppt infographic template vector pdf. to dispense important information. This template comprises three stages. It also presents valuable insights into the topics including data analysis solution, 3d pie chart for data comparison. This is a completely customizable PowerPoint theme that can be put to use immediately. So, download it and address the topic impactfully.
Product Performance Comparison Report Vector Icon Ppt PowerPoint Presentation Infographics Graphic Images PDF
Presenting this set of slides with name product performance comparison report vector icon ppt powerpoint presentation infographics graphic images pdf. The topics discussed in these slide is product performance comparison report vector icon. This is a completely editable PowerPoint presentation and is available for immediate download. Download now and impress your audience.

BI Technique For Data Informed Decisions Sap Analytics Cloud Comparison With Other BI Tools Structure PDF
The purpose of this slide is to showcase the comparison of SAP Analytics Cloud comparison with other available tools in the market. The comparison is done on multiple parameters such as pricing, core functionalities, and training available. Formulating a presentation can take up a lot of effort and time, so the content and message should always be the primary focus. The visuals of the PowerPoint can enhance the presenters message, so our BI Technique For Data Informed Decisions Sap Analytics Cloud Comparison With Other BI Tools Structure PDF was created to help save time. Instead of worrying about the design, the presenter can concentrate on the message while our designers work on creating the ideal templates for whatever situation is needed. Slidegeeks has experts for everything from amazing designs to valuable content, we have put everything into BI Technique For Data Informed Decisions Sap Analytics Cloud Comparison With Other BI Tools Structure PDF.

Sales Department Strategies Increase Revenues Sales Comparison Year Over Year Infographics PDF
The sales department compares the sales figures of two years. This comparison will help firm in analyzing how well the department is performing between two years. Deliver an awe-inspiring pitch with this creative sales department strategies increase revenues sales comparison year over year infographics pdf bundle. Topics like sales comparison year over year can be discussed with this completely editable template. It is available for immediate download depending on the needs and requirements of the user.
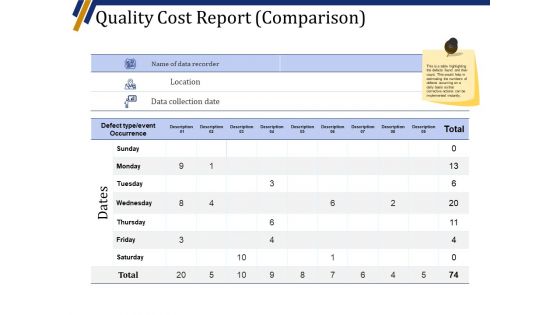
Quality Cost Report Comparison Template 2 Ppt PowerPoint Presentation Outline Maker
This is a quality cost report comparison template 2 ppt powerpoint presentation outline maker. This is a nine stage process. The stages in this process are defect type event occurrence, data collection date, location, name of data recorder, dates.
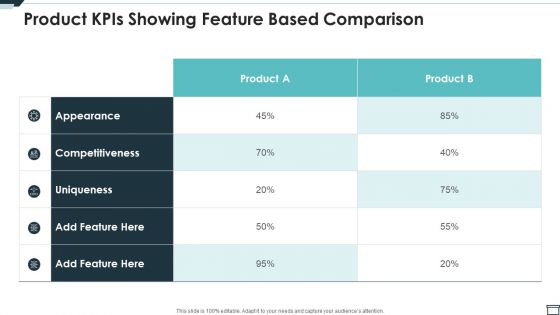
Product Kpis Showing Feature Based Comparison Ppt PowerPoint Presentation Gallery Layouts PDF
Pitch your topic with ease and precision using this product kpis showing feature based comparison ppt powerpoint presentation gallery layouts pdf. This layout presents information on product kpis showing feature based comparison. It is also available for immediate download and adjustment. So, changes can be made in the color, design, graphics or any other component to create a unique layout.
Two Products Comparison Report Vector Icon Ppt PowerPoint Presentation Professional Graphics Template PDF
Pitch your topic with ease and precision using this two products comparison report vector icon ppt powerpoint presentation professional graphics template pdf. This layout presents information on two products, comparison report vector icon. It is also available for immediate download and adjustment. So, changes can be made in the color, design, graphics or any other component to create a unique layout.
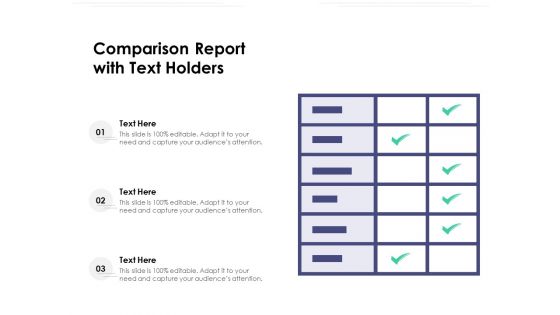
Comparison Report With Text Holders Ppt PowerPoint Presentation Summary Themes PDF
Showcasing this set of slides titled comparison report with text holders ppt powerpoint presentation summary themes pdf. The topics addressed in these templates are comparison report with text holders. All the content presented in this PPT design is completely editable. Download it and make adjustments in color, background, font etc. as per your unique business setting.
Two Services Comparison Report With Free And Premium Version Ppt PowerPoint Presentation Icon Outline PDF
Showcasing this set of slides titled two services comparison report with free and premium version ppt powerpoint presentation icon outline pdf. The topics addressed in these templates are two services comparison report with free and premium version. All the content presented in this PPT design is completely editable. Download it and make adjustments in color, background, font etc. as per your unique business setting.

MIS Comparison Between Data Warehouse And Operational Database System ODS Ppt PowerPoint Presentation Show Images PDF
This slide depicts the comparison between data warehouse and operational database systems based on design, purpose, data storage orientation, performance, and so on.Deliver an awe inspiring pitch with this creative MIS Comparison Between Data Warehouse And Operational Database System ODS Ppt PowerPoint Presentation Show Images PDF bundle. Topics like Concerned With Information, Performance Is Excellent, Analytical Processing can be discussed with this completely editable template. It is available for immediate download depending on the needs and requirements of the user.

Comparison Between Data Warehouse Data Lake And Data Lakehouse Brochure PDF
This slide represents the comparison between data warehouse, data lake and data lakehouse based on the period and components of both, along with information insights carried out. Deliver an awe inspiring pitch with this creative Comparison Between Data Warehouse Data Lake And Data Lakehouse Brochure PDF bundle. Topics like Data Warehouse, Operational Data, External Data can be discussed with this completely editable template. It is available for immediate download depending on the needs and requirements of the user.

Pie Chat For Data Comparison And Management Ppt PowerPoint Presentation Gallery Outline PDF
Presenting pie chat for data comparison and management ppt powerpoint presentation gallery outline pdf to dispense important information. This template comprises three stages. It also presents valuable insights into the topics including pie chat for data comparison and management. This is a completely customizable PowerPoint theme that can be put to use immediately. So, download it and address the topic impactfully.

Supplier Scorecard Supplier Comparison Scorecard With Key Performance Indicator Chart Formats PDF
This is a supplier scorecard supplier comparison scorecard with key performance indicator chart formats pdf template with various stages. Focus and dispense information on one stages using this creative set, that comes with editable features. It contains large content boxes to add your information on topics like supplier comparison scorecard, key performance, indicator chart. You can also showcase facts, figures, and other relevant content using this PPT layout. Grab it now.

Data Warehouse Implementation Comparison Between Database And Data Warehouse Template PDF
This slide depicts a comparison between database and data warehouse based on the design, type of information both stores, data sources, data availability, and so on.Deliver and pitch your topic in the best possible manner with this Data Warehouse Implementation Comparison Between Database And Data Warehouse Template PDF. Use them to share invaluable insights on Extensive Informationtransaction Processing, Data Collecting and impress your audience. This template can be altered and modified as per your expectations. So, grab it now.

Data Analysis Process Reviews And Comparison Of Factors Ppt PowerPoint Presentation Infographic Template Graphics Template
This is a data analysis process reviews and comparison of factors ppt powerpoint presentation infographic template graphics template. This is a seven stage process. The stages in this process are data analysis, data review, data evaluation.

7 Sections Pie Chart For Data Comparison Ppt PowerPoint Presentation File Graphics Template
This is a 7 sections pie chart for data comparison ppt powerpoint presentation file graphics template. This is a seven stage process. The stages in this process are 6 piece pie chart, 6 segment pie chart, 6 parts pie chart.

Data Comparison And Analysis Chart Ppt Powerpoint Presentation File Background Images
This is a data comparison and analysis chart ppt powerpoint presentation file background images. This is a four stage process. The stages in this process are data presentation, content presentation, information presentation.

8 Sections Pie Chart For Data Comparison Ppt PowerPoint Presentation Show Slideshow
This is a 8 sections pie chart for data comparison ppt powerpoint presentation show slideshow. This is a eight stage process. The stages in this process are 6 piece pie chart, 6 segment pie chart, 6 parts pie chart.
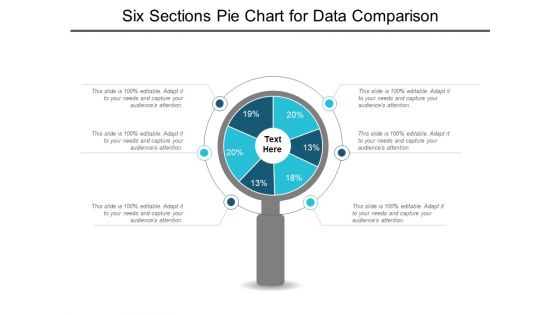
Six Sections Pie Chart For Data Comparison Ppt PowerPoint Presentation Styles Graphics Example
This is a six sections pie chart for data comparison ppt powerpoint presentation styles graphics example. This is a six stage process. The stages in this process are 6 piece pie chart, 6 segment pie chart, 6 parts pie chart.
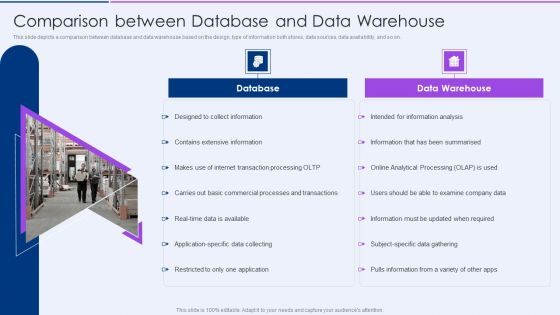
Executive Information Database System Comparison Between Database And Data Warehouse Guidelines PDF
This slide depicts a comparison between database and data warehouse based on the design, type of information both stores, data sources, data availability, and so on.Deliver and pitch your topic in the best possible manner with this Executive Information Database System Comparison Between Database And Data Warehouse Guidelines PDF. Use them to share invaluable insights on Extensive Information, Internet Transaction, Commercial Processes and impress your audience. This template can be altered and modified as per your expectations. So, grab it now.

Big Data And Analytics Market Share And Earnings Comparison Matrix Elements PDF
This slide covers big data revenue comparison for two years. It also includes growth rate and market share of leading vendors to analyse its market position. Persuade your audience using this Big Data And Analytics Market Share And Earnings Comparison Matrix Elements PDF. This PPT design covers five stages, thus making it a great tool to use. It also caters to a variety of topics including Revenue, Growth Rate, Market Share. Download this PPT design now to present a convincing pitch that not only emphasizes the topic but also showcases your presentation skills.

Comparison Between Data Warehouse And Operational Database System ODS Infographics PDF
This slide depicts the comparison between data warehouse and operational database systems based on design, purpose, data storage orientation, performance, and so on.Deliver and pitch your topic in the best possible manner with this Comparison Between Data Warehouse And Operational Database System ODS Infographics PDF. Use them to share invaluable insights on Concerned Information, Analytical Processing, Poor Performance and impress your audience. This template can be altered and modified as per your expectations. So, grab it now.
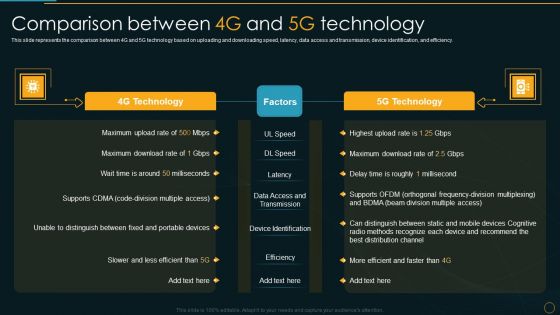
Comparison Between 4G And 5G Technology Comparative Analysis Of 4G And 5G Technologies Ideas PDF
This slide represents the comparison between 4G and 5G technology based on uploading and downloading speed, latency, data access and transmission, device identification, and efficiency.Deliver an awe inspiring pitch with this creative Comparison Between 4G And 5G Technology Comparative Analysis Of 4G And 5G Technologies Ideas PDF bundle. Topics like Unable Distinguish, Distribution Channel, Less Efficient can be discussed with this completely editable template. It is available for immediate download depending on the needs and requirements of the user.

Employee Headcount Analysis Turnover Comparison Of Two Companies Ppt PowerPoint Presentation Infographics Smartart PDF
This slide shows the comparison of two organizations on the basis of headcount turnover. It includes turnover data of last six years. Showcasing this set of slides titled Employee Headcount Analysis Turnover Comparison Of Two Companies Ppt PowerPoint Presentation Infographics Smartart PDF. The topics addressed in these templates are Highest Turnover, Flexible Working, Lowest. All the content presented in this PPT design is completely editable. Download it and make adjustments in color, background, font etc. as per your unique business setting.
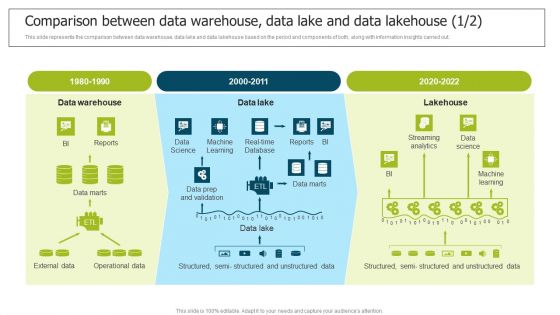
Data Lake Implementation Comparison Between Data Warehouse Data Lake And Data Infographics PDF
This slide represents the comparison between data warehouse, data lake and data lakehouse based on the period and components of both, along with information insights carried out. From laying roadmaps to briefing everything in detail, our templates are perfect for you. You can set the stage with your presentation slides. All you have to do is download these easy-to-edit and customizable templates. Data Lake Implementation Comparison Between Data Warehouse Data Lake And Data Infographics PDF will help you deliver an outstanding performance that everyone would remember and praise you for. Do download this presentation today.

Tools For HR Business Analytics Comparison Between Reporting Type Flow Inspiration PDF
This slide represents the difference between the types of data reporting flow. It includes comparison between traditional BI and self-service BI on the basis of IT setup, agility, data governance, kind of reporting and data. If you are looking for a format to display your unique thoughts, then the professionally designed Tools For HR Business Analytics Comparison Between Reporting Type Flow Inspiration PDF is the one for you. You can use it as a Google Slides template or a PowerPoint template. Incorporate impressive visuals, symbols, images, and other charts. Modify or reorganize the text boxes as you desire. Experiment with shade schemes and font pairings. Alter, share or cooperate with other people on your work. Download Tools For HR Business Analytics Comparison Between Reporting Type Flow Inspiration PDF and find out how to give a successful presentation. Present a perfect display to your team and make your presentation unforgettable.

Engineering Services Company Report Competitor Comparison Ppt PowerPoint Presentation File Professional PDF
The slide highlights the competitor comparison for top competitors. It compares companies on the basis of global market share, revenue, employee count, location served and services offered. There are so many reasons you need a Engineering Services Company Report Competitor Comparison Ppt PowerPoint Presentation File Professional PDF. The first reason is you cant spend time making everything from scratch, Thus, Slidegeeks has made presentation templates for you too. You can easily download these templates from our website easily.

Data Warehousing IT Comparison Between Data Warehouse And Operational Ppt Show Designs PDF
This slide depicts the comparison between data warehouse and operational database systems based on design, purpose, data storage orientation, performance, and so on. Deliver and pitch your topic in the best possible manner with this data warehousing it comparison between data warehouse and operational ppt show designs pdf. Use them to share invaluable insights on data warehouse, analytical, processing, extraction and impress your audience. This template can be altered and modified as per your expectations. So, grab it now.

Quality Cost Report Comparison Template 1 Ppt PowerPoint Presentation Pictures Infographics
This is a quality cost report comparison template 1 ppt powerpoint presentation pictures infographics. This is a five stage process. The stages in this process are amount, percent, year, appraisal cost, prevention cost.
Chart Illustrating Two Year Comparison Of Business Data Icon Ppt Outline Example Topics PDF
Persuade your audience using this Chart Illustrating Two Year Comparison Of Business Data Icon Ppt Outline Example Topics PDF. This PPT design covers three stages, thus making it a great tool to use. It also caters to a variety of topics including chart illustrating two year comparison of business data icon. Download this PPT design now to present a convincing pitch that not only emphasizes the topic but also showcases your presentation skills.

Companys Financial Comparison Before And After Implementation Of Promotional Strategies Infographics PDF
This slide shows the comparison of companys performance before and after the product marketing strategy implementation. It shows the comparison based on parameters such as product demand, number of product sold, total sale, lead conversion rate, customer retention rate, per customer acquisition cost etc. If you are looking for a format to display your unique thoughts, then the professionally designed Companys Financial Comparison Before And After Implementation Of Promotional Strategies Infographics PDF is the one for you. You can use it as a Google Slides template or a PowerPoint template. Incorporate impressive visuals, symbols, images, and other charts. Modify or reorganize the text boxes as you desire. Experiment with shade schemes and font pairings. Alter, share or cooperate with other people on your work. Download Companys Financial Comparison Before And After Implementation Of Promotional Strategies Infographics PDF and find out how to give a successful presentation. Present a perfect display to your team and make your presentation unforgettable.
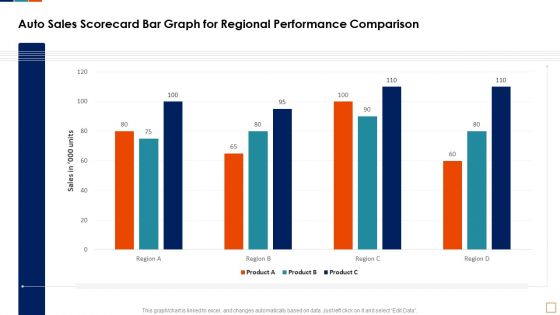
Auto Sales Scorecard Bar Graph For Regional Performance Comparison Infographics PDF
This graph or chart is linked to excel, and changes automatically based on data. Just left click on it and select Edit Data. Deliver an awe inspiring pitch with this creative Auto Sales Scorecard Bar Graph For Regional Performance Comparison Infographics PDF bundle. Topics like Auto Sales Scorecard, Bar Graph Regional, Performance Comparison Product can be discussed with this completely editable template. It is available for immediate download depending on the needs and requirements of the user.

Two Product Comparison Report With Price And Hardware Ppt PowerPoint Presentation Gallery Graphics Pictures PDF
Pitch your topic with ease and precision using this two product comparison report with price and hardware ppt powerpoint presentation gallery graphics pictures pdf. This layout presents information on two product comparison report with price and hardware. It is also available for immediate download and adjustment. So, changes can be made in the color, design, graphics or any other component to create a unique layout.

Comparison Between Data Warehouse Data Lake And Data Lakehouse Information PDF
This slide represents the comparison between data warehouse, data lake and data lakehouse based on the period and components of both, along with information insights carried out. Boost your pitch with our creative Comparison Between Data Warehouse Data Lake And Data Lakehouse Information PDF. Deliver an awe inspiring pitch that will mesmerize everyone. Using these presentation templates you will surely catch everyones attention. You can browse the ppts collection on our website. We have researchers who are experts at creating the right content for the templates. So you do not have to invest time in any additional work. Just grab the template now and use them.

Retail Outlet Operational Efficiency Analytics HR Software Systems Comparison For Workforce Infographics PDF
This slide provides information regarding the HR systems comparison for workforce planning at retail store. It covers details regarding software name, cost and task supported. Deliver and pitch your topic in the best possible manner with this Retail Outlet Operational Efficiency Analytics HR Software Systems Comparison For Workforce Infographics PDF. Use them to share invaluable insights on Performance Management, Task Management, Absence Management and impress your audience. This template can be altered and modified as per your expectations. So, grab it now.
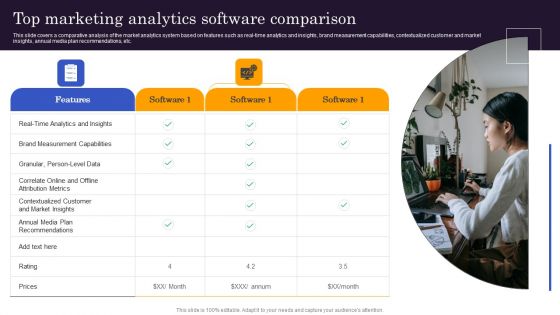
Marketers Guide To Data Analysis Optimization Top Marketing Analytics Software Comparison Pictures PDF
This slide covers a comparative analysis of the market analytics system based on features such as real-time analytics and insights, brand measurement capabilities, contextualized customer and market insights, annual media plan recommendations, etc. Create an editable Marketers Guide To Data Analysis Optimization Top Marketing Analytics Software Comparison Pictures PDF that communicates your idea and engages your audience. Whether youre presenting a business or an educational presentation, pre designed presentation templates help save time. Marketers Guide To Data Analysis Optimization Top Marketing Analytics Software Comparison Pictures PDF is highly customizable and very easy to edit, covering many different styles from creative to business presentations. Slidegeeks has creative team members who have crafted amazing templates. So, go and get them without any delay.
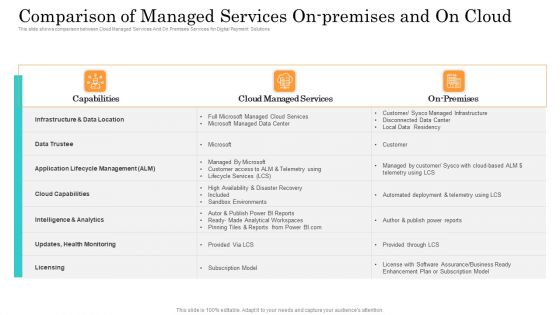
Online Payment Service Comparison Of Managed Services On Premises And On Cloud Infographics PDF
This slide shows comparison between Cloud Managed Services And On Premises Services for Digital Payment Solutions. Deliver and pitch your topic in the best possible manner with this online payment service comparison of managed services on premises and on cloud infographics pdf. Use them to share invaluable insights on data location, cloud capabilities, infrastructure intelligence analytics and impress your audience. This template can be altered and modified as per your expectations. So, grab it now.

5G And 4G Networks Comparative Analysis Comparison Between 4G And 5G Technology Diagrams PDF
This slide represents the comparison between 4G and 5G technology based on uploading and downloading speed, latency, data access and transmission, device identification, and efficiency. This is a 5G And 4G Networks Comparative Analysis Comparison Between 4G And 5G Technology Diagrams PDF template with various stages. Focus and dispense information on two stages using this creative set, that comes with editable features. It contains large content boxes to add your information on topics like 4G Technology, 5G Technology. You can also showcase facts, figures, and other relevant content using this PPT layout. Grab it now.
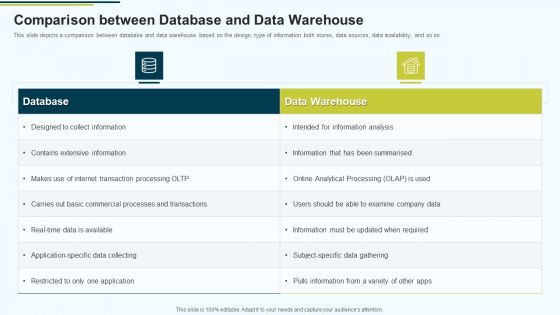
MIS Comparison Between Database And Data Warehouse Ppt PowerPoint Presentation Slides Vector PDF
This slide depicts a comparison between database and data warehouse based on the design, type of information both stores, data sources, data availability, and so on.Deliver and pitch your topic in the best possible manner with this MIS Comparison Between Database And Data Warehouse Ppt PowerPoint Presentation Slides Vector PDF Use them to share invaluable insights on Designed To Collect Information, Contains Extensive Information, Internet Transaction Processing and impress your audience. This template can be altered and modified as per your expectations. So, grab it now.

Data Governance IT Comparison Between Data Governance And Data Stewardship Summary PDF
This slide represents the comparison between data governance and data stewardship however, both are interconnected. Data governance describes the policies and regulations for data and data stewardship implements those policies in the organization. There are so many reasons you need a Data Governance IT Comparison Between Data Governance And Data Stewardship Summary PDF. The first reason is you can not spend time making everything from scratch, Thus, Slidegeeks has made presentation templates for you too. You can easily download these templates from our website easily.

Data Warehousing IT Comparison Between Database And Data Warehouse Ppt Model Show PDF
This slide depicts a comparison between database and data warehouse based on the design, type of information both stores, data sources, data availability, and so on. Presenting data warehousing it comparison between database and data warehouse ppt model show pdf to provide visual cues and insights. Share and navigate important information on two stages that need your due attention. This template can be used to pitch topics like database, data warehouse. In addtion, this PPT design contains high resolution images, graphics, etc, that are easily editable and available for immediate download.
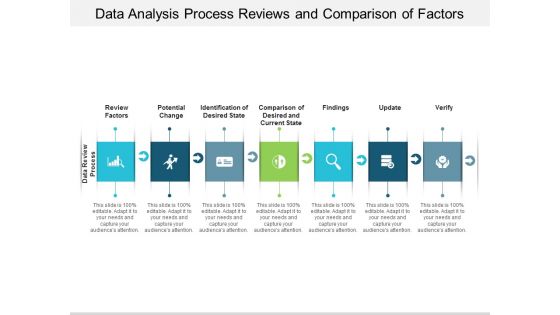
Data Analysis Process Reviews And Comparison Of Factors Ppt PowerPoint Presentation Pictures Visuals
Presenting this set of slides with name data analysis process reviews and comparison of factors ppt powerpoint presentation pictures visuals. This is a seven stage process. The stages in this process are Data analysis, Data Review, Data Evaluation. This is a completely editable PowerPoint presentation and is available for immediate download. Download now and impress your audience.
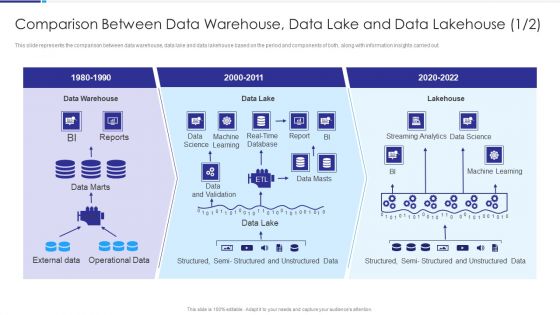
Comparison Between Data Warehouse Data Lake And Data Lakehouse Pictures PDF
This slide represents the comparison between data warehouse, data lake and data lakehouse based on the period and components of both, along with information insights carried out. This is a Comparison Between Data Warehouse Data Lake And Data Lakehouse Pictures PDF template with various stages. Focus and dispense information on one stages using this creative set, that comes with editable features. It contains large content boxes to add your information on topics like Data Warehouse, Data Lake, Lakehouse, External Data, Operational Data. You can also showcase facts, figures, and other relevant content using this PPT layout. Grab it now.

Business Segments Revenue Earning Comparison Financial Performance Report Of Software Firm Topics PDF
The following slide shows the comparison of the revenue share by business segments of a software company. It includes services and solutions revenue share for 2019 and 2023 along with key insights. There are so many reasons you need a Business Segments Revenue Earning Comparison Financial Performance Report Of Software Firm Topics PDF. The first reason is you can not spend time making everything from scratch, Thus, Slidegeeks has made presentation templates for you too. You can easily download these templates from our website easily.
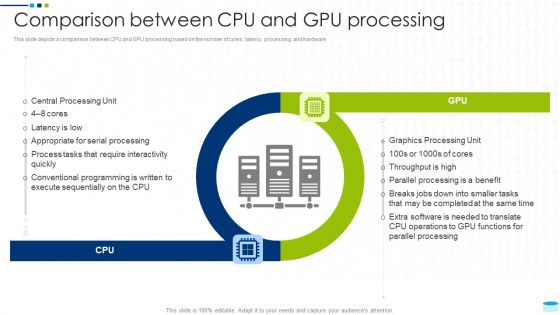
Data Center Infrastructure Management IT Comparison Between CPU And GPU Processing Rules PDF
This slide depicts a comparison between CPU and GPU processing based on the number of cores, latency, processing, and hardware. Presenting data center infrastructure management it comparison between cpu and gpu processing rules pdf to provide visual cues and insights. Share and navigate important information on two stages that need your due attention. This template can be used to pitch topics like central processing unit, graphics processing unit. In addtion, this PPT design contains high resolution images, graphics, etc, that are easily editable and available for immediate download.
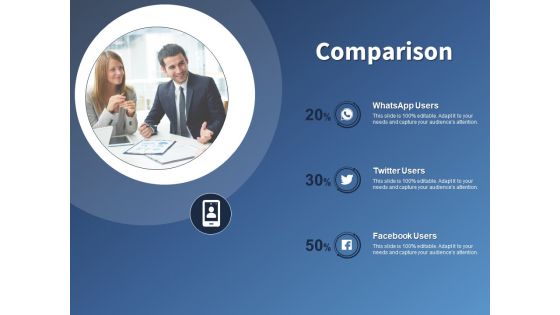
Performance Assessment And Sales Initiative Report Comparison Ppt Infographics Designs PDF
Presenting this set of slides with name performance assessment and sales initiative report comparison ppt infographics designs pdf. This is a three stage process. The stages in this process are whatsapp users, twitter users, facebook users. This is a completely editable PowerPoint presentation and is available for immediate download. Download now and impress your audience.
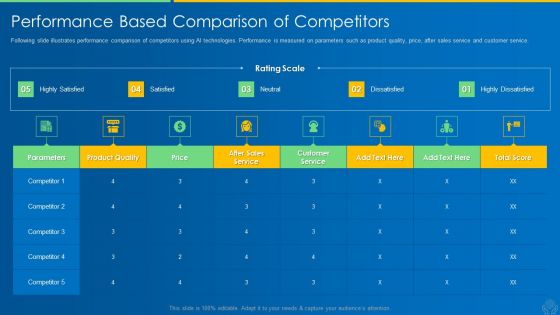
AI And ML Driving Monetary Value For Organization Performance Based Comparison Of Competitors Infographics PDF
Following slide illustrates performance comparison of competitors using AI technologies. Performance is measured on parameters such as product quality, price, after sales service and customer service. Deliver an awe inspiring pitch with this creative ai and ml driving monetary value for organization performance based comparison of competitors infographics pdf bundle. Topics like parameters, product quality, price, after sales service, customer service can be discussed with this completely editable template. It is available for immediate download depending on the needs and requirements of the user.

Management Information System Comparison Between Database And Data Warehouse Guidelines PDF
This slide depicts a comparison between database and data warehouse based on the design, type of information both stores, data sources, data availability, and so on.This is a Management Information System Comparison Between Database And Data Warehouse Guidelines PDF template with various stages. Focus and dispense information on two stages using this creative set, that comes with editable features. It contains large content boxes to add your information on topics like Analytical Processing, Data Collecting, Commercial Processes. You can also showcase facts, figures, and other relevant content using this PPT layout. Grab it now.

 Home
Home