Quarter Comparison

Quarterly Comparison Of Business Current And Target Milestones Themes PDF
This slide shows quarterly assessment of set and achieved target to find the reason for deviation between both. It comprises of targeted and achieved data of different quarters. Showcasing this set of slides titled Quarterly Comparison Of Business Current And Target Milestones Themes PDF. The topics addressed in these templates are Quarter Target, Target, Achieved. All the content presented in this PPT design is completely editable. Download it and make adjustments in color, background, font etc. as per your unique business setting.
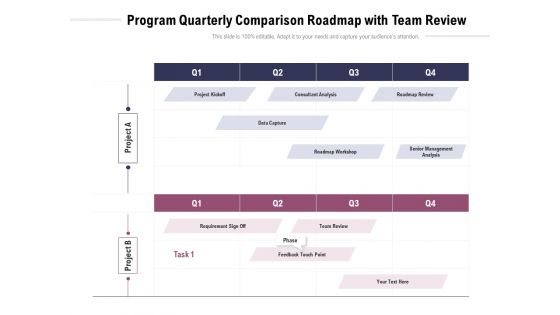
Program Quarterly Comparison Roadmap With Team Review Microsoft
We present our program quarterly comparison roadmap with team review microsoft. This PowerPoint layout is easy to edit so you can change the font size, font type, color, and shape conveniently. In addition to this, the PowerPoint layout is Google Slides compatible, so you can share it with your audience and give them access to edit it. Therefore, download and save this well researched program quarterly comparison roadmap with team review microsoft in different formats like PDF, PNG, and JPG to smoothly execute your business plan.
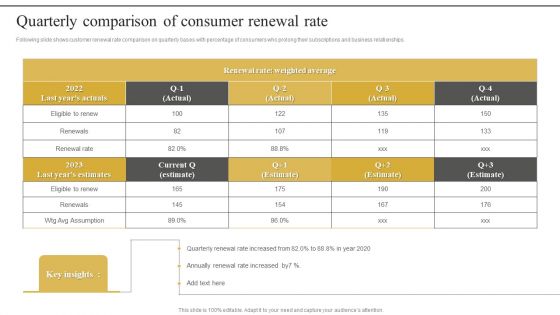
Quarterly Comparison Of Consumer Renewal Rate Guidelines PDF
Following slide shows customer renewal rate comparison on quarterly bases with percentage of consumers who prolong their subscriptions and business relationships. Pitch your topic with ease and precision using this Quarterly Comparison Of Consumer Renewal Rate Guidelines PDF. This layout presents information on Quarterly Renewal Rate, Consumer Renewal Rate. It is also available for immediate download and adjustment. So, changes can be made in the color, design, graphics or any other component to create a unique layout.
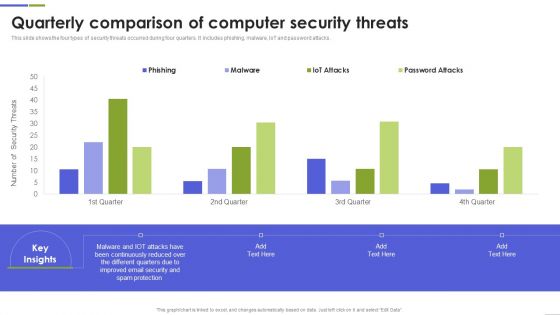
Quarterly Comparison Of Computer Security Threats Mockup PDF
This slide shows the four types of security threats occurred during four quarters. It includes phishing, malware, IoT and password attacks. Pitch your topic with ease and precision using this Quarterly Comparison Of Computer Security Threats Mockup PDF This layout presents information on Continuously Reduced, Different Quarters, Spam Protection It is also available for immediate download and adjustment. So, changes can be made in the color, design, graphics or any other component to create a unique layout.
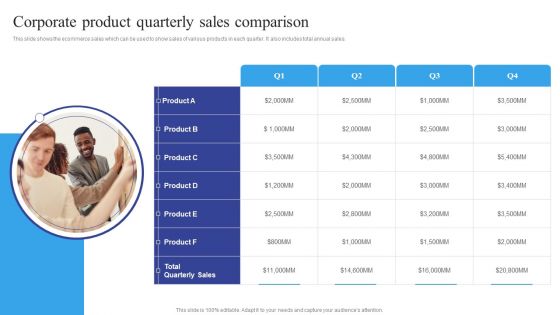
Corporate Product Quarterly Sales Comparison Structure PDF
This slide shows the ecommerce sales which can be used to show sales of various products in each quarter. It also includes total annual sales. Presenting Corporate Product Quarterly Sales Comparison Structure PDF to dispense important information. This template comprises One stage. It also presents valuable insights into the topics including Corporate Product, Quarterly Sales Comparison. This is a completely customizable PowerPoint theme that can be put to use immediately. So, download it and address the topic impactfully.

Quarterly Comparison Of Security For Cloud Based Systems Threats Infographics PDF
This slide shows the various types of cloud security threats occurred during four quarters. It includes phishing, malware, IoT and password attacks. Pitch your topic with ease and precision using this Quarterly Comparison Of Security For Cloud Based Systems Threats Infographics PDF. This layout presents information on Quarterly Comparison Of Security, Cloud Based Systems Threats. It is also available for immediate download and adjustment. So, changes can be made in the color, design, graphics or any other component to create a unique layout.
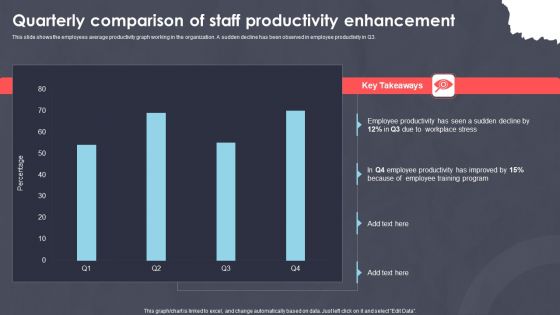
Quarterly Comparison Of Staff Productivity Enhancement Ppt PowerPoint Presentation Ideas Aids PDF
This slide shows the employees average productivity graph working in the organization. A sudden decline has been observed in employee productivity in Q3. Showcasing this set of slides titled Quarterly Comparison Of Staff Productivity Enhancement Ppt PowerPoint Presentation Ideas Aids PDF. The topics addressed in these templates are Employee Productivity, Sudden Decline, Workplace Stress. All the content presented in this PPT design is completely editable. Download it and make adjustments in color, background, font etc. as per your unique business setting.
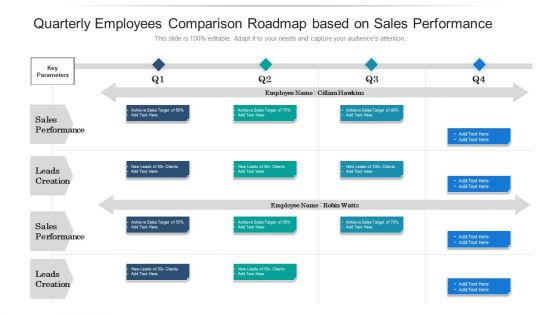
Quarterly Employees Comparison Roadmap Based On Sales Performance Slides
We present our quarterly employees comparison roadmap based on sales performance slides. This PowerPoint layout is easy to edit so you can change the font size, font type, color, and shape conveniently. In addition to this, the PowerPoint layout is Google Slides compatible, so you can share it with your audience and give them access to edit it. Therefore, download and save this well researched quarterly employees comparison roadmap based on sales performance slides in different formats like PDF, PNG, and JPG to smoothly execute your business plan.
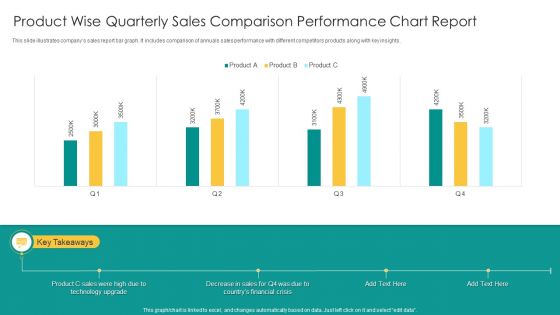
Product Wise Quarterly Sales Comparison Performance Chart Report Infographics PDF
This slide illustrates companys sales report bar graph. It includes comparison of annuals sales performance with different competitors products along with key insights. Showcasing this set of slides titled Product Wise Quarterly Sales Comparison Performance Chart Report Infographics PDF. The topics addressed in these templates are Product C Sales, Technology Upgrade, Financial Crisis. All the content presented in this PPT design is completely editable. Download it and make adjustments in color, background, font etc. as per your unique business setting.

Quarterly Product Comparison Roadmap Based On Multiple Release Versions Sample
Presenting our jaw dropping quarterly product comparison roadmap based on multiple release versions sample. You can alternate the color, font size, font type, and shapes of this PPT layout according to your strategic process. This PPT presentation is compatible with Google Slides and is available in both standard screen and widescreen aspect ratios. You can also download this well researched PowerPoint template design in different formats like PDF, JPG, and PNG. So utilize this visually appealing design by clicking the download button given below.

Performance Comparison Across Quarters Ppt Ideas
This is a performance comparison across quarters ppt ideas. This is a four stage process. The stages in this process are pie, growth, percentage, finance, business, marketing.
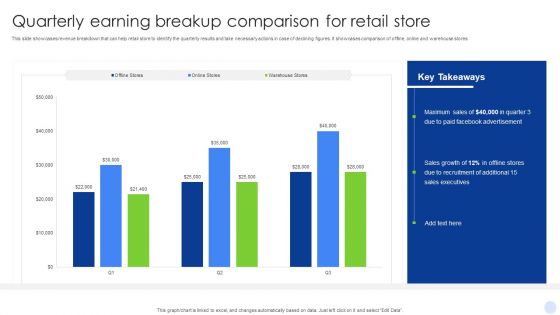
Quarterly Earning Breakup Comparison For Retail Store Portrait PDF
Pitch your topic with ease and precision using this Quarterly Earning Breakup Comparison For Retail Store Portrait PDF. This layout presents information on Earning Breakup Comparison, Retail Store. It is also available for immediate download and adjustment. So, changes can be made in the color, design, graphics or any other component to create a unique layout.
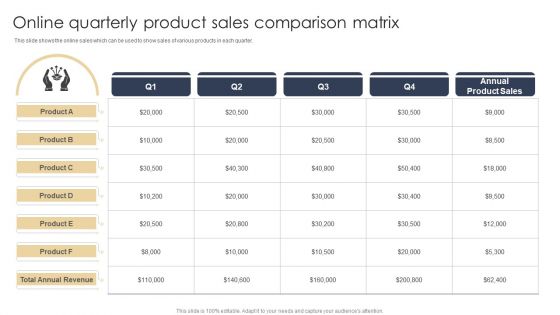
Online Quarterly Product Sales Comparison Matrix Formats PDF
This slide shows the online sales which can be used to show sales of various products in each quarter. Showcasing this set of slides titled Online Quarterly Product Sales Comparison Matrix Formats PDF. The topics addressed in these templates are Product, Revenue, Sales. All the content presented in this PPT design is completely editable. Download it and make adjustments in color, background, font etc. as per your unique business setting.

Quarterly IT Products Comparison Roadmap Based On Compatibility Mode Download
Presenting our innovatively structured quarterly it products comparison roadmap based on compatibility mode download Template. Showcase your roadmap process in different formats like PDF, PNG, and JPG by clicking the download button below. This PPT design is available in both Standard Screen and Widescreen aspect ratios. It can also be easily personalized and presented with modified font size, font type, color, and shapes to measure your progress in a clear way.
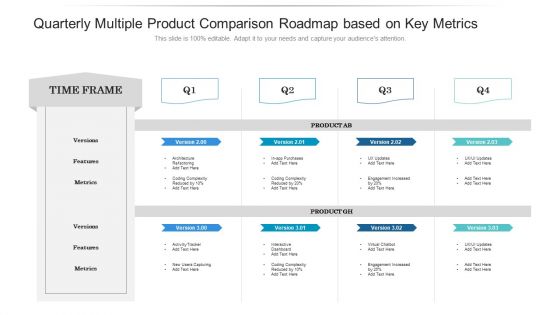
Quarterly Multiple Product Comparison Roadmap Based On Key Metrics Structure
Introducing our quarterly multiple product comparison roadmap based on key metrics structure. This PPT presentation is Google Slides compatible, therefore, you can share it easily with the collaborators for measuring the progress. Also, the presentation is available in both standard screen and widescreen aspect ratios. So edit the template design by modifying the font size, font type, color, and shapes as per your requirements. As this PPT design is fully editable it can be presented in PDF, JPG and PNG formats.

Quarterly Organizational Service Comparison Roadmap With Package Details Mockup
Presenting the quarterly organizational service comparison roadmap with package details mockup. The template includes a roadmap that can be used to initiate a strategic plan. Not only this, the PowerPoint slideshow is completely editable and you can effortlessly modify the font size, font type, and shapes according to your needs. This PPT slide can be easily reached in standard screen and widescreen aspect ratios. The set is also available in various formats like PDF, PNG, and JPG. So download and use it multiple times as per your knowledge.

Line Chart For Quarterly Performance Comparison Ppt PowerPoint Presentation Layouts Slide Download
Presenting this set of slides with name line chart for quarterly performance comparison ppt powerpoint presentation layouts slide download. The topics discussed in these slides are met, missed, exceeded. This is a completely editable PowerPoint presentation and is available for immediate download. Download now and impress your audience.

Quarterly Sales Comparison Of Various Beauty Care Products Ppt Professional Information PDF
This slide shows the comparative analysis of sales of various products in each quarter. It includes products such as hair conditioner, face primer, eyeliner, deodorant, etc. Presenting Quarterly Sales Comparison Of Various Beauty Care Products Ppt Professional Information PDF to dispense important information. This template comprises three stages. It also presents valuable insights into the topics including Hair Conditioner, Product, Annual Product Sales. This is a completely customizable PowerPoint theme that can be put to use immediately. So, download it and address the topic impactfully.
Four Quarter Milestone Plan Comparison Ppt PowerPoint Presentation Icon Diagrams PDF
Presenting four quarter milestone plan comparison ppt powerpoint presentation icon diagrams pdf to provide visual cues and insights. Share and navigate important information on two stages that need your due attention. This template can be used to pitch topics like comparison, male, female. In addtion, this PPT design contains high-resolution images, graphics, etc, that are easily editable and available for immediate download.
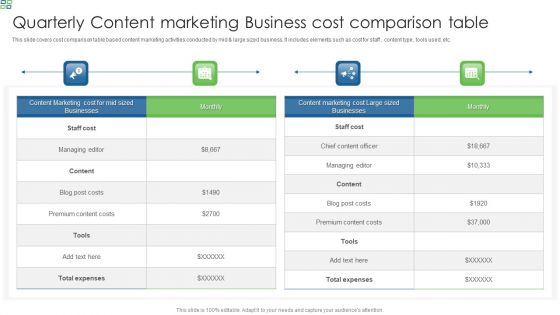
Quarterly Content Marketing Business Cost Comparison Table Topics PDF
This slide covers cost comparison table based content marketing activities conducted by mid and large sized business. It includes elements such as cost for staff , content type, tools used, etc. Showcasing this set of slides titled Quarterly Content Marketing Business Cost Comparison Table Topics PDF. The topics addressed in these templates are Premium Content Costs, Staff Cost, Content Marketing. All the content presented in this PPT design is completely editable. Download it and make adjustments in color, background, font etc. as per your unique business setting.
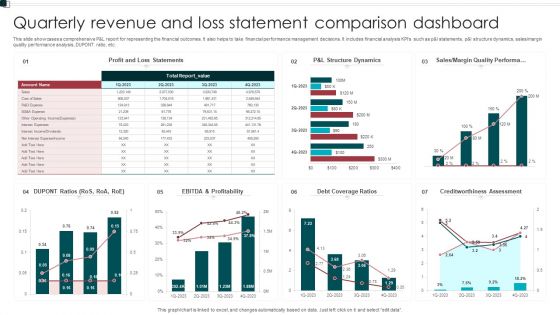
Quarterly Revenue And Loss Statement Comparison Dashboard Portrait PDF
This slide showcases a comprehensive P and L report for representing the financial outcomes. It also helps to take financial performance management decisions. It includes financial analysis KPIs such as p and l statements, p and l structure dynamics, sales or margin quality performance analysis, DUPONT ratio, etc. Showcasing this set of slides titled Quarterly Revenue And Loss Statement Comparison Dashboard Portrait PDF. The topics addressed in these templates are Profitability, Debt Coverage Ratios, Margin Quality Performa. All the content presented in this PPT design is completely editable. Download it and make adjustments in color, background, font etc. as per your unique business setting.

Quarterly Workforce Increase Comparison Of Various Departments Ppt Gallery Professional PDF
This slide shows department wise increase in employees headcount of in various quarters. It includes departments such as marketing, finance, research, HR, sales, etc. Showcasing this set of slides titled Quarterly Workforce Increase Comparison Of Various Departments Ppt Gallery Professional PDF. The topics addressed in these templates are Department, Marketing, Finance. All the content presented in this PPT design is completely editable. Download it and make adjustments in color, background, font etc. as per your unique business setting.
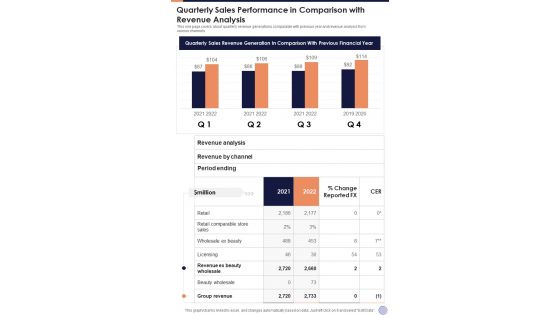
Quarterly Sales Performance In Comparison With Revenue Analysis One Pager Documents
This one page covers about quarterly revenue generations comparable with previous year and revenue analysis from various channels. Presenting you an exemplary Quarterly Sales Performance In Comparison With Revenue Analysis One Pager Documents. Our one-pager comprises all the must-have essentials of an inclusive document. You can edit it with ease, as its layout is completely editable. With such freedom, you can tweak its design and other elements to your requirements. Download this Quarterly Sales Performance In Comparison With Revenue Analysis One Pager Documents brilliant piece now.

Quarterly Staff Productivity Enhancement Comparison Ppt PowerPoint Presentation Show Themes PDF
This slide shows the staff productivity enhancement in each quarter. It highlights employee with the highest as well as lowest productivity.Pitch your topic with ease and precision using this Quarterly Staff Productivity Enhancement Comparison Ppt PowerPoint Presentation Show Themes PDF. This layout presents information on Productivity Employee, Because Successful, Completion Training. It is also available for immediate download and adjustment. So, changes can be made in the color, design, graphics or any other component to create a unique layout.

Quarterly Sales Performance Of Business Comparison With Key Insight Guidelines PDF
This slide gives statistics of period-on-period sales analysis to review the current performance of organization and gradual progress. It includes data across two years with key insights. Showcasing this set of slides titled Quarterly Sales Performance Of Business Comparison With Key Insight Guidelines PDF. The topics addressed in these templates are Quarterly Sales Performance, Business Comparison, Key Insight. All the content presented in this PPT design is completely editable. Download it and make adjustments in color, background, font etc. as per your unique business setting.

Quarterly Cost Of Goods And Revenue Comparison Of Various Products Microsoft PDF
This slide shows the revenue generated in four quarters along with cost of sales of three products of a company.Presenting Quarterly Cost Of Goods And Revenue Comparison Of Various Products Microsoft PDF to dispense important information. This template comprises one stage. It also presents valuable insights into the topics including Sales Revenue, Cost Sales, Sales Revenue. This is a completely customizable PowerPoint theme that can be put to use immediately. So, download it and address the topic impactfully.

Quarterly Budget Analysis Of Business Organization Comparison Of Key Outsourcing Brochure PDF
This slide compares the multiple outsource digital marketing agencies on the basis of multiple parameters such as services offered, amount charged, digital marketing experience, reputation, key clients and number of employees.Deliver and pitch your topic in the best possible manner with this Quarterly Budget Analysis Of Business Organization Comparison Of Key Outsourcing Brochure PDF Use them to share invaluable insights on Comparison Parameters, Digital Marketing Experience, Social Media Marketing and impress your audience. This template can be altered and modified as per your expectations. So, grab it now.

Quarterly Paid Advertisement Actual And Budgeted Cost Comparison Table Portrait PDF
This slide showcases the variance table for social media ad budget and actual cost. It also includes the different types of costs such as social media influencer advertisement, owned media, YouTube video advertising, Facebook advertising, etc.Take your projects to the next level with our ultimate collection of Quarterly Paid Advertisement Actual And Budgeted Cost Comparison Table Portrait PDF. Slidegeeks has designed a range of layouts that are perfect for representing task or activity duration, keeping track of all your deadlines at a glance. Tailor these designs to your exact needs and give them a truly corporate look with your own brand colors they Will make your projects stand out from the rest.

Quarterly Budget Analysis Of Business Organization Detailed Cost Comparison Marketing Ideas PDF
The purpose of this slide is to showcase the detailed cost comparison of hiring a digital marketing specialist vs outsourcing a marketing agency. It also provides information regarding the yearly total expenditure and yearly total compensation that will be incurred by the company.Deliver and pitch your topic in the best possible manner with this Quarterly Budget Analysis Of Business Organization Detailed Cost Comparison Marketing Ideas PDF Use them to share invaluable insights on Outsource To Digital, Marketing Specialist, Marketing Agency and impress your audience. This template can be altered and modified as per your expectations. So, grab it now.
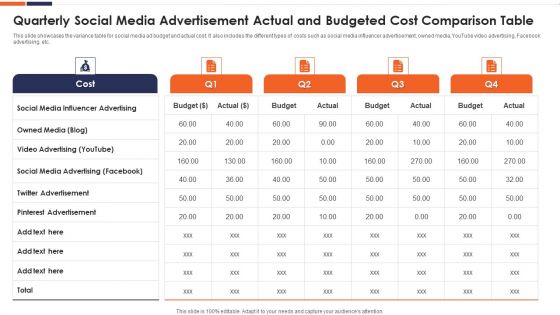
Quarterly Social Media Advertisement Actual And Budgeted Cost Comparison Table Ppt Layouts Outline PDF
This slide showcases the variance table for social media ad budget and actual cost. It also includes the different types of costs such as social media influencer advertisement, owned media, YouTube video advertising, Facebook advertising, etc. Showcasing this set of slides titled quarterly social media advertisement actual and budgeted cost comparison table ppt layouts outline pdf. The topics addressed in these templates are social media influencer advertising, owned media, video advertising. All the content presented in this PPT design is completely editable. Download it and make adjustments in color, background, font etc. as per your unique business setting.

Quarterly Sales Performance Of Business Dashboard With Region And Product Wise Comparison Guidelines PDF
This slide displays sales analysis for different products and regions in each quarter. t also includes inter year comparisons. Pitch your topic with ease and precision using this Quarterly Sales Performance Of Business Dashboard With Region And Product Wise Comparison Guidelines PDF. This layout presents information on Product Wise Quarterly Sales, Comparison. It is also available for immediate download and adjustment. So, changes can be made in the color, design, graphics or any other component to create a unique layout.
Two Quarter Restructure Production Budget Icons PDF
This slide covers the revisions in budget of the production company in every quarter to gain profit and avoid unnecessary expenses during the process. It shows how from the Q1 the company has improved after revising the budget and has being making profits in Q4. Pitch your topic with ease and precision using this Two Quarter Restructure Production Budget Icons PDF. This layout presents information on Actual Budget, Revised Budget, Expenses. It is also available for immediate download and adjustment. So, changes can be made in the color, design, graphics or any other component to create a unique layout.

Quarterly Budget Analysis Of Business Organization Upcoming Quarter Budget Template PDF
The purpose of this slide is to showcase the impact of hiring a digital agency on the marketing department budget. It provides information regarding the increase or decrease in the amount allocated for offline and digital marketing and PR activities.Deliver an awe inspiring pitch with this creative Quarterly Budget Analysis Of Business Organization Upcoming Quarter Budget Template PDF bundle. Topics like Offline Marketing, Digital Marketing, Public Relations can be discussed with this completely editable template. It is available for immediate download depending on the needs and requirements of the user.

Three Year Revenues Comparison One Pager Documents
The slide shows the key comparison of revenues generated from projects and services delivered to clients. Presenting you a fantastic Three Year Revenues Comparison One Pager Documents. This piece is crafted on hours of research and professional design efforts to ensure you have the best resource. It is completely editable and its design allow you to rehash its elements to suit your needs. Get this Three Year Revenues Comparison One Pager Documents A4 One-pager now.
Company Annual Revenue Comparison Icon Template PDF
Persuade your audience using this Company Annual Revenue Comparison Icon Template PDF. This PPT design covers three stages, thus making it a great tool to use. It also caters to a variety of topics including Company Annual Revenue, Comparison Icon. Download this PPT design now to present a convincing pitch that not only emphasizes the topic but also showcases your presentation skills.
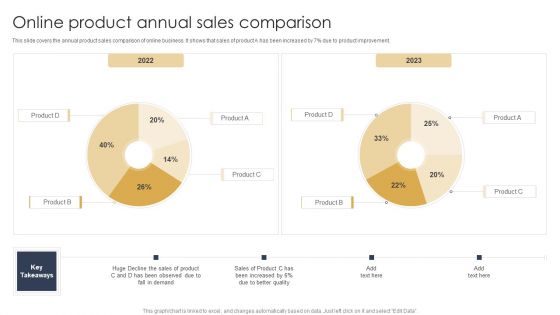
Online Product Annual Sales Comparison Brochure PDF
This slide covers the annual product sales comparison of online business. It shows that sales of product A has been increased by 7 percent due to product improvement. Showcasing this set of slides titled Online Product Annual Sales Comparison Brochure PDF. The topics addressed in these templates are Demand, Sales Of Product, Quality. All the content presented in this PPT design is completely editable. Download it and make adjustments in color, background, font etc. as per your unique business setting.
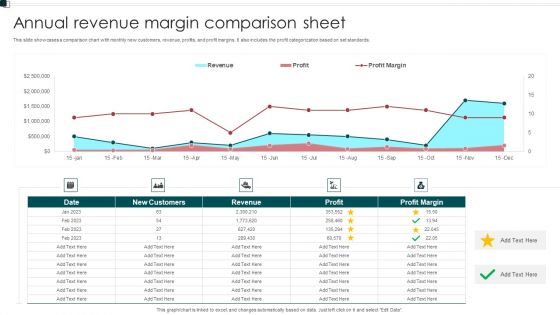
Annual Revenue Margin Comparison Sheet Information PDF
This slide showcases a comparison chart with monthly new customers, revenue, profits, and profit margins. It also includes the profit categorization based on set standards. Showcasing this set of slides titled Annual Revenue Margin Comparison Sheet Information PDF. The topics addressed in these templates are Customers, Revenue, Profit Margin. All the content presented in this PPT design is completely editable. Download it and make adjustments in color, background, font etc. as per your unique business setting.
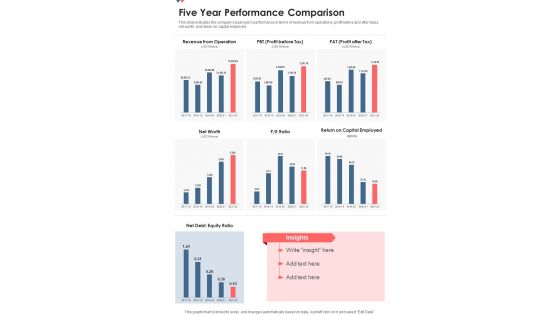
Five Year Performance Comparison One Pager Documents
This slide indicates the companys past years performance in terms of revenue from operations, profit before and after taxes, net worth, and return on capital employed. Presenting you a fantastic Five Year Performance Comparison One Pager Documents. This piece is crafted on hours of research and professional design efforts to ensure you have the best resource. It is completely editable and its design allow you to rehash its elements to suit your needs. Get this Five Year Performance Comparison One Pager Documents A4 One-pager now.

Quarter Wise Corporate Financial Statement Of Startup Company Clipart PDF
This slide shows a quarterly financial report created by a start-up business to show its cash position at the end of each quarter. The key elements include start-up funding, total sales, research expenses, start up costs, patent cost, promotion costs among many others. Showcasing this set of slides titled Quarter Wise Corporate Financial Statement Of Startup Company Clipart PDF. The topics addressed in these templates are Research Expenses, Salaries Benefits, Promotion Costs. All the content presented in this PPT design is completely editable. Download it and make adjustments in color, background, font etc. as per your unique business setting.
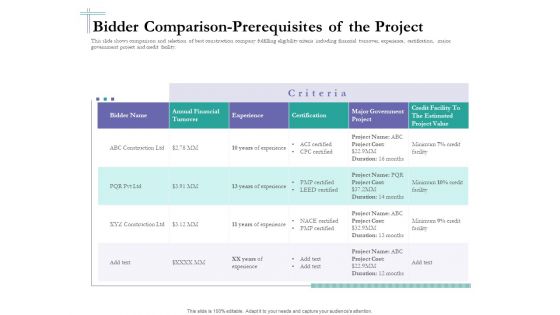
Bidding Cost Comparison Bidder Comparison Prerequisites Of The Project Ppt Slides Display PDF
This slide shows comparison and selection of best construction company fulfilling eligibility criteria including financial turnover, experience, certification, major government project and credit facility. Deliver and pitch your topic in the best possible manner with this Bidding Cost Comparison Bidder Comparison Prerequisites Of The Project Ppt Slides Display PDF. Use them to share invaluable insights on annual financial turnover, experience, certification, major government project and impress your audience. This template can be altered and modified as per your expectations. So, grab it now.
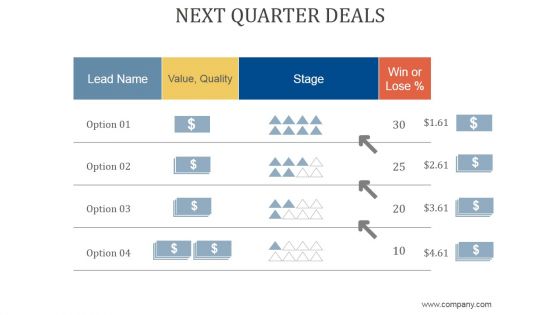
Next Quarter Deals Ppt PowerPoint Presentation Design Templates
This is a next quarter deals ppt powerpoint presentation design templates. This is a four stage process. The stages in this process are business, strategy, marketing, analysis, lead name, value quality.

Cash Position By Quarter Ppt PowerPoint Presentation Outline
This is a cash position by quarter ppt powerpoint presentation outline. This is a four stage process. The stages in this process are cash position, cash in, initial funding, sales, total cash in.
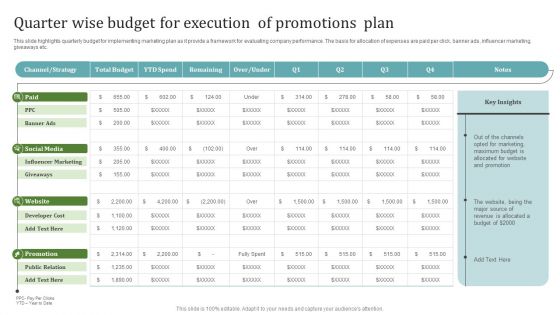
Quarter Wise Budget For Execution Of Promotions Plan Themes PDF
This slide highlights quarterly budget for implementing marketing plan as it provide a framework for evaluating company performance. The basis for allocation of expenses are paid per click, banner ads, influencer marketing, giveaways etc. Showcasing this set of slides titled Quarter Wise Budget For Execution Of Promotions Plan Themes PDF. The topics addressed in these templates are Paid, Social Media, Website, Promotion. All the content presented in this PPT design is completely editable. Download it and make adjustments in color, background, font etc. as per your unique business setting.

Cash Position Analysis For Every Quarter Sample Of Ppt
This is a cash position analysis for every quarter sample of ppt. This is a four stage process. The stages in this process are cash position, initial funding, sales, start up costs, product costs, marketing, fixed costs, principal payments, total cash out.

Graph Showing Total Operation Expenses By Quarter Themes PDF
This slide contains a graph showing the quarter wise operating expenses of an organization that will help the managers or directors of the company to make decisions for the betterment of an organization.Pitch your topic with ease and precision using this Graph Showing Total Operation Expenses By Quarter Themes PDF. This layout presents information on Operating Expenses, Equipment Purchase, Office Expansion. It is also available for immediate download and adjustment. So, changes can be made in the color, design, graphics or any other component to create a unique layout.
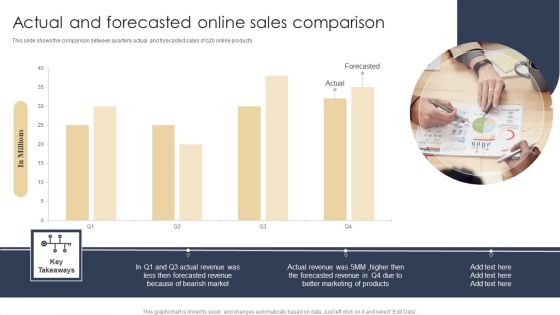
Actual And Forecasted Online Sales Comparison Pictures PDF
This slide shows the comparison between quarterly actual and forecasted sales of b2b online products. Showcasing this set of slides titled Actual And Forecasted Online Sales Comparison Pictures PDF. The topics addressed in these templates are Revenue, Marketing Of Products. All the content presented in this PPT design is completely editable. Download it and make adjustments in color, background, font etc. as per your unique business setting.

Actual And Forecasted Corporate Sales Comparison Brochure PDF
This slide shows the comparison of actual and forecasted sales for each quarter of e-commerce products. Actual sales are less then expected due to poor implementation of strategy. Showcasing this set of slides titled Actual And Forecasted Corporate Sales Comparison Brochure PDF. The topics addressed in these templates are Actual And Forecasted, Corporate Sales Comparison. All the content presented in this PPT design is completely editable. Download it and make adjustments in color, background, font etc. as per your unique business setting.

Year Over Year Revenue Growth Comparison Diagrams PDF
The given slide depicts the year over year comparison of quarterly revenue growth between two years, especially with the sources of revenue in order to track the profitability and incurring losses in the business. Showcasing this set of slides titled Year Over Year Revenue Growth Comparison Diagrams PDF. The topics addressed in these templates are Year Over Year, Revenue Growth, Comparison. All the content presented in this PPT design is completely editable. Download it and make adjustments in color, background, font etc. as per your unique business setting.
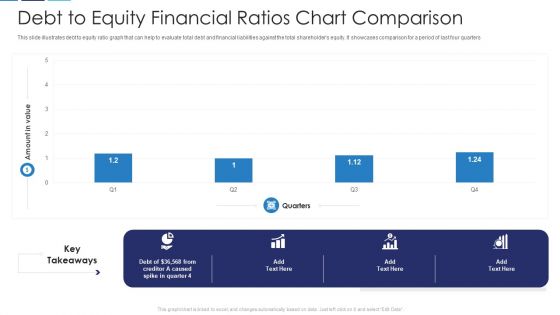
Debt To Equity Financial Ratios Chart Comparison Download PDF
This slide illustrates debt to equity ratio graph that can help to evaluate total debt and financial liabilities against the total shareholders equity. It showcases comparison for a period of last four quarters Pitch your topic with ease and precision using this debt to equity financial ratios chart comparison download pdf. This layout presents information on debt to equity financial ratios chart comparison. It is also available for immediate download and adjustment. So, changes can be made in the color, design, graphics or any other component to create a unique layout.

Salesman Principles Playbook Different Products Price Comparison Chart Slides PDF
This slide provides information regarding product price comparison chart that captures information about price per unit, change over list price, reason for proposed price, volumes sold, forecasted growth. Deliver an awe inspiring pitch with this creative salesman principles playbook different products price comparison chart slides pdf bundle. Topics like weekly updates meets, monthly review meetings, quarterly review meetings can be discussed with this completely editable template. It is available for immediate download depending on the needs and requirements of the user.
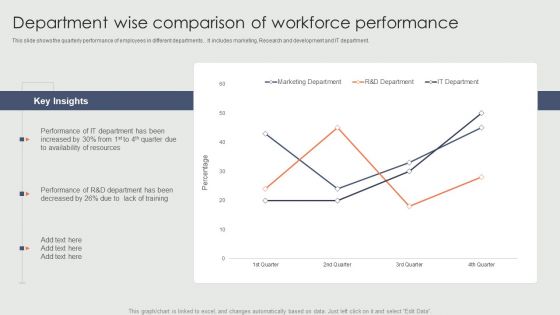
Department Wise Comparison Of Workforce Performance Ppt Summary Portfolio PDF
This slide shows the quarterly performance of employees in different departments. . It includes marketing, Research and development and IT department. Showcasing this set of slides titled Department Wise Comparison Of Workforce Performance Ppt Summary Portfolio PDF. The topics addressed in these templates are Key Insights, Marketing Department, R And D Department. All the content presented in this PPT design is completely editable. Download it and make adjustments in color, background, font etc. as per your unique business setting.
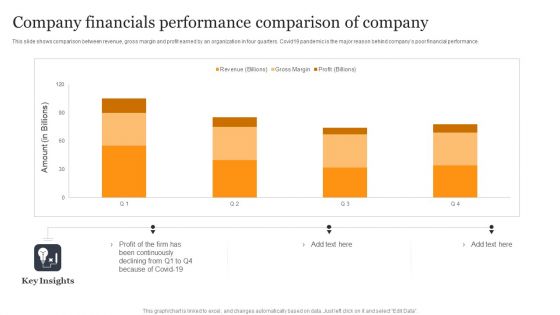
Company Financials Performance Comparison Of Company Microsoft PDF
This slide shows comparison between revenue, gross margin and profit earned by an organization in four quarters. Covid19 pandemic is the major reason behind companys poor financial performance. Showcasing this set of slides titled Company Financials Performance Comparison Of Company Microsoft PDF. The topics addressed in these templates are Been Continuously, Because Covid, Profit Firm. All the content presented in this PPT design is completely editable. Download it and make adjustments in color, background, font etc. as per your unique business setting.
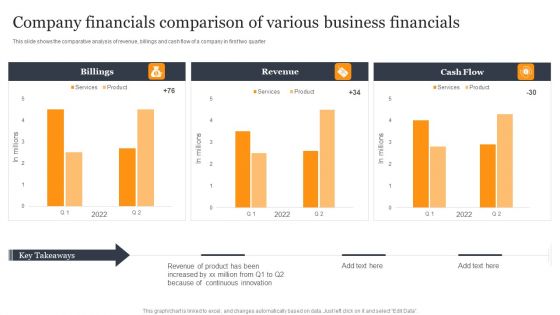
Company Financials Comparison Of Various Business Financials Template PDF
This slide shows the comparative analysis of revenue, billings and cash flow of a company in first two quarter. Pitch your topic with ease and precision using this Company Financials Comparison Of Various Business Financials Template PDF. This layout presents information on Revenue Product, Because Continuous, Been Increased. It is also available for immediate download and adjustment. So, changes can be made in the color, design, graphics or any other component to create a unique layout.

Three Year Revenues Comparison Template 328 One Pager Documents
The slide shows the key comparison of revenues generated from projects and services delivered to clients. Presenting you a fantastic Three Year Revenues Comparison Template 328 One Pager Documents. This piece is crafted on hours of research and professional design efforts to ensure you have the best resource. It is completely editable and its design allow you to rehash its elements to suit your needs. Get this Three Year Revenues Comparison Template 328 One Pager Documents A4 One-pager now.

Annual Sales Capability Comparison And Forecasting Guidelines PDF
This slide illustrates yearly sales comparison of a corporation for evaluating future potential. It includes pipeline, growth rate, conversion rate, total sold units, cost per unit, revenue etc. Showcasing this set of slides titled Annual Sales Capability Comparison And Forecasting Guidelines PDF. The topics addressed in these templates are Annual Sales Capability, Comparison And Forecasting. All the content presented in this PPT design is completely editable. Download it and make adjustments in color, background, font etc. as per your unique business setting.
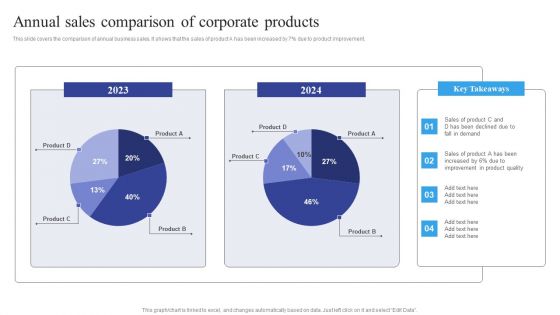
Annual Sales Comparison Of Corporate Products Themes PDF
This slide covers the comparison of annual business sales. It shows that the sales of product A has been increased by 7 percent due to product improvement. Pitch your topic with ease and precision using this Annual Sales Comparison Of Corporate Products Themes PDF. This layout presents information on Annual Sales, Comparison Of Corporate Products. It is also available for immediate download and adjustment. So, changes can be made in the color, design, graphics or any other component to create a unique layout.
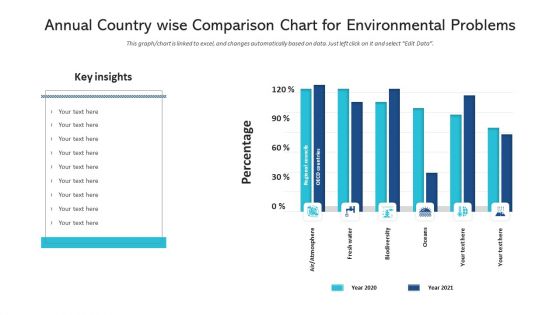
Annual Country Wise Comparison Chart For Environmental Problems Formats PDF
Showcasing this set of slides titled annual country wise comparison chart for environmental problems formats pdf. The topics addressed in these templates are annual country wise comparison chart for environmental problems. All the content presented in this PPT design is completely editable. Download it and make adjustments in color, background, font etc. as per your unique business setting.

Annual Comparison Of Product Earning Breakup Sample PDF
Pitch your topic with ease and precision using this Annual Comparison Of Product Earning Breakup Sample PDF. This layout presents information on Annual Comparison, Product Earning. It is also available for immediate download and adjustment. So, changes can be made in the color, design, graphics or any other component to create a unique layout.
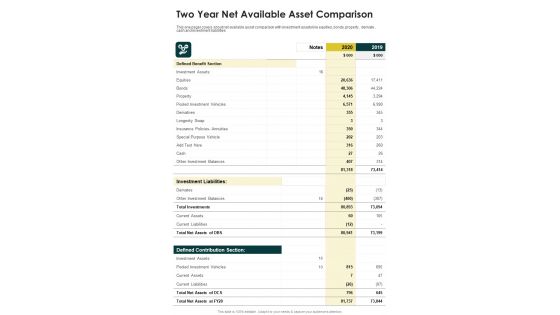
Two Year Net Available Asset Comparison One Pager Documents
This one pager covers about net available asset comparison with investment assets like equities ,bonds, property , derivate , cash and investment liabilities. Presenting you a fantastic Two Year Net Available Asset Comparison One Pager Documents. This piece is crafted on hours of research and professional design efforts to ensure you have the best resource. It is completely editable and its design allow you to rehash its elements to suit your needs. Get this Two Year Net Available Asset Comparison One Pager Documents A4 One-pager now.
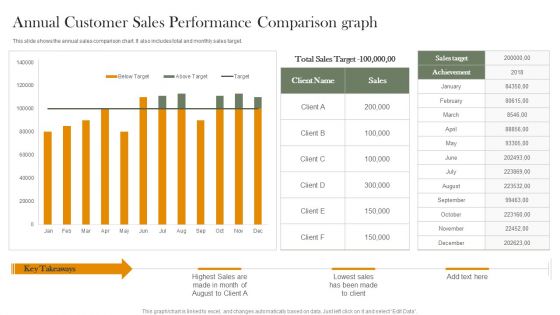
Annual Customer Sales Performance Comparison Graph Portrait PDF
This slide shows the annual sales comparison chart. It also includes total and monthly sales target. Pitch your topic with ease and precision using this Annual Customer Sales Performance Comparison Graph Portrait PDF. This layout presents information on Total Sales Target, Sales Target, Achievement. It is also available for immediate download and adjustment. So, changes can be made in the color, design, graphics or any other component to create a unique layout.

 Home
Home