Performance statistics analysis PowerPoint Presentation Templates and Google Slides
-
Marketing Performance Statistical Analysis Customers And Revenue Report Ppt PowerPoint Presentation Outline Shapes
This is a marketing performance statistical analysis customers and revenue report ppt powerpoint presentation outline shapes. This is a four stage process. The stages in this process are marketing analytics, marketing performance, marketing discovery.
-
Product Life Cycle Key Performance Objectives Statistical Analysis Ppt PowerPoint Presentation Model Example File
This is a product life cycle key performance objectives statistical analysis ppt powerpoint presentation model example file. This is a four stage process. The stages in this process are product life cycle, key performance objectives, statistical analysis.
-
Statistical Analysis For Business Performance Management Ppt PowerPoint Presentation Outline Gridlines PDF
Presenting this set of slides with name statistical analysis for business performance management ppt powerpoint presentation outline gridlines pdf. This is a two stage process. The stages in this process are objectives, approach, productivity of people and resources, excellent customer service, employee attraction and retention, develop milestone, learn from experience, create a deadline. This is a completely editable PowerPoint presentation and is available for immediate download. Download now and impress your audience.
-
Statistical Analysis Of Two Projects Performance Ppt PowerPoint Presentation Show Picture PDF
Presenting this set of slides with name statistical analysis of two projects performance ppt powerpoint presentation show picture pdf. The topics discussed in these slides are statistical analysis of two projects performance, 2020. This is a completely editable PowerPoint presentation and is available for immediate download. Download now and impress your audience.
-
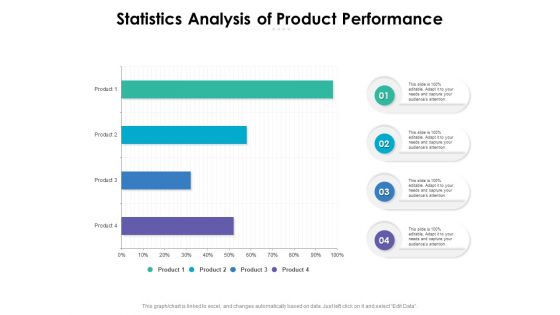
Statistics Analysis Of Product Performance Ppt PowerPoint Presentation Outline Demonstration
Presenting this set of slides with name statistics analysis of product performance ppt powerpoint presentation outline demonstration. The topics discussed in these slide is statistics analysis of product performance. This is a completely editable PowerPoint presentation and is available for immediate download. Download now and impress your audience.
-
International High Performance Statistical Analysis Market Ppt PowerPoint Presentation Icon Template PDF
Pitch your topic with ease and precision using this international high performance statistical analysis market ppt powerpoint presentation icon template pdf. This layout presents information on historic analysis, forecast, customization, dollar in billions, 2014 to 2023. It is also available for immediate download and adjustment. So, changes can be made in the color, design, graphics or any other component to create a unique layout.
-
Statistical Analysis Report Of Employee Performance Icon Ppt PowerPoint Presentation File Gridlines PDF
Pitch your topic with ease and precision using this statistical analysis report of employee performance icon ppt powerpoint presentation file gridlines pdf. This layout presents information on statistical analysis report of employee performance icon. It is also available for immediate download and adjustment. So, changes can be made in the color, design, graphics or any other component to create a unique layout.
-
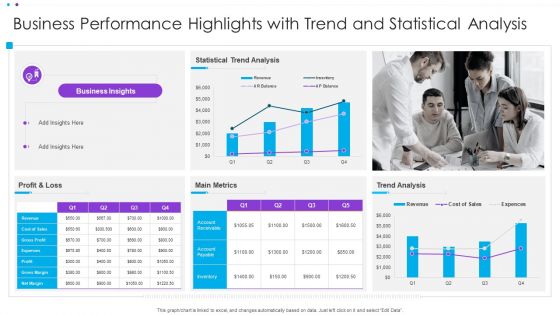
Business Performance Highlights With Trend And Statistical Analysis Ppt Infographic Template Display PDF
This graph or chart is linked to excel, and changes automatically based on data. Just left click on it and select Edit Data. Pitch your topic with ease and precision using this Business Performance Highlights With Trend And Statistical Analysis Ppt Infographic Template Display PDF. This layout presents information on Statistical Trend Analysis, Main Metrics, Profit And Loss. It is also available for immediate download and adjustment. So, changes can be made in the color, design, graphics or any other component to create a unique layout.
-
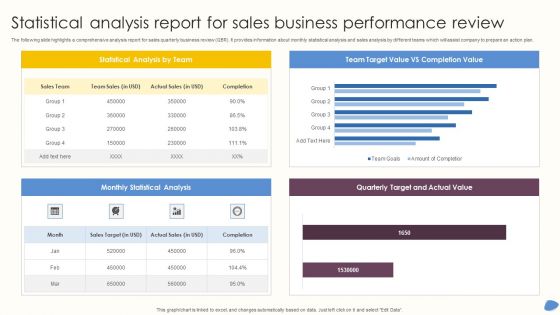
Statistical Analysis Report For Sales Business Performance Review Background PDF
The following slide highlights a comprehensive analysis report for sales quarterly business review QBR. It provides information about monthly statistical analysis and sales analysis by different teams which will assist company to prepare an action plan. Showcasing this set of slides titled Statistical Analysis Report For Sales Business Performance Review Background PDF. The topics addressed in these templates are Team Target, Quarterly Target, Monthly Statistical Analysis, Statistical Analysis Team. All the content presented in this PPT design is completely editable. Download it and make adjustments in color, background, font etc. as per your unique business setting.
-
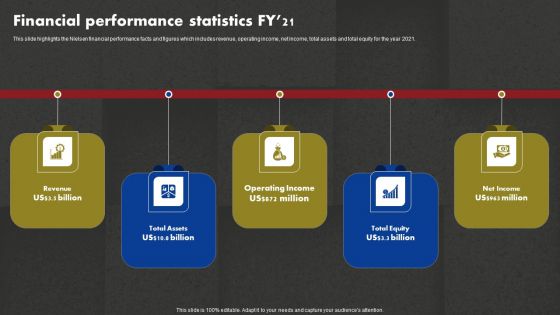
Data And Customer Analysis Company Outline Financial Performance Statistics FY21 Professional PDF
This slide highlights the Nielsen financial performance facts and figures which includes revenue, operating income, net income, total assets and total equity for the year 2021. Coming up with a presentation necessitates that the majority of the effort goes into the content and the message you intend to convey. The visuals of a PowerPoint presentation can only be effective if it supplements and supports the story that is being told. Keeping this in mind our experts created Data And Customer Analysis Company Outline Financial Performance Statistics FY21 Professional PDF to reduce the time that goes into designing the presentation. This way, you can concentrate on the message while our designers take care of providing you with the right template for the situation.
-
Industry Wise Email Marketing Performance Statistics Analysis Graphics PDF
This slide includes email marketing benchmarks and statistics for the year 2022 based on various industries. It includes email metrics such as open rate, CTR, unsubscribes rate in industries like automobile, finance, retail, food, legal services, etc. Pitch your topic with ease and precision using this Industry Wise Email Marketing Performance Statistics Analysis Graphics PDF. This layout presents information on Automobile, Financial Service, Legal Services. It is also available for immediate download and adjustment. So, changes can be made in the color, design, graphics or any other component to create a unique layout.
-
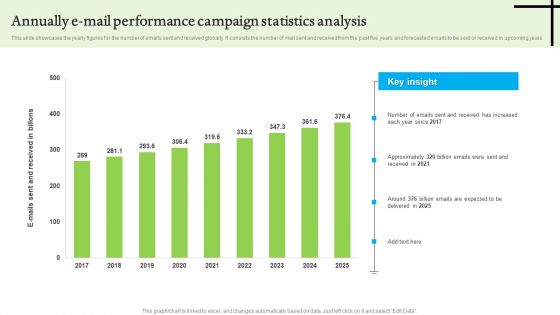
Annually E Mail Performance Campaign Statistics Analysis Infographics PDF
This slide showcases the yearly figures for the number of emails sent and received globally. It consists the number of mail sent and received from the past five years and forecasted emails to be sent or received in upcoming years. Showcasing this set of slides titled Annually E Mail Performance Campaign Statistics Analysis Infographics PDF. The topics addressed in these templates are Annually E Mail Performance, Campaign Statistics Analysis. All the content presented in this PPT design is completely editable. Download it and make adjustments in color, background, font etc. as per your unique business setting.
-
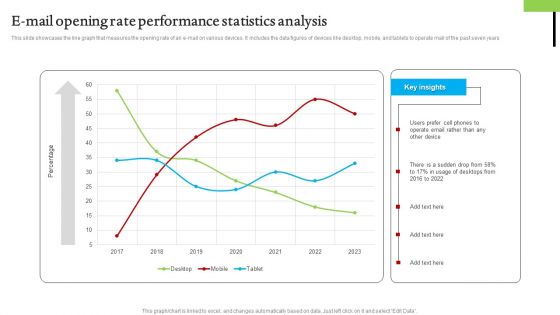
E Mail Opening Rate Performance Statistics Analysis Mockup PDF
This slide showcases the line graph that measures the opening rate of an e-mail on various devices. It includes the data figures of devices like desktop, mobile, and tablets to operate mail of the past seven years. Showcasing this set of slides titled E Mail Opening Rate Performance Statistics Analysis Mockup PDF. The topics addressed in these templates are E Mail Opening Rate, Performance Statistics Analysis. All the content presented in this PPT design is completely editable. Download it and make adjustments in color, background, font etc. as per your unique business setting.
-
Various E Mail Campaign Performance Statistics Analysis Graphics PDF
The purpose of this slide is to evaluate the different e-mail campaign performance outcomes between the year 2021-2022. E-mail categories include discounts and offers, advice, info or tutorial, confirmations or updates etc. Showcasing this set of slides titled Various E Mail Campaign Performance Statistics Analysis Graphics PDF. The topics addressed in these templates are Various E Mail Campaign, Performance Statistics Analysis. All the content presented in this PPT design is completely editable. Download it and make adjustments in color, background, font etc. as per your unique business setting.
-
Statistical Tools For Evidence 30 60 90 Days Plan To Perform Statistical Data Analysis
This slide represents 30-60-90 plan to conduct statistical data analysis. The purpose of this slide is to illustrate the plans of the first 90 days from the start of the project including steps to be followed at interval of one month. Do you have to make sure that everyone on your team knows about any specific topic I yes, then you should give Statistical Tools For Evidence 30 60 90 Days Plan To Perform Statistical Data Analysis a try. Our experts have put a lot of knowledge and effort into creating this impeccable Statistical Tools For Evidence 30 60 90 Days Plan To Perform Statistical Data Analysis. You can use this template for your upcoming presentations, as the slides are perfect to represent even the tiniest detail. You can download these templates from the Slidegeeks website and these are easy to edit. So grab these today
-
Statistical Tools For Evidence Before Vs After Performing Statistical Analysis
This slide shows the before vs. after comparison of statistical analysis of business data. The different aspects compared in this slide are decision-making, operational efficiency, customer insights, product quality, revenue generation, supply chain efficiency, etc. Get a simple yet stunning designed Statistical Tools For Evidence Before Vs After Performing Statistical Analysis. It is the best one to establish the tone in your meetings. It is an excellent way to make your presentations highly effective. So, download this PPT today from Slidegeeks and see the positive impacts. Our easy-to-edit Statistical Tools For Evidence Before Vs After Performing Statistical Analysis can be your go-to option for all upcoming conferences and meetings. So, what are you waiting for Grab this template today.
-
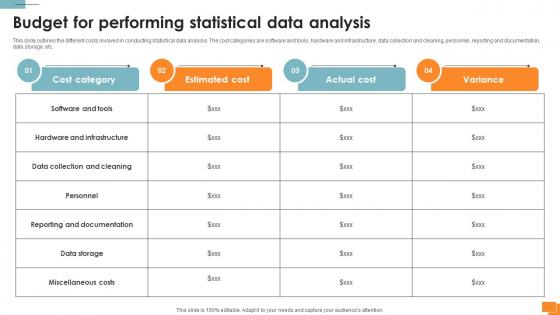
Statistical Tools For Evidence Budget For Performing Statistical Data Analysis
This slide outlines the different costs involved in conducting statistical data analysis. The cost categories are software and tools, hardware and infrastructure, data collection and cleaning, personnel, reporting and documentation, data storage, etc. Slidegeeks is here to make your presentations a breeze with Statistical Tools For Evidence Budget For Performing Statistical Data Analysis With our easy-to-use and customizable templates, you can focus on delivering your ideas rather than worrying about formatting. With a variety of designs to choose from, you are sure to find one that suits your needs. And with animations and unique photos, illustrations, and fonts, you can make your presentation pop. So whether you are giving a sales pitch or presenting to the board, make sure to check out Slidegeeks first
-
Statistical Tools For Evidence Checklist To Perform Statistical Data Analysis
This slide represents the checklist to conduct statistical data analysis. The fundamental approaches are writing hypothesis and plan research design, collect data from a sample, summarize data with descriptive statistics, test hypotheses, result interpretation, etc. Whether you have daily or monthly meetings, a brilliant presentation is necessary. Statistical Tools For Evidence Checklist To Perform Statistical Data Analysis can be your best option for delivering a presentation. Represent everything in detail using Statistical Tools For Evidence Checklist To Perform Statistical Data Analysis and make yourself stand out in meetings. The template is versatile and follows a structure that will cater to your requirements. All the templates prepared by Slidegeeks are easy to download and edit. Our research experts have taken care of the corporate themes as well. So, give it a try and see the results.
-
Statistical Tools For Evidence Methods To Perform Statistical Analysis Of Data
This slide demonstrates the different methods employed to perform statistical analysis of business data, which helps in deriving various patterns. These include mean, regression, standard deviation, hypothesis testing, and sample size distribution. Slidegeeks has constructed Statistical Tools For Evidence Methods To Perform Statistical Analysis Of Data after conducting extensive research and examination. These presentation templates are constantly being generated and modified based on user preferences and critiques from editors. Here, you will find the most attractive templates for a range of purposes while taking into account ratings and remarks from users regarding the content. This is an excellent jumping-off point to explore our content and will give new users an insight into our top-notch PowerPoint Templates.
-
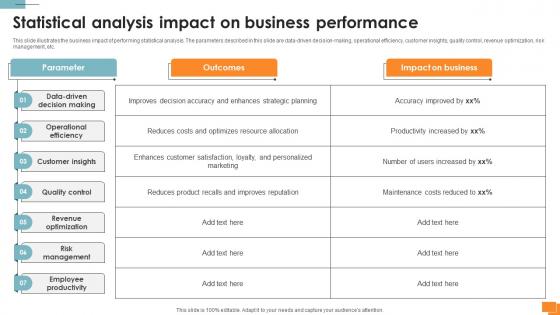
Statistical Tools For Evidence Statistical Analysis Impact On Business Performance
This slide illustrates the business impact of performing statistical analysis. The parameters described in this slide are data-driven decision-making, operational efficiency, customer insights, quality control, revenue optimization, risk management, etc. Do you know about Slidesgeeks Statistical Tools For Evidence Statistical Analysis Impact On Business Performance These are perfect for delivering any kind od presentation. Using it, create PowerPoint presentations that communicate your ideas and engage audiences. Save time and effort by using our pre-designed presentation templates that are perfect for a wide range of topic. Our vast selection of designs covers a range of styles, from creative to business, and are all highly customizable and easy to edit. Download as a PowerPoint template or use them as Google Slides themes.
-
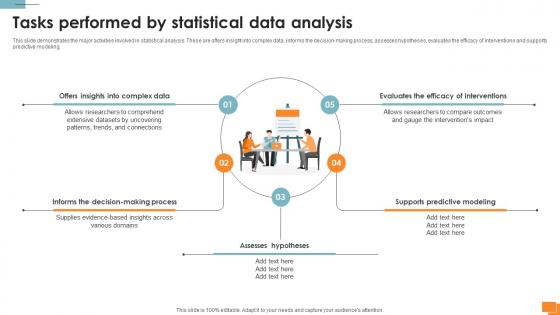
Statistical Tools For Evidence Tasks Performed By Statistical Data Analysis
This slide demonstrates the major activities involved in statistical analysis. These are offers insight into complex data, informs the decision-making process, assesses hypotheses, evaluates the efficacy of interventions and supports predictive modeling. Get a simple yet stunning designed Statistical Tools For Evidence Tasks Performed By Statistical Data Analysis. It is the best one to establish the tone in your meetings. It is an excellent way to make your presentations highly effective. So, download this PPT today from Slidegeeks and see the positive impacts. Our easy-to-edit Statistical Tools For Evidence Tasks Performed By Statistical Data Analysis can be your go-to option for all upcoming conferences and meetings. So, what are you waiting for Grab this template today.


