Statistical Tools For Evidence Before Vs After Performing Statistical Analysis
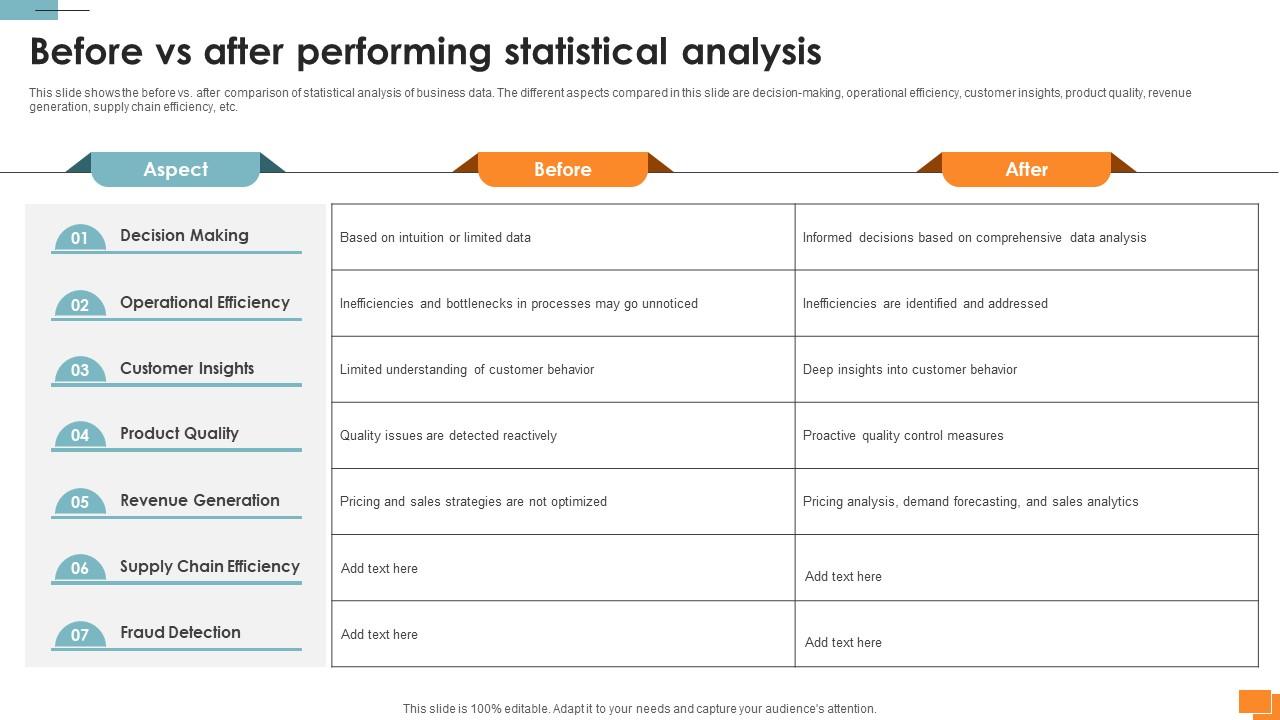
This slide shows the before vs. after comparison of statistical analysis of business data. The different aspects compared in this slide are decision-making, operational efficiency, customer insights, product quality, revenue generation, supply chain efficiency, etc.
- Google Slides is a new FREE Presentation software from Google.
- All our content is 100% compatible with Google Slides.
- Just download our designs, and upload them to Google Slides and they will work automatically.
- Amaze your audience with SlideGeeks and Google Slides.
-
Want Changes to This PPT Slide? Check out our Presentation Design Services
- WideScreen Aspect ratio is becoming a very popular format. When you download this product, the downloaded ZIP will contain this product in both standard and widescreen format.
-

- Some older products that we have may only be in standard format, but they can easily be converted to widescreen.
- To do this, please open the SlideGeeks product in Powerpoint, and go to
- Design ( On the top bar) -> Page Setup -> and select "On-screen Show (16:9)” in the drop down for "Slides Sized for".
- The slide or theme will change to widescreen, and all graphics will adjust automatically. You can similarly convert our content to any other desired screen aspect ratio.
Compatible With Google Slides

Get This In WideScreen
You must be logged in to download this presentation.
 Impress Your
 Audience
 100%
100% Editable
Google Slides
Features of these PowerPoint presentation slides:
This slide shows the before vs. after comparison of statistical analysis of business data. The different aspects compared in this slide are decision-making, operational efficiency, customer insights, product quality, revenue generation, supply chain efficiency, etc. Get a simple yet stunning designed Statistical Tools For Evidence Before Vs After Performing Statistical Analysis. It is the best one to establish the tone in your meetings. It is an excellent way to make your presentations highly effective. So, download this PPT today from Slidegeeks and see the positive impacts. Our easy-to-edit Statistical Tools For Evidence Before Vs After Performing Statistical Analysis can be your go-to option for all upcoming conferences and meetings. So, what are you waiting for Grab this template today. This slide shows the before vs. after comparison of statistical analysis of business data. The different aspects compared in this slide are decision-making, operational efficiency, customer insights, product quality, revenue generation, supply chain efficiency, etc.
People who downloaded this PowerPoint presentation also viewed the following :
Statistical Tools For Evidence Before Vs After Performing Statistical Analysis with all 9 slides:
Use our Statistical Tools For Evidence Before Vs After Performing Statistical Analysis to effectively help you save your valuable time. They are readymade to fit into any presentation structure.
Most Relevant Reviews
-
Much better than the original! Thanks for the quick turnaround.
-
Excellent design and quick turnaround.

 Home
Home 


