Performance graph PowerPoint Presentation Templates and Google Slides
-
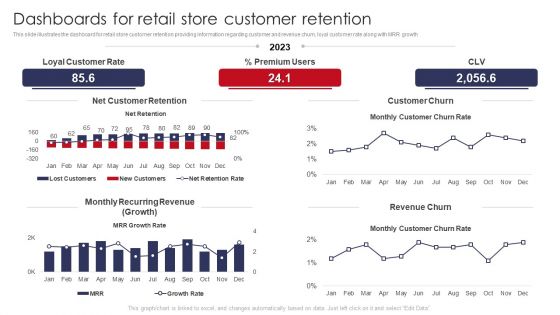
Dashboards For Retail Store Customer Retention Retail Outlet Operations Performance Evaluation Graphics PDF
This slide illustrates the dashboard for retail store customer retention providing information regarding customer and revenue churn, loyal customer rate along with MRR growth.Deliver and pitch your topic in the best possible manner with this Dashboards For Retail Store Customer Retention Retail Outlet Operations Performance Evaluation Graphics PDF. Use them to share invaluable insights on Customer Retention, Loyal Customer, Recurring Revenue and impress your audience. This template can be altered and modified as per your expectations. So, grab it now.
-
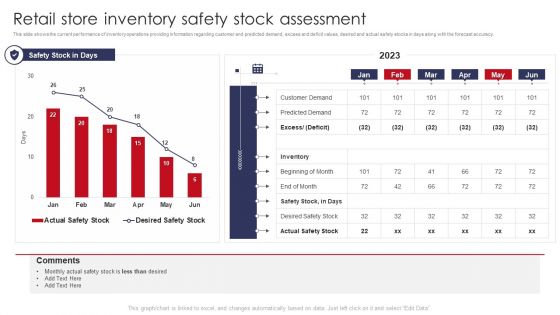
Retail Store Inventory Safety Stock Assessment Retail Outlet Operations Performance Evaluation Graphics PDF
This slide shows the current performance of inventory operations providing information regarding customer and predicted demand, excess and deficit values, desired and actual safety stocks in days along with the forecast accuracy.Deliver and pitch your topic in the best possible manner with this Retail Store Inventory Safety Stock Assessment Retail Outlet Operations Performance Evaluation Graphics PDF. Use them to share invaluable insights on Predicted Demand, Customer Demand, Beginning and impress your audience. This template can be altered and modified as per your expectations. So, grab it now.
-
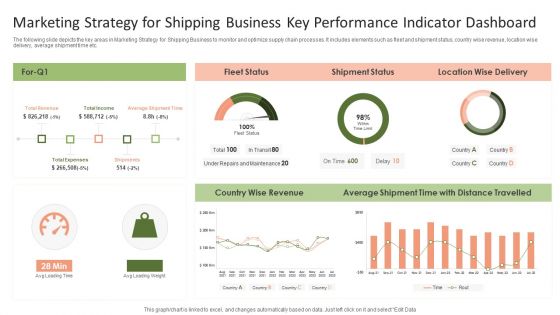
Marketing Strategy For Shipping Business Key Performance Indicator Dashboard Graphics PDF
The following slide depicts the key areas in Marketing Strategy for Shipping Business to monitor and optimize supply chain processes. It includes elements such as fleet and shipment status, country wise revenue, location wise delivery, average shipment time etc.Pitch your topic with ease and precision using this Marketing Strategy For Shipping Business Key Performance Indicator Dashboard Graphics PDF. This layout presents information on Shipment Status, Average Shipment, Wise Revenue. It is also available for immediate download and adjustment. So, changes can be made in the color, design, graphics or any other component to create a unique layout.
-
Hedge Fund Performance Over Time Hedge Fund Performance Graphics PDF
This slide highlights the hedge fund performance which includes the HFRI equity hedge, event driven hedge, relative value hedge, HFRI macro and US crop fixed income with return rate. Deliver an awe inspiring pitch with this creative Hedge Fund Performance Over Time Hedge Fund Performance Graphics PDF bundle. Topics like Different Funds Performance, Hedge Fund can be discussed with this completely editable template. It is available for immediate download depending on the needs and requirements of the user.
-
Organization DAM Services Usage And Performance Tracking To Drive Decisions Graphics PDF
This slide covers the decisions based on usage and assets performance tracking and how digital assets solutions should be so that brands can focus on ROI and better experience. Deliver and pitch your topic in the best possible manner with this Organization DAM Services Usage And Performance Tracking To Drive Decisions Graphics PDF. Use them to share invaluable insights on Best Return Investment, Minimize Costs, Brands Need and impress your audience. This template can be altered and modified as per your expectations. So, grab it now.
-
Employees Performance Assessment And Appraisal Determine Team Performance Tracking Dashboard Graphics PDF
This slide provides information about team performance management dashboard by tracking customer concern resolution rate, top people involved, etc.Deliver and pitch your topic in the best possible manner with this Employees Performance Assessment And Appraisal Determine Team Performance Tracking Dashboard Graphics PDF Use them to share invaluable insights on Sales Enquiry, Feature Performing, Team Members and impress your audience. This template can be altered and modified as per your expectations. So, grab it now.
-
Integration Of Digital Technology In Organization Company Financial Performance Graphics PDF
This graph depicts the financial performance of the company wherein revenues, expenses and profit are evaluated.Deliver and pitch your topic in the best possible manner with this Integration Of Digital Technology In Organization Company Financial Performance Graphics PDF Use them to share invaluable insights on Decrease In Revenues, Increase Expenses, Decrease In Profit and impress your audience. This template can be altered and modified as per your expectations. So, grab it now.
-
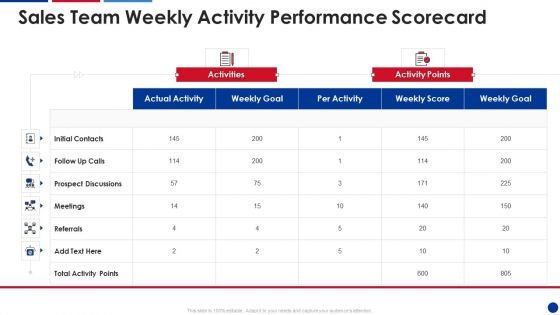
Sales Team Weekly Activity Performance Scorecard Graphics PDF
Deliver an awe inspiring pitch with this creative Sales Team Weekly Activity Performance Scorecard Graphics PDF bundle. Topics like Actual Activity, Initial Contacts, Prospect Discussions can be discussed with this completely editable template. It is available for immediate download depending on the needs and requirements of the user.
-
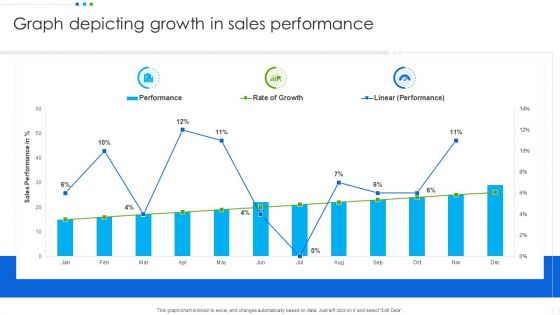
Graph Depicting Growth In Sales Performance Professional PDF
Pitch your topic with ease and precision using this Graph Depicting Growth In Sales Performance Professional PDF. This layout presents information on Graph Depicting, Sales Performance. It is also available for immediate download and adjustment. So, changes can be made in the color, design, graphics or any other component to create a unique layout.
-
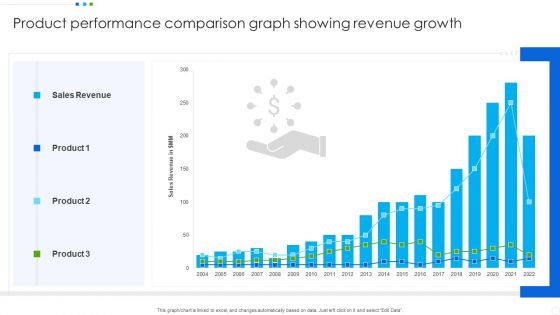
Product Performance Comparison Graph Showing Revenue Growth Portrait PDF
Showcasing this set of slides titled Product Performance Comparison Graph Showing Revenue Growth Portrait PDF. The topics addressed in these templates are Sales Revenue, Product. All the content presented in this PPT design is completely editable. Download it and make adjustments in color, background, font etc. as per your unique business setting.
-
Sales Growth Graph Showing Annual Product Performance Slides PDF
Pitch your topic with ease and precision using this Sales Growth Graph Showing Annual Product Performance Slides PDF. This layout presents information on Sales Growth, Product Performance. It is also available for immediate download and adjustment. So, changes can be made in the color, design, graphics or any other component to create a unique layout.
-
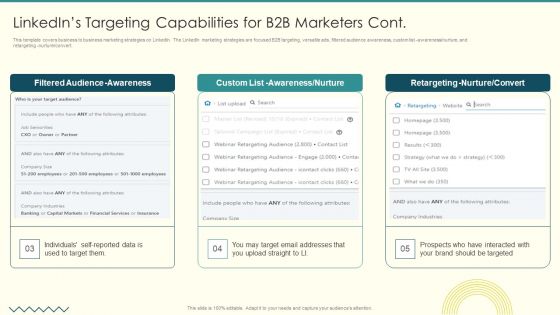
Security And Performance Digital Marketing Linkedins Targeting Capabilities For B2B Marketers Cont Graphics PDF
This template covers business to business marketing strategies on LinkedIn. The LinkedIn marketing strategies are focused B2B targeting, versatile ads, filtered audience awareness, custom list awareness nurture, and retargeting nurture convert.Deliver an awe inspiring pitch with this creative Security And Performance Digital Marketing Linkedins Targeting Capabilities For B2B Marketers Cont Graphics PDF bundle. Topics like Filtered Audience, Awareness Nurture, Retargeting Nurture can be discussed with this completely editable template. It is available for immediate download depending on the needs and requirements of the user.
-
Enterprise Sustainability Performance Metrics Customer Lifetime Value Dashboard Graphics PDF
This slide covers customer lifetime value dashboard. It covers details of average customer lifetime and average lifetime value in a 12 months format.Deliver and pitch your topic in the best possible manner with this Enterprise Sustainability Performance Metrics Customer Lifetime Value Dashboard Graphics PDF. Use them to share invaluable insights on Average Customer, Lifetime Value, Customer Lifetime and impress your audience. This template can be altered and modified as per your expectations. So, grab it now.
-
Call Center Communication Kpis Performance Dashboard With First Call Resolution Rate Graphics PDF
This slide showcases dashboard that can help organization to analyze the performance of call center agents communication KPIs and take necessary actions in case of high abandonment rate. Its key components are average response time, first call resolution and top performing call agents. Showcasing this set of slides titled Call Center Communication Kpis Performance Dashboard With First Call Resolution Rate Graphics PDF. The topics addressed in these templates are Overall Average, Response Time, First Call Resolution, Daily Abandonment Rate. All the content presented in this PPT design is completely editable. Download it and make adjustments in color, background, font etc. as per your unique business setting.
-
Performance Assessment Dashboard For Social Media Communication Kpis Graphics PDF
This slide showcases dashboard that can help organization to analyzing the reach of their communication KPIs campaigns and customer engagement rates. Its key components are monthly new follows, page likes, page impression by age group, page check ins and total content engagement. Pitch your topic with ease and precision using this Performance Assessment Dashboard For Social Media Communication Kpis Graphics PDF. This layout presents information on Monthly New Follows, Page Check ins, Total Content Engagement. It is also available for immediate download and adjustment. So, changes can be made in the color, design, graphics or any other component to create a unique layout.
-
Consumer Journey Mapping Techniques Dashboard For Tracking Website Performance Graphics PDF
This slide covers the KPI dashboard for analyzing the company website. It includes metrics such as conversions, conversion rate, sessions, stickiness, bounce rate, engagement, etc. Showcasing this set of slides titled Consumer Journey Mapping Techniques Dashboard For Tracking Website Performance Graphics PDF. The topics addressed in these templates are Bounce Rate, Organic, Conversions Rate. All the content presented in this PPT design is completely editable. Download it and make adjustments in color, background, font etc. as per your unique business setting.
-
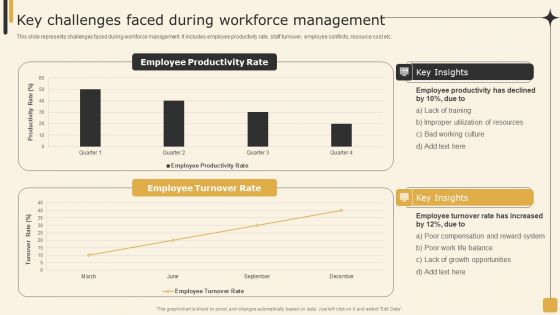
Key Challenges Faced During Workforce Management Employee Performance Management Tactics Graphics PDF
This slide represents challenges faced during workforce management. It includes employee productivity rate, staff turnover, employee conflicts, resource cost etc.Welcome to our selection of the Key Challenges Faced During Workforce Management Employee Performance Management Tactics Graphics PDF. These are designed to help you showcase your creativity and bring your sphere to life. Planning and Innovation are essential for any business that is just starting out. This collection contains the designs that you need for your everyday presentations. All of our PowerPoints are 100precent editable, so you can customize them to suit your needs. This multi-purpose template can be used in various situations. Grab these presentation templates today.
-
International Business Extension Joint Venture Performance Of Organizations Graphics PDF
This slide showcases performance of organization after expanding business globally through joint venture. It can help business to evaluate the success rate of global expansion through joint venture. Here you can discover an assortment of the finest PowerPoint and Google Slides templates. With these templates, you can create presentations for a variety of purposes while simultaneously providing your audience with an eye-catching visual experience. Download International Business Extension Joint Venture Performance Of Organizations Graphics PDF to deliver an impeccable presentation. These templates will make your job of preparing presentations much quicker, yet still, maintain a high level of quality. Slidegeeks has experienced researchers who prepare these templates and write high-quality content for you. Later on, you can personalize the content by editing the International Business Extension Joint Venture Performance Of Organizations Graphics PDF.
-
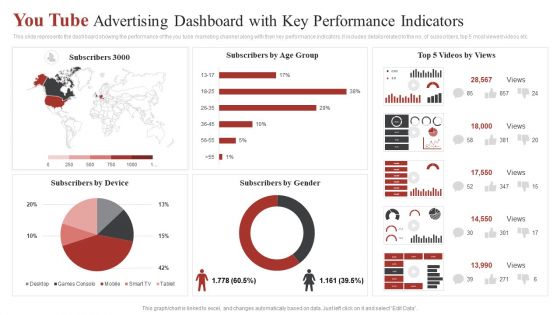
You Tube Advertising Dashboard With Key Performance Indicators Ppt Outline Graphics Example PDF
This slide represents the dashboard showing the performance of the you tube marketing channel along with their key performance indicators. It includes details related to the no. of subscribers, top 5 most viewed videos etc. Showcasing this set of slides titled You Tube Advertising Dashboard With Key Performance Indicators Ppt Outline Graphics Example PDF. The topics addressed in these templates are Subscribers Gender, Subscribers Age Group, Top 5 Videos. All the content presented in this PPT design is completely editable. Download it and make adjustments in color, background, font etc. as per your unique business setting.
-
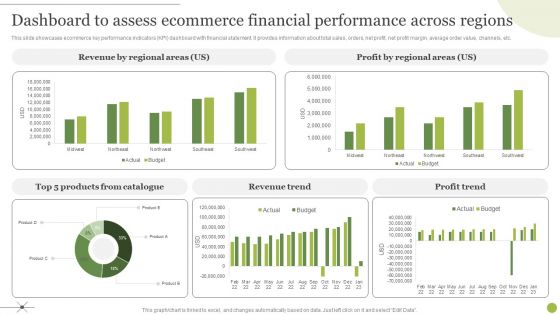
Managing E Commerce Business Accounting Dashboard To Assess Ecommerce Financial Performance Across Regions Graphics PDF
This slide showcases ecommerce key performance indicators KPI dashboard with financial statement. It provides information about total sales, orders, net profit, net profit margin, average order value, channels, etc. Do you have to make sure that everyone on your team knows about any specific topic I yes, then you should give Managing E Commerce Business Accounting Dashboard To Assess Ecommerce Financial Performance Across Regions Graphics PDF a try. Our experts have put a lot of knowledge and effort into creating this impeccable Managing E Commerce Business Accounting Dashboard To Assess Ecommerce Financial Performance Across Regions Graphics PDF. You can use this template for your upcoming presentations, as the slides are perfect to represent even the tiniest detail. You can download these templates from the Slidegeeks website and these are easy to edit. So grab these today.
-
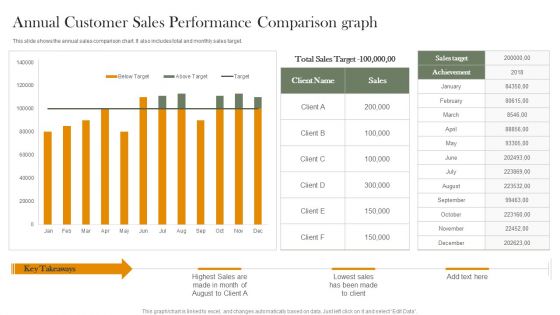
Annual Customer Sales Performance Comparison Graph Portrait PDF
This slide shows the annual sales comparison chart. It also includes total and monthly sales target. Pitch your topic with ease and precision using this Annual Customer Sales Performance Comparison Graph Portrait PDF. This layout presents information on Total Sales Target, Sales Target, Achievement. It is also available for immediate download and adjustment. So, changes can be made in the color, design, graphics or any other component to create a unique layout.
-
Sales Performance Comparison Graph Of Top Customer Icons PDF
This slide shows the customer sales comparison graph along with the units of product purchased by the clients. Showcasing this set of slides titled Sales Performance Comparison Graph Of Top Customer Icons PDF. The topics addressed in these templates are Highest Units, Customer, Product. All the content presented in this PPT design is completely editable. Download it and make adjustments in color, background, font etc. as per your unique business setting.
-
State Wise Customer Sales Performance Comparison Graph Introduction PDF
This slide shows the sales graph of 3 products of a company in various states. It includes five states which are New York, Texas, California, Washington and New Jersey. Showcasing this set of slides titled State Wise Customer Sales Performance Comparison Graph Introduction PDF. The topics addressed in these templates are Lowest Sales, Decrease Demand. All the content presented in this PPT design is completely editable. Download it and make adjustments in color, background, font etc. as per your unique business setting.
-
Two Year Comparative Analysis Of Information Technology Security Key Performance Indicators Graphics PDF
This slide contains the information related to the cyber security kpis and the issues that are been occurred in this year as well as the previous year to compare how the company is working and what needs to be done to make it even better. Showcasing this set of slides titled Two Year Comparative Analysis Of Information Technology Security Key Performance Indicators Graphics PDF. The topics addressed in these templates are Tested Readiness, Disaster Plans, Security Policy Violations. All the content presented in this PPT design is completely editable. Download it and make adjustments in color, background, font etc. as per your unique business setting.
-
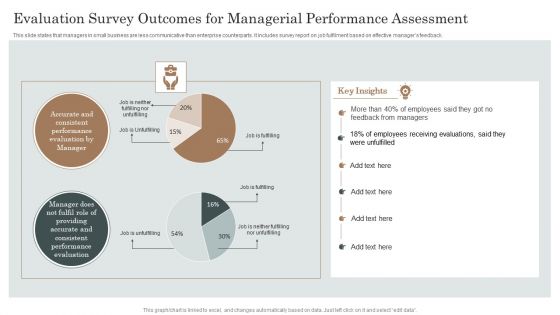
Evaluation Survey Outcomes For Managerial Performance Assessment Ppt Gallery Graphics PDF
This slide states that managers in small business are less communicative than enterprise counterparts. It includes survey report on job fulfilment based on effective managers feedback. Showcasing this set of slides titled Evaluation Survey Outcomes For Managerial Performance Assessment Ppt Gallery Graphics PDF. The topics addressed in these templates are Employees Receiving Evaluations, Feedback From Managers, Performance Evaluation. All the content presented in this PPT design is completely editable. Download it and make adjustments in color, background, font etc. as per your unique business setting.
-
Product Marketing Management To Enforce Business Performance Post Strategy Implementation Number Graphics PDF
This slide shows the forecasted positive impact of companys product marketing strategies on lead conversion rate. Additionally, it provides the key insights and reason behind the increase in lead conversion rate of the company. Create an editable Product Marketing Management To Enforce Business Performance Post Strategy Implementation Number Graphics PDF that communicates your idea and engages your audience. Whether you are presenting a business or an educational presentation, pre designed presentation templates help save time. Product Marketing Management To Enforce Business Performance Post Strategy Implementation Number Graphics PDF is highly customizable and very easy to edit, covering many different styles from creative to business presentations. Slidegeeks has creative team members who have crafted amazing templates. So, go and get them without any delay.
-
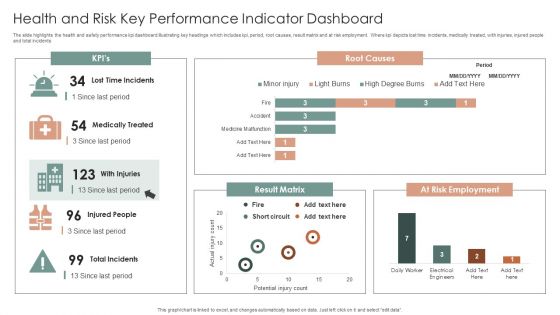
Health And Risk Key Performance Indicator Dashboard Ppt Layouts Graphics Design PDF
The slide highlights the health and safety performance kpi dashboard illustrating key headings which includes kpi, period, root causes, result matrix and at risk employment. Where kpi depicts lost time incidents, medically treated, with injuries, injured people and total incidents. Showcasing this set of slides titled Health And Risk Key Performance Indicator Dashboard Ppt Layouts Graphics Design PDF. The topics addressed in these templates are Root Causes, Result Matrix, At Risk Employment. All the content presented in this PPT design is completely editable. Download it and make adjustments in color, background, font etc. as per your unique business setting.
-
Risk Key Performance Indicator Dashboard For Manufacturing Company Ppt Gallery Graphics Design PDF
The following slide highlights the safety key performance indicator dashboard for manufacturing company. It showcases safety incident per employee, total number of cases, safety events avoided, accumulated total and safety incidents. Pitch your topic with ease and precision using this Risk Key Performance Indicator Dashboard For Manufacturing Company Ppt Gallery Graphics Design PDF. This layout presents information on Safety Incidents, Safety Incident Avoided, Safety Incident Accumulated. It is also available for immediate download and adjustment. So, changes can be made in the color, design, graphics or any other component to create a unique layout.
-
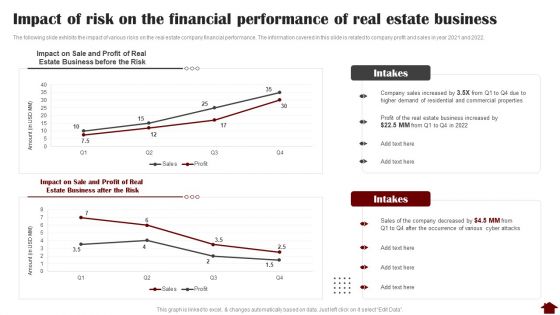
Impact Of Risk On The Financial Performance Of Real Estate Business Graphics PDF
The following slide exhibits the impact of various risks on the real estate company financial performance. The information covered in this slide is related to company profit and sales in year 2021 and 2022. Deliver an awe inspiring pitch with this creative Impact Of Risk On The Financial Performance Of Real Estate Business Graphics PDF bundle. Topics like Sale And Profit, Estate Business, Risk can be discussed with this completely editable template. It is available for immediate download depending on the needs and requirements of the user.
-
Competitor Analysis Based On Top Performing Skus Competitor Vs Our Company Graphics PDF
This slide covers the comparison of competitors top selling categories. It also includes key insights such as consumers likeness to purchase dressier items from our company. Are you searching for a Competitor Analysis Based On Top Performing Skus Competitor Vs Our Company Graphics PDF that is uncluttered, straightforward, and original Its easy to edit, and you can change the colors to suit your personal or business branding. For a presentation that expresses how much effort youve put in, this template is ideal. With all of its features, including tables, diagrams, statistics, and lists, its perfect for a business plan presentation. Make your ideas more appealing with these professional slides. Download Competitor Analysis Based On Top Performing Skus Competitor Vs Our Company Graphics PDF from Slidegeeks today.
-
2018 To 2021 Sales Performance Clustered Bar Graph Graphics PDF
Showcasing this set of slides titled 2018 To 2021 Sales Performance Clustered Bar Graph Graphics PDF. The topics addressed in these templates are Range Of Profits, Increase In Production, Profits Are Stagnant. All the content presented in this PPT design is completely editable. Download it and make adjustments in color, background, font etc. as per your unique business setting.
-
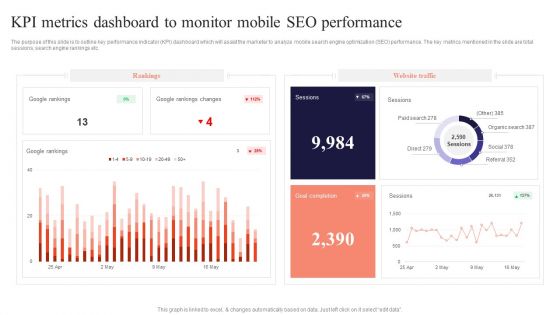
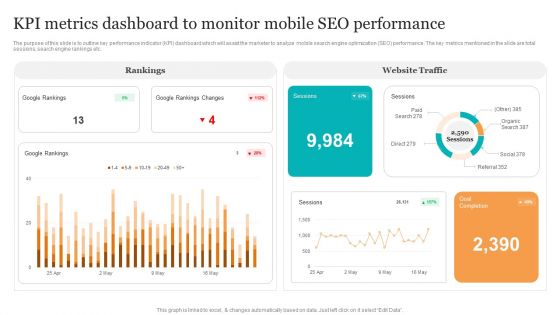
KPI Metrics Dashboard To Monitor Mobile Performing Mobile SEO Audit To Analyze Web Traffic Graphics PDF
The purpose of this slide is to outline key performance indicator KPI dashboard which will assist the marketer to analyze mobile search engine optimization SEO performance. The key metrics mentioned in the slide are total sessions, search engine rankings etc.Find highly impressive KPI Metrics Dashboard To Monitor Mobile Performing Mobile SEO Audit To Analyze Web Traffic Graphics PDF on Slidegeeks to deliver a meaningful presentation. You can save an ample amount of time using these presentation templates. No need to worry to prepare everything from scratch because Slidegeeks experts have already done a huge research and work for you. You need to download KPI Metrics Dashboard To Monitor Mobile Performing Mobile SEO Audit To Analyze Web Traffic Graphics PDF for your upcoming presentation. All the presentation templates are 100 precent editable and you can change the color and personalize the content accordingly. Download now.
-
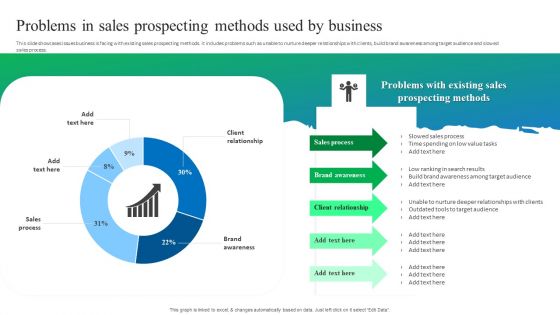
Process Enhancement Plan To Boost Sales Performance Problems In Sales Prospecting Methods Used By Business Graphics PDF
This slide showcases issues business is facing with existing sales prospecting methods. It includes problems such as unable to nurture deeper relationships with clients, build brand awareness among target audience and slowed sales process. Do you have to make sure that everyone on your team knows about any specific topic I yes, then you should give Process Enhancement Plan To Boost Sales Performance Problems In Sales Prospecting Methods Used By Business Graphics PDF a try. Our experts have put a lot of knowledge and effort into creating this impeccable Process Enhancement Plan To Boost Sales Performance Problems In Sales Prospecting Methods Used By Business Graphics PDF. You can use this template for your upcoming presentations, as the slides are perfect to represent even the tiniest detail. You can download these templates from the Slidegeeks website and these are easy to edit. So grab these today.
-
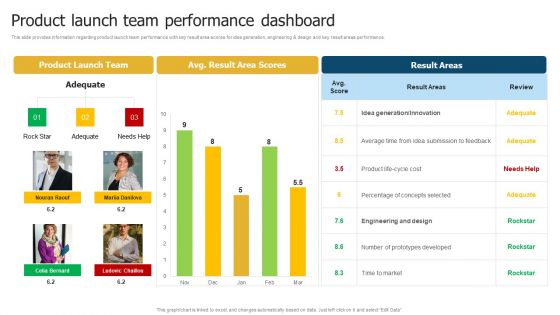
Merchandise Launch Kickoff Playbook Product Launch Team Performance Dashboard Graphics PDF
This slide provides information regarding product launch team performance with key result area scores for idea generation, engineering and design and key result areas performance. From laying roadmaps to briefing everything in detail, our templates are perfect for you. You can set the stage with your presentation slides. All you have to do is download these easy to edit and customizable templates. Merchandise Launch Kickoff Playbook Product Launch Team Performance Dashboard Graphics PDF will help you deliver an outstanding performance that everyone would remember and praise you for. Do download this presentation today.
-
KPI Metrics Dashboard To Monitor Mobile Seo Performance Search Engine Optimization Services To Minimize Graphics PDF
The purpose of this slide is to outline key performance indicator KPI dashboard which will assist the marketer to analyze mobile search engine optimization SEO performance. The key metrics mentioned in the slide are total sessions, search engine rankings etc. Present like a pro with KPI Metrics Dashboard To Monitor Mobile Seo Performance Search Engine Optimization Services To Minimize Graphics PDF Create beautiful presentations together with your team, using our easy-to-use presentation slides. Share your ideas in real-time and make changes on the fly by downloading our templates. So whether you are in the office, on the go, or in a remote location, you can stay in sync with your team and present your ideas with confidence. With Slidegeeks presentation got a whole lot easier. Grab these presentations today.
-
Effective Financial Planning Assessment Techniques Performance Kpi Dashboard To Measure Financial Graphics PDF
The following slide outlines a comprehensive key performance indicator KPI dashboard highlighting different financial metrics. The KPIs are quick and current ratio, cash balance, days sales outstanding etc. The best PPT templates are a great way to save time, energy, and resources. Slidegeeks have 100 precent editable powerpoint slides making them incredibly versatile. With these quality presentation templates, you can create a captivating and memorable presentation by combining visually appealing slides and effectively communicating your message. Download Effective Financial Planning Assessment Techniques Performance Kpi Dashboard To Measure Financial Graphics PDF from Slidegeeks and deliver a wonderful presentation.
-
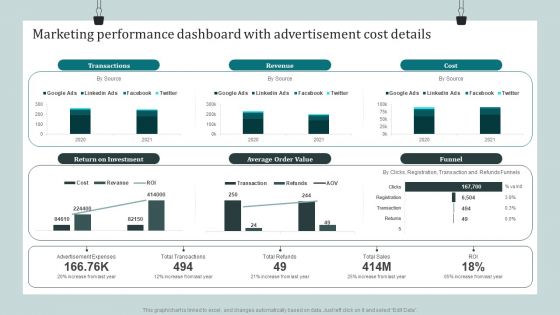
Product Awareness Strategies To Raise Demand Marketing Performance Dashboard With Advertisement Cost Details Graphics PDF
Present like a pro with Product Awareness Strategies To Raise Demand Marketing Performance Dashboard With Advertisement Cost Details Graphics PDF Create beautiful presentations together with your team, using our easy to use presentation slides. Share your ideas in real time and make changes on the fly by downloading our templates. So whether you are in the office, on the go, or in a remote location, you can stay in sync with your team and present your ideas with confidence. With Slidegeeks presentation got a whole lot easier. Grab these presentations today.
-
BPA Tools For Process Enhancement And Cost Minimization KPI Dashboard To Track Automation Performance In Employee Onboarding Graphics PDF
The following slide outlines performance key performance indicator KPI which can be used to evaluate business process automation performance in employee onboarding. The metrics highlighted in the slide are onboarding completion status, hires per office, etc. There are so many reasons you need a BPA Tools For Process Enhancement And Cost Minimization KPI Dashboard To Track Automation Performance In Employee Onboarding Graphics PDF. The first reason is you can not spend time making everything from scratch, Thus, Slidegeeks has made presentation templates for you too. You can easily download these templates from our website easily.
-
Safety And Health Kpis For Tracking Performance Graph Mockup PDF
This slide represents graph showing key performance indicators tracked by companies for assessment of safety and health performance of their workplace. It includes key metrics such as workforce awareness, safety meetings held, recordable injuries, lost work days, compliance, severity rates etc. Pitch your topic with ease and precision using this Safety And Health Kpis For Tracking Performance Graph Mockup PDF. This layout presents information on Safety And Health, Kpis For Tracking, Performance Graph. It is also available for immediate download and adjustment. So, changes can be made in the color, design, graphics or any other component to create a unique layout.
-
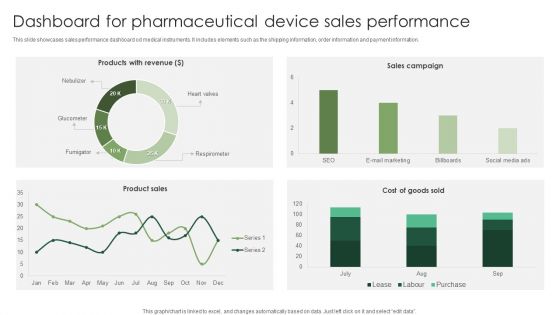
Dashboard For Pharmaceutical Device Sales Performance Graphics PDF
This slide showcases sales performance dashboard od medical instruments. It includes elements such as the shipping information, order information and payment information. Showcasing this set of slides titled Dashboard For Pharmaceutical Device Sales Performance Graphics PDF. The topics addressed in these templates are Pharmaceutical Device, Sales Performance. All the content presented in this PPT design is completely editable. Download it and make adjustments in color, background, font etc. as per your unique business setting.
-
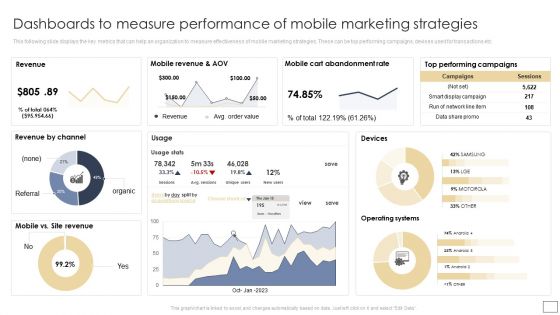
Dashboards To Measure Performance Of Mobile Marketing Strategies Graphics PDF
This following slide displays the key metrics that can help an organization to measure effectiveness of mobile marketing strategies. These can be top performing campaigns, devises used for transactions etc. There are so many reasons you need a Dashboards To Measure Performance Of Mobile Marketing Strategies Graphics PDF. The first reason is you can not spend time making everything from scratch, Thus, Slidegeeks has made presentation templates for you too. You can easily download these templates from our website easily.
-
Conformance Testing Performance Tracking Dashboard Compliance Assessment Ppt Layouts Graphics PDF
This slide depicts the conformance testing performance tracking dashboard by covering details of test case analysis, tests linked to requirements, test case breakdown, tests per requirement, and so on. If your project calls for a presentation, then Slidegeeks is your go-to partner because we have professionally designed, easy-to-edit templates that are perfect for any presentation. After downloading, you can easily edit Conformance Testing Performance Tracking Dashboard Compliance Assessment Ppt Layouts Graphics PDF and make the changes accordingly. You can rearrange slides or fill them with different images. Check out all the handy templates
-
Product And Services Promotion Marketing Performance Dashboard With Advertisement Graphics PDF
This graph or chart is linked to excel, and changes automatically based on data. Just left click on it and select Edit Data. Slidegeeks is here to make your presentations a breeze with Product And Services Promotion Marketing Performance Dashboard With Advertisement Graphics PDF With our easy-to-use and customizable templates, you can focus on delivering your ideas rather than worrying about formatting. With a variety of designs to choose from, youre sure to find one that suits your needs. And with animations and unique photos, illustrations, and fonts, you can make your presentation pop. So whether youre giving a sales pitch or presenting to the board, make sure to check out Slidegeeks first.
-
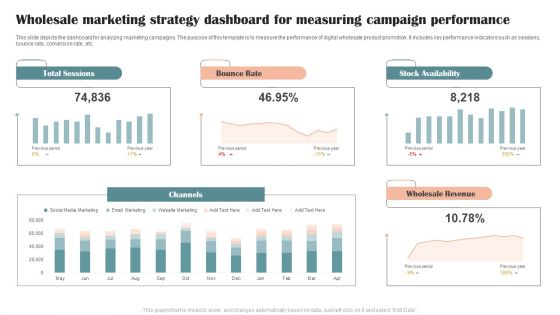
Wholesale Marketing Strategy Dashboard For Measuring Campaign Performance Graphics PDF
This slide depicts the dashboard for analyzing marketing campaigns. The purpose of this template is to measure the performance of digital wholesale product promotion. It includes key performance indicators such as sessions, bounce rate, conversion rate, etc. Showcasing this set of slides titled Wholesale Marketing Strategy Dashboard For Measuring Campaign Performance Graphics PDF. The topics addressed in these templates are Total Sessions, Bounce Rate, Stock Availability. All the content presented in this PPT design is completely editable. Download it and make adjustments in color, background, font etc. as per your unique business setting.
-
Product Quality Key Performance Assurance Indicator Dashboard Graphics PDF
Showcasing this set of slides titled Product Quality Key Performance Assurance Indicator Dashboard Graphics PDF. The topics addressed in these templates are Key Performance, Assurance Indicator, Dashboard. All the content presented in this PPT design is completely editable. Download it and make adjustments in color, background, font etc. as per your unique business setting.
-
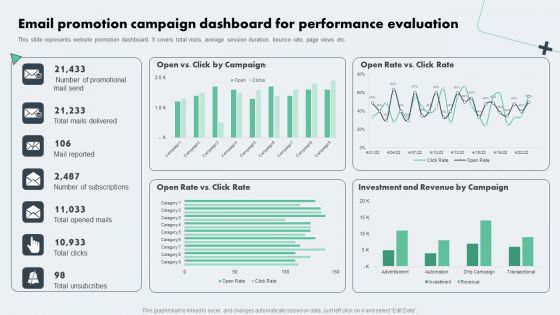
Deploying Online Marketing Email Promotion Campaign Dashboard For Performance Graphics PDF
This slide represents website promotion dashboard. It covers total visits, average session duration, bounce rate, page views etc. This Deploying Online Marketing Email Promotion Campaign Dashboard For Performance Graphics PDF is perfect for any presentation, be it in front of clients or colleagues. It is a versatile and stylish solution for organizing your meetings. The Deploying Online Marketing Email Promotion Campaign Dashboard For Performance Graphics PDF features a modern design for your presentation meetings. The adjustable and customizable slides provide unlimited possibilities for acing up your presentation. Slidegeeks has done all the homework before launching the product for you. So, dont wait, grab the presentation templates today.
-
Website Performance Dashboard For Online Business Planning Graphics PDF
This slide displays dashboard to analyze performance of ecommerce website to help company in strategic business planning. It includes KPIs such as search traffic, top searched items, visits, etc. Showcasing this set of slides titled Website Performance Dashboard For Online Business Planning Graphics PDF. The topics addressed in these templates are Marketing Channels, Bounce Race, Search Traffic. All the content presented in this PPT design is completely editable. Download it and make adjustments in color, background, font etc. as per your unique business setting.
-
Dashboard To Track Product Sales Performance Market Focused Product Launch Strategy Graphics PDF
This slide showcases dashboard that can help organization to analyse the sales of product after entering into niche market. Its key elements are sales, sales target, sales growth, sales by channel, inventory days outstanding etc. Do you have to make sure that everyone on your team knows about any specific topic I yes, then you should give Dashboard To Track Product Sales Performance Market Focused Product Launch Strategy Graphics PDF a try. Our experts have put a lot of knowledge and effort into creating this impeccable Dashboard To Track Product Sales Performance Market Focused Product Launch Strategy Graphics PDF. You can use this template for your upcoming presentations, as the slides are perfect to represent even the tiniest detail. You can download these templates from the Slidegeeks website and these are easy to edit. So grab these today
-
Strategic Guide For Positioning Expanded Brand KPI Dashboard To Measure Brand Marketing Performance Graphics PDF
Mentioned slide illustrates KPI dashboard that can be used by organizations to track the performance of their brand performance. Brand, advertising and purchase are the metrics covered in the dashboard. Are you in need of a template that can accommodate all of your creative concepts. This one is crafted professionally and can be altered to fit any style. Use it with Google Slides or PowerPoint. Include striking photographs, symbols, depictions, and other visuals. Fill, move around, or remove text boxes as desired. Test out color palettes and font mixtures. Edit and save your work, or work with colleagues. Download Strategic Guide For Positioning Expanded Brand KPI Dashboard To Measure Brand Marketing Performance Graphics PDF and observe how to make your presentation outstanding. Give an impeccable presentation to your group and make your presentation unforgettable.
-
KPI Dashboard To Track Logistics Center Performance Ppt Styles Graphic Images PDF
This slide shows the KPI dashboard for monitoring activities of logistics hub. It includes fleet status, delivery status, delivery by region, average loading time, etc. Showcasing this set of slides titled KPI Dashboard To Track Logistics Center Performance Ppt Styles Graphic Images PDF. The topics addressed in these templates are Fleet Status, Delivery Status, Delivery By Region. All the content presented in this PPT design is completely editable. Download it and make adjustments in color, background, font etc. as per your unique business setting.
-
Impact Of Flexible Working On Employees Performance Graphics PDF
The following slide showcases the impact of remote working on performance of the workforce. Employee productivity, job satisfaction, employee retention and absenteeism rate are the major factors that are mentioned in the slide along with key insights. The best PPT templates are a great way to save time, energy, and resources. Slidegeeks have 100 percent editable powerpoint slides making them incredibly versatile. With these quality presentation templates, you can create a captivating and memorable presentation by combining visually appealing slides and effectively communicating your message. Download Impact Of Flexible Working On Employees Performance Graphics PDF from Slidegeeks and deliver a wonderful presentation.
-
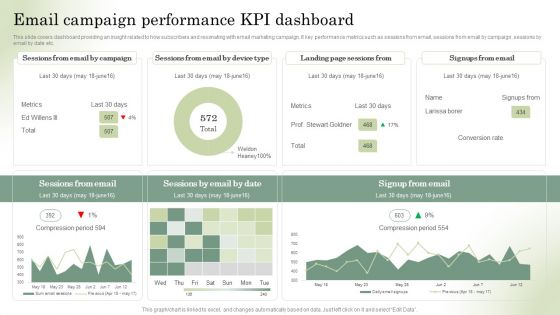
Optimizing Online Stores Email Campaign Performance KPI Dashboard Graphics PDF
This slide covers dashboard providing an insight related to how subscribers and resonating with email marketing campaign. It key performance metrics such as sessions from email, sessions from email by campaign, sessions by email by date etc. Crafting an eye-catching presentation has never been more straightforward. Let your presentation shine with this tasteful yet straightforward Optimizing Online Stores Email Campaign Performance KPI Dashboard Graphics PDF template. It offers a minimalistic and classy look that is great for making a statement. The colors have been employed intelligently to add a bit of playfulness while still remaining professional. Construct the ideal Optimizing Online Stores Email Campaign Performance KPI Dashboard Graphics PDF that effortlessly grabs the attention of your audience Begin now and be certain to wow your customers.
-
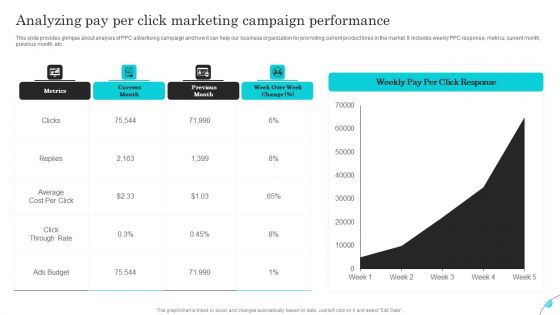
Analyzing Pay Per Click Marketing Campaign Performance Graphics PDF
This slide provides glimpse about analysis of PPC advertising campaign and how it can help our business organization for promoting current product lines in the market. It includes weekly PPC response, metrics, current month, previous month, etc. Find a pre designed and impeccable Analyzing Pay Per Click Marketing Campaign Performance Graphics PDF. The templates can ace your presentation without additional effort. You can download these easy to edit presentation templates to make your presentation stand out from others. So, what are you waiting for Download the template from Slidegeeks today and give a unique touch to your presentation.
-
Search Engine Marketing Develop Campaign Performance Tracking Framework Graphics PDF
The following slide depicts campaign performance management dashboard to measure the results. It includes elements such as conversions funnel, conversion rates, opportunity value, landing pages, sources google, twitter, Facebook etc. This Search Engine Marketing Develop Campaign Performance Tracking Framework Graphics PDF from Slidegeeks makes it easy to present information on your topic with precision. It provides customization options, so you can make changes to the colors, design, graphics, or any other component to create a unique layout. It is also available for immediate download, so you can begin using it right away. Slidegeeks has done good research to ensure that you have everything you need to make your presentation stand out. Make a name out there for a brilliant performance.
-
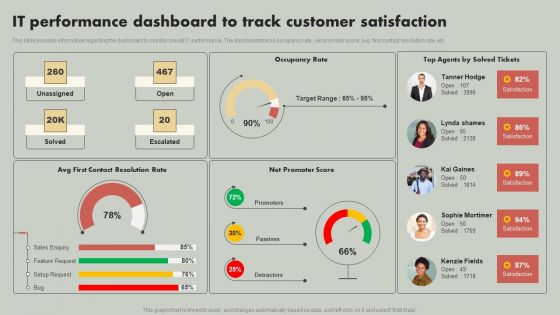
IT Reducing Costs And Management Tips IT Performance Dashboard To Track Customer Satisfaction Graphics PDF
This slide provides information regarding the dashboard to monitor overall IT performance. The dashboard tracks occupancy rate, net promoter score, avg. first contact resolution rate, etc. Formulating a presentation can take up a lot of effort and time, so the content and message should always be the primary focus. The visuals of the PowerPoint can enhance the presenters message, so our IT Reducing Costs And Management Tips IT Performance Dashboard To Track Customer Satisfaction Graphics PDF was created to help save time. Instead of worrying about the design, the presenter can concentrate on the message while our designers work on creating the ideal templates for whatever situation is needed. Slidegeeks has experts for everything from amazing designs to valuable content, we have put everything into IT Reducing Costs And Management Tips IT Performance Dashboard To Track Customer Satisfaction Graphics PDF
-
Process To Formulate Performance Marketing Campaign Ppt PowerPoint Presentation Diagram Graph Charts PDF
This slide showcases process that can help organization to formulate performance marketing campaign and run online targeted ads. Its key steps are - establish campaign objectives, determine marketing channels, run marketing campaigns and optimize campaigns Explore a selection of the finest Process To Formulate Performance Marketing Campaign Ppt PowerPoint Presentation Diagram Graph Charts PDF here. With a plethora of professionally designed and pre made slide templates, you can quickly and easily find the right one for your upcoming presentation. You can use our Process To Formulate Performance Marketing Campaign Ppt PowerPoint Presentation Diagram Graph Charts PDF to effectively convey your message to a wider audience. Slidegeeks has done a lot of research before preparing these presentation templates. The content can be personalized and the slides are highly editable. Grab templates today from Slidegeeks.
-
Deployment Of Process Automation To Increase Organisational Performance Dashboard For Monthly Graphics PDF
This slide presents a dashboard for monthly procurement activities in an organization. It includes number of suppliers, contract attainted, supplier share, top supplier report, average procurement cycle time, etc. Here you can discover an assortment of the finest PowerPoint and Google Slides templates. With these templates, you can create presentations for a variety of purposes while simultaneously providing your audience with an eye catching visual experience. Download Deployment Of Process Automation To Increase Organisational Performance Dashboard For Monthly Graphics PDF to deliver an impeccable presentation. These templates will make your job of preparing presentations much quicker, yet still, maintain a high level of quality. Slidegeeks has experienced researchers who prepare these templates and write high quality content for you. Later on, you can personalize the content by editing the Deployment Of Process Automation To Increase Organisational Performance Dashboard For Monthly Graphics PDF.
-
Chat Messenger Investor Funding Elevator Pitch Deck Financial Performance Graphics PDF
The slide outlines the financial performance highlighting the companys revenue and growth in revenue. This modern and well arranged Chat Messenger Investor Funding Elevator Pitch Deck Financial Performance Graphics PDF provides lots of creative possibilities. It is very simple to customize and edit with the Powerpoint Software. Just drag and drop your pictures into the shapes. All facets of this template can be edited with Powerpoint no extra software is necessary. Add your own material, put your images in the places assigned for them, adjust the colors, and then you can show your slides to the world, with an animated slide included.
-
Umbrella Branding Measures To Boost Brand Awareness Corporate Branding Performance Tracking Dashboard Graphics PDF
This slide provides information regarding corporate branding performance tracking dashboard in terms of leads, conversion metrics, web traffic, etc. Find highly impressive Umbrella Branding Measures To Boost Brand Awareness Corporate Branding Performance Tracking Dashboard Graphics PDF on Slidegeeks to deliver a meaningful presentation. You can save an ample amount of time using these presentation templates. No need to worry to prepare everything from scratch because Slidegeeks experts have already done a huge research and work for you. You need to download Umbrella Branding Measures To Boost Brand Awareness Corporate Branding Performance Tracking Dashboard Graphics PDF for your upcoming presentation. All the presentation templates are 100 percent editable and you can change the color and personalize the content accordingly. Download now
-
Monthly Sites Sales Performance Assessment Graph Designs PDF
Mentioned slide shows comparative assessment of various business sites to determine best performance location. It includes elements such as targeted sales, actual sales and monthly wise sales on sites. Pitch your topic with ease and precision using this Monthly Sites Sales Performance Assessment Graph Designs PDF. This layout presents information on Sales Performance, Sales Targets, Performance Assessment Graph . It is also available for immediate download and adjustment. So, changes can be made in the color, design, graphics or any other component to create a unique layout.


