Performance graph PowerPoint Presentation Templates and Google Slides
-
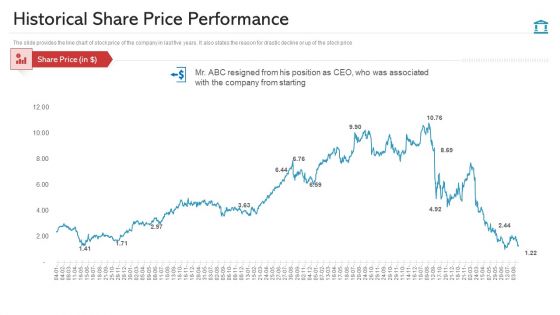
Historical Share Price Performance Graphics PDF
The slide provides the line chart of stock price of the company in last five years. It also states the reason for drastic decline or up of the stock price Deliver and pitch your topic in the best possible manner with this historical share price performance graphics pdf. Use them to share invaluable insights on historical share price performance and impress your audience. This template can be altered and modified as per your expectations. So, grab it now.
-
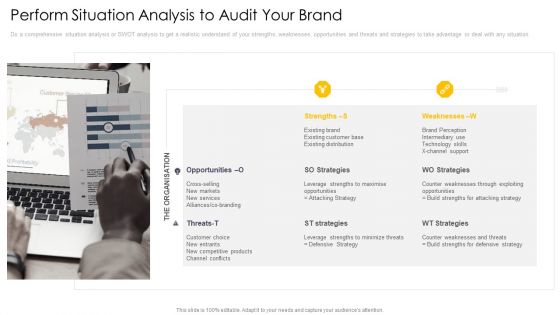
Cross Channel Marketing Communications Initiatives Perform Situation Analysis To Audit Your Brand Graphics PDF
Do a comprehensive situation analysis or SWOT analysis to get a realistic understand of your strengths, weaknesses, opportunities and threats and strategies to take advantage or deal with any situation. This is a cross channel marketing communications initiatives perform situation analysis to audit your brand graphics pdf template with various stages. Focus and dispense information on one stage using this creative set, that comes with editable features. It contains large content boxes to add your information on topics like opportunities, threats, strategies, strengths, weaknesses. You can also showcase facts, figures, and other relevant content using this PPT layout. Grab it now.
-
AI And ML Driving Monetary Value For Organization KPI Dashboard To Monitor Business Performance Graphics PDF
Following slide shows business performance dashboard. It covers KPIs such as revenue generated, projected revenue, marketing expenses, satisfaction rate and tickets volume by priority. Deliver and pitch your topic in the best possible manner with this ai and ml driving monetary value for organization kpi dashboard to monitor business performance graphics pdf. Use them to share invaluable insights on business offerings, current impact, product innovations, customer service and impress your audience. This template can be altered and modified as per your expectations. So, grab it now.
-
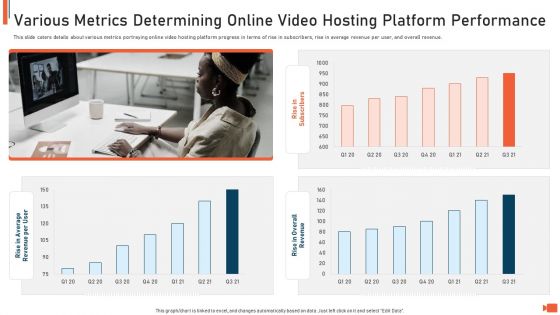
Various Metrics Determining Online Video Hosting Platform Performance Graphics PDF
Deliver and pitch your topic in the best possible manner with this various metrics determining online video hosting platform performance graphics pdf. Use them to share invaluable insights on various metrics determining online video hosting platform performance and impress your audience. This template can be altered and modified as per your expectations. So, grab it now.
-
Key Performance Indicators Of ABC Carbonated Drink Company With Future Targets Graphics PDF
Deliver and pitch your topic in the best possible manner with this key performance indicators of abc carbonated drink company with future targets graphics pdf. Use them to share invaluable insights on administrative expenses, warehouses worldwide, performance indicators and impress your audience. This template can be altered and modified as per your expectations. So, grab it now.
-
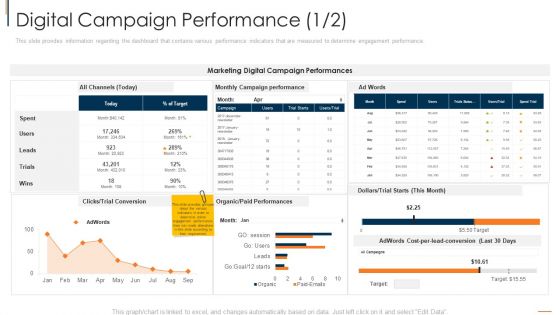
Online Consumer Engagement Digital Campaign Performance Target Graphics PDF
This slide provides information regarding the dashboard that contains various performance indicators that are measured to determine engagement performance. Deliver an awe inspiring pitch with this creative online consumer engagement digital campaign performance target graphics pdf bundle. Topics like performances, marketing digital, target can be discussed with this completely editable template. It is available for immediate download depending on the needs and requirements of the user.
-
Devops Software Performance Metrics Ppt Inspiration Graphic Tips PDF
This template covers software performance metrics for devOps based on functional validation, integration testing and end to end regression testing. Deliver an awe inspiring pitch with this creative KEYWORDFROMSLIDESSS bundle. Topics like devops software performance metrics ppt inspiration graphic tips pdf can be discussed with this completely editable template. It is available for immediate download depending on the needs and requirements of the user.
-
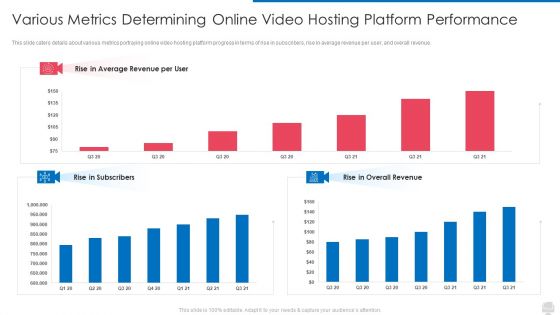
Online Video Streaming Site Capital Raising Elevator Various Metrics Determining Online Video Hosting Platform Performance Graphics PDF
This slide caters details about various metrics portraying online video hosting platform progress in terms of rise in subscribers, rise in average revenue per user, and overall revenue. Deliver an awe inspiring pitch with this creative online video streaming site capital raising elevator various metrics determining online video hosting platform performance graphics pdf bundle. Topics like rise in overall revenue, rise in subscribers, rise in average revenue per user can be discussed with this completely editable template. It is available for immediate download depending on the needs and requirements of the user.
-
Employee Journey In Company Employee Performance Review Process Graphics PDF
This slide covers the employee performance review process which starts with the human resource, employee, evaluator and finally administrator. Presenting employee journey in company employee performance review process graphics pdf to provide visual cues and insights. Share and navigate important information on fours stages that need your due attention. This template can be used to pitch topics like administrator, evaluator, employee, human resources. In addtion, this PPT design contains high resolution images, graphics, etc, that are easily editable and available for immediate download.
-
Enhancing B2B Demand Creation And Sales Growth Overall Performance Improvement Across B2B Graphics PDF
This slide provides information regarding improved overall performance in terms of increased revenue generation, improved lead generation and enhanced sales and marketing alignment. Deliver and pitch your topic in the best possible manner with this enhancing b2b demand creation and sales growth overall performance improvement across b2b graphics pdf. Use them to share invaluable insights on sales and marketing, revenues, social media and impress your audience. This template can be altered and modified as per your expectations. So, grab it now.
-
Corporate Social Responsibility Dashboard Highlighting Operational Performance Improvements Graphics PDF
Persuade your audience using this corporate social responsibility dashboard highlighting operational performance improvements graphics pdf. This PPT design covers three stages, thus making it a great tool to use. It also caters to a variety of topics including operational performance, materials innovations, social responsibility. Download this PPT design now to present a convincing pitch that not only emphasizes the topic but also showcases your presentation skills.
-
Organizational Key Performance Indicator Tree Depicting Market And Company Revenue Graphics PDF
Presenting organizational key performance indicator tree depicting market and company revenue graphics pdf to dispense important information. This template comprises three stages. It also presents valuable insights into the topics including total market revenue, company revenue, increase market share. This is a completely customizable PowerPoint theme that can be put to use immediately. So, download it and address the topic impactfully.
-
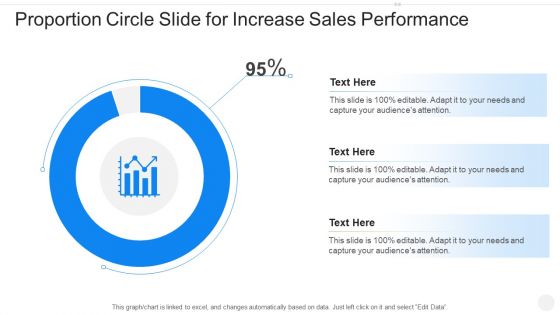
Proportion Circle Slide For Increase Sales Performance Graphics PDF
Showcasing this set of slides titled proportion circle slide for increase sales performance graphics pdf. The topics addressed in these templates are proportion circle slide for increase sales performance. All the content presented in this PPT design is completely editable. Download it and make adjustments in color, background, font etc. as per your unique business setting.
-
Series B Capital Investment Key Performance Highlights And Sales Channels Ppt Model Graphics Download PDF
Following slide displays key statistics about companys performance highlight along with the information about sales channels and their share in volume for insurance policies. Deliver and pitch your topic in the best possible manner with this series b capital investment key performance highlights and sales channels ppt model graphics download pdf. Use them to share invaluable insights on insurance premium, sales and impress your audience. This template can be altered and modified as per your expectations. So, grab it now.
-
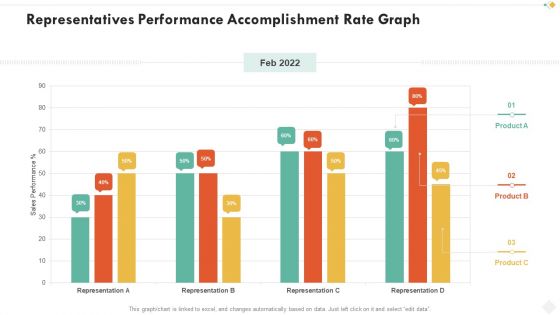
Representatives Performance Accomplishment Rate Graph Template PDF
Showcasing this set of slides titled representatives performance accomplishment rate graph template pdf. The topics addressed in these templates are representatives performance accomplishment rate graph. All the content presented in this PPT design is completely editable. Download it and make adjustments in color, background, font etc. as per your unique business setting.
-
SFA Campaign Performance Icon Ppt PowerPoint Presentation Gallery Graphics Pictures PDF
Presenting sfa campaign performance icon ppt powerpoint presentation gallery graphics pictures pdf to dispense important information. This template comprises three stages. It also presents valuable insights into the topics including sfa campaign performance icon. This is a completely customizable PowerPoint theme that can be put to use immediately. So, download it and address the topic impactfully.
-
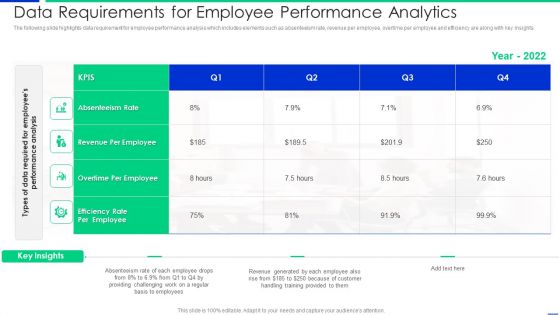
Data Requirements For Employee Performance Analytics Graphics PDF
The following slide highlights data requirement for employee performance analysis which includes elements such as absenteeism rate, revenue per employee, overtime per employee and efficiency are along with key insights. Pitch your topic with ease and precision using this data requirements for employee performance analytics graphics pdf. This layout presents information on revenue, employee, rate. It is also available for immediate download and adjustment. So, changes can be made in the color, design, graphics or any other component to create a unique layout.
-
Company Performance Dashboard Icon With Bar Graph Template PDF
Persuade your audience using this company performance dashboard icon with bar graph template pdf. This PPT design covers four stages, thus making it a great tool to use. It also caters to a variety of topics including company performance dashboard icon with bar graph. Download this PPT design now to present a convincing pitch that not only emphasizes the topic but also showcases your presentation skills.
-
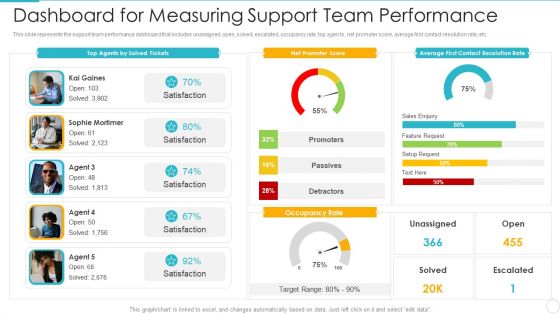
Improving Employee Performance Management System In Organization Dashboard For Measuring Support Graphics PDF
his slide represents the support team performance dashboard that includes unassigned, open, solved, escalated, occupancy rate, top agen ts, net promoter score, average first contact resolution rate, etc.This is a improving employee performance management system in organization dashboard for measuring support graphics pdf template with various stages. Focus and dispense information on one stage using this creative set, that comes with editable features. It contains large content boxes to add your information on topics like dashboard for measuring support team performance You can also showcase facts, figures, and other relevant content using this PPT layout. Grab it now.
-
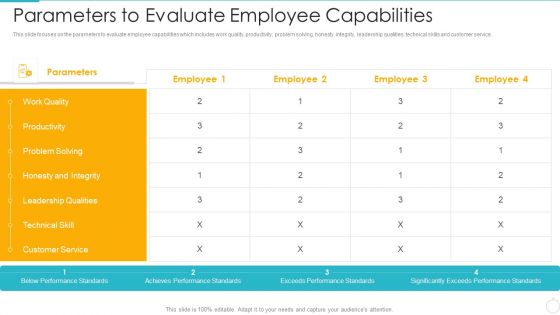
Improving Employee Performance Management System In Organization Parameters To Evaluate Employee Capabilities Graphics PDF
This slide focuses on the parameters to evaluate employee capabilities which includes work quality, productivity, problem solving, honesty, integrity, leadership qualities, technical skills and customer service.Deliver and pitch your topic in the best possible manner with this improving employee performance management system in organization parameters to evaluate employee capabilities graphics pdf Use them to share invaluable insights on problem solving, honesty and integrity, leadership qualities and impress your audience. This template can be altered and modified as per your expectations. So, grab it now.
-
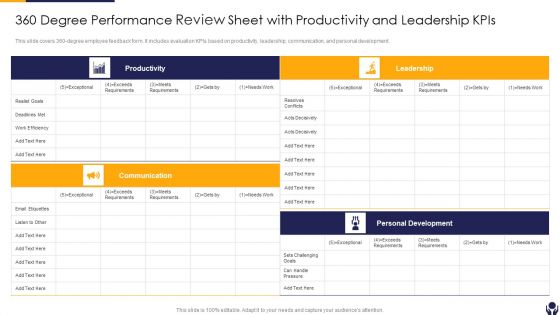
360 Degree Performance Review Sheet With Productivity And Leadership Kpis Graphics PDF
This slide covers 360 degree employee feedback form. It includes evaluation KPIs based on productivity, leadership, communication, and personal development. Showcasing this set of slides titled 360 Degree Performance Review Sheet With Productivity And Leadership Kpis Graphics PDF The topics addressed in these templates are Productivity, Communication, Personal Development All the content presented in this PPT design is completely editable. Download it and make adjustments in color, background, font etc. as per your unique business setting.
-
Healthcare Hospital Performance Data Scorecard With Bed Occupancy Rate Ppt Professional Graphics Tutorials PDF
This graphor chart is linked to excel, and changes automatically based on data. Just left click on it and select Edit Data. Deliver an awe inspiring pitch with this creative Healthcare Hospital Performance Data Scorecard With Bed Occupancy Rate Ppt Professional Graphics Tutorials PDF bundle. Topics like Bed Occupancy Rate, Average Length Stay, Asset Utilization Rate can be discussed with this completely editable template. It is available for immediate download depending on the needs and requirements of the user.
-
Steps Involved In Performance Benchmarking Procedure Graphics PDF
This slide shows the steps involved in performance benchmarking process which includes planning, data collection, analysis, implementation and ongoing evaluation that helps the company in analysing the performance gaps in respect of best performing companies.Presenting Steps Involved In Performance Benchmarking Procedure Graphics PDF to dispense important information. This template comprises five stages. It also presents valuable insights into the topics including Planning, Data Collection, Analysis. This is a completely customizable PowerPoint theme that can be put to use immediately. So, download it and address the topic impactfully.
-
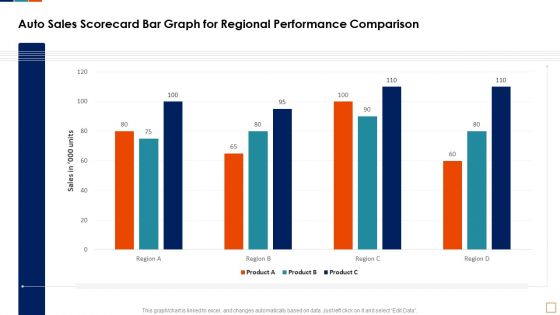
Auto Sales Scorecard Bar Graph For Regional Performance Comparison Infographics PDF
This graph or chart is linked to excel, and changes automatically based on data. Just left click on it and select Edit Data. Deliver an awe inspiring pitch with this creative Auto Sales Scorecard Bar Graph For Regional Performance Comparison Infographics PDF bundle. Topics like Auto Sales Scorecard, Bar Graph Regional, Performance Comparison Product can be discussed with this completely editable template. It is available for immediate download depending on the needs and requirements of the user.
-
Shipment Supplier Scorecard With Delivery Performance Rating Ppt Ideas Graphic Tips PDF
This graph or chart is linked to excel, and changes automatically based on data. Just left click on it and select Edit Data. Deliver an awe inspiring pitch with this creative Shipment Supplier Scorecard With Delivery Performance Rating Ppt Ideas Graphic Tips PDF bundle. Topics like On Time Performance, Actual Vs Target, Goods Days Hand can be discussed with this completely editable template. It is available for immediate download depending on the needs and requirements of the user.
-
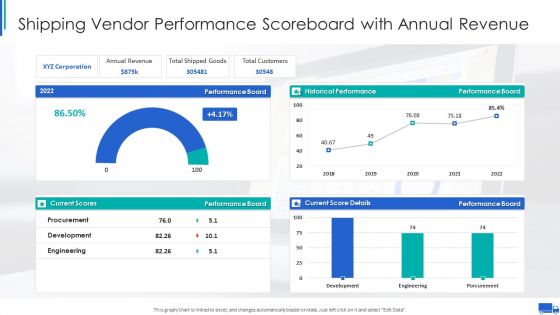
Shipping Vendor Performance Scoreboard With Annual Revenue Ppt Infographics Graphics PDF
This graph or chart is linked to excel, and changes automatically based on data. Just left click on it and select Edit Data. Deliver an awe inspiring pitch with this creative Shipping Vendor Performance Scoreboard With Annual Revenue Ppt Infographics Graphics PDF bundle. Topics like Annual Revenue Board, Total Shipped Goods, Total Customers Performance can be discussed with this completely editable template. It is available for immediate download depending on the needs and requirements of the user.
-
Agenda For Quality Assurance Transformation Strategies To Improve Business Performance Efficiency Graphics PDF
This is a agenda for quality assurance transformation strategies to improve business performance efficiency graphics pdf template with various stages. Focus and dispense information on five stages using this creative set, that comes with editable features. It contains large content boxes to add your information on topics like qa transformation testing tools, cross platform compatibility, customer experience testing. You can also showcase facts, figures, and other relevant content using this PPT layout. Grab it now.
-
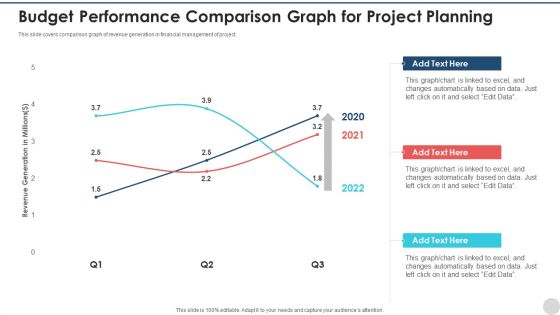
Budget Performance Comparison Graph For Project Planning Pictures PDF
This slide covers comparison graph of revenue generation in financial management of project. Showcasing this set of slides titled budget performance comparison graph for project planning pictures pdf. The topics addressed in these templates are budget performance comparison graph for project planning. All the content presented in this PPT design is completely editable. Download it and make adjustments in color, background, font etc. as per your unique business setting.
-
Staff Performance Evaluation Icon With Rising Graph Summary PDF
Presenting staff performance evaluation icon with rising graph summary pdf to dispense important information. This template comprises three stages. It also presents valuable insights into the topics including staff performance evaluation icon with rising graph. This is a completely customizable PowerPoint theme that can be put to use immediately. So, download it and address the topic impactfully.
-
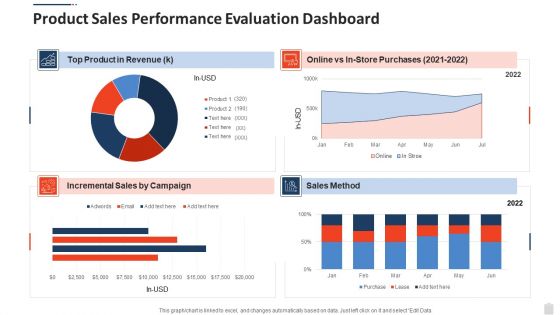
Product Sales Performance Evaluation Dashboard Graphics PDF
Pitch your topic with ease and precision using this product sales performance evaluation dashboard graphics pdf. This layout presents information on product sales performance evaluation dashboard. It is also available for immediate download and adjustment. So, changes can be made in the color, design, graphics or any other component to create a unique layout.
-
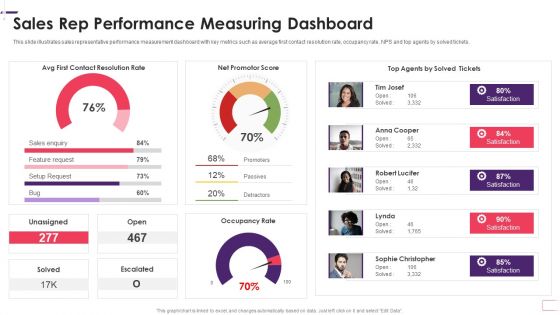
Enhancing Stp Strategies For A Successful Market Promotion Sales Rep Performance Graphics PDF
This slide illustrates sales representative performance measurement dashboard with key metrics such as average first contact resolution rate, occupancy rate, NPS and top agents by solved tickets. Deliver and pitch your topic in the best possible manner with this enhancing stp strategies for a successful market promotion sales rep performance graphics pdf. Use them to share invaluable insights on sales rep performance measuring dashboard and impress your audience. This template can be altered and modified as per your expectations. So, grab it now.
-
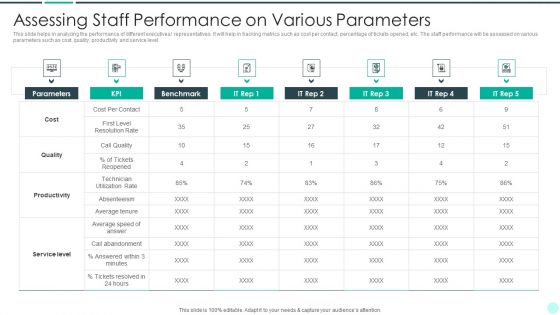
Executing Advance Data Analytics At Workspace Assessing Staff Performance Graphics PDF
This slide helps in analyzing the performance of different executives representatives. It will help in tracking metrics such as cost per contact, percentage of tickets opened, etc. The staff performance will be assessed on various parameters such as cost, quality, productivity and service level. Deliver and pitch your topic in the best possible manner with this executing advance data analytics at workspace assessing staff performance graphics pdf. Use them to share invaluable insights on assessing staff performance on various parameters and impress your audience. This template can be altered and modified as per your expectations. So, grab it now.
-
Deploying Quality Assurance QA Transformation QA Key Performance Indicators Before Strategy Graphics PDF
This slide shows the QA Quality Assurance Key Performance Indicators before Strategy Implementation. These stats are related to Active Defect Rate, Automated Testing Rate, Product Quality, Overall Team Effectiveness, Average Product Delivery Time etc. from the years 2020 to 2022 along with key takeaways.Deliver an awe inspiring pitch with this creative Deploying Quality Assurance QA Transformation QA Key Performance Indicators Before Strategy Graphics PDF bundle. Topics like Performance Indicators, Automated Testing, Overall Team Effectiveness can be discussed with this completely editable template. It is available for immediate download depending on the needs and requirements of the user.
-
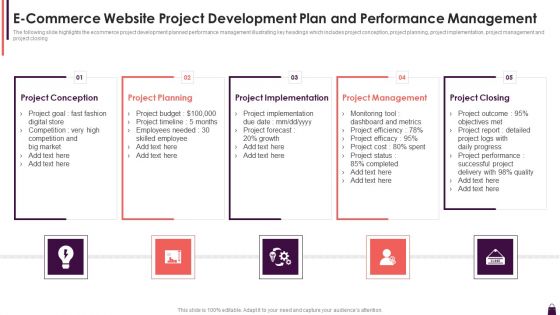
E Commerce Website Project Development Plan And Performance Management Graphics PDF
The following slide highlights the ecommerce project development planned performance management illustrating key headings which includes project conception, project planning, project implementation, project management and project closing Presenting E Commerce Website Project Development Plan And Performance Management Graphics PDF to dispense important information. This template comprises five stages. It also presents valuable insights into the topics including Project Planning, Project Implementation, Project Management. This is a completely customizable PowerPoint theme that can be put to use immediately. So, download it and address the topic impactfully.
-
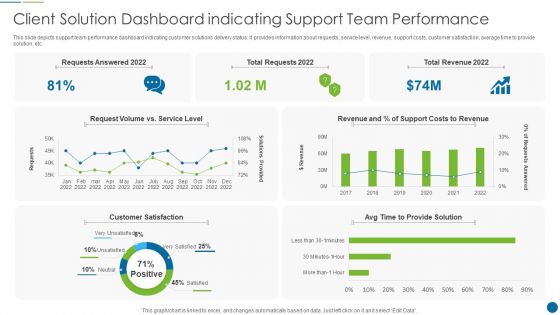
Client Solution Dashboard Indicating Support Team Performance Graphics PDF
This slide depicts support team performance dashboard indicating customer solutions delivery status. It provides information about requests, service level, revenue, support costs, customer satisfaction, average time to provide solution, etc. Showcasing this set of slides titled Client Solution Dashboard Indicating Support Team Performance Graphics PDF. The topics addressed in these templates are Costs, Revenue, Customer. All the content presented in this PPT design is completely editable. Download it and make adjustments in color, background, font etc. as per your unique business setting.
-
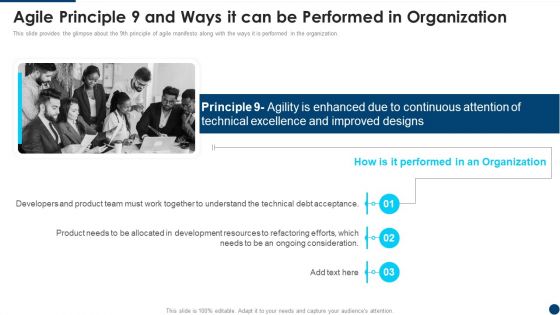
Manifesto Agile Application Agile Principle 9 And Ways It Can Be Performed Graphics PDF
This slide provides the glimpse about the 9th principle of agile manifesto along with the ways it is performed in the organization. This is a Manifesto Agile Application Agile Principle 9 And Ways It Can Be Performed Graphics PDF template with various stages. Focus and dispense information on three stages using this creative set, that comes with editable features. It contains large content boxes to add your information on topics like Continuous Attention, Agility Enhanced, Performed Organization, Product Needs. You can also showcase facts, figures, and other relevant content using this PPT layout. Grab it now.
-
Defined Sales Assistance For Business Clients Overall Performance Improvement Graphics PDF
This slide provides information regarding improved overall performance in terms of increased revenue generation, improved lead generation and enhanced sales and marketing alignment. Deliver an awe inspiring pitch with this creative Defined Sales Assistance For Business Clients Overall Performance Improvement Graphics PDF bundle. Topics like Revenue Generation, Client Engagement Rate, Sales And Marketing Alignment can be discussed with this completely editable template. It is available for immediate download depending on the needs and requirements of the user.
-
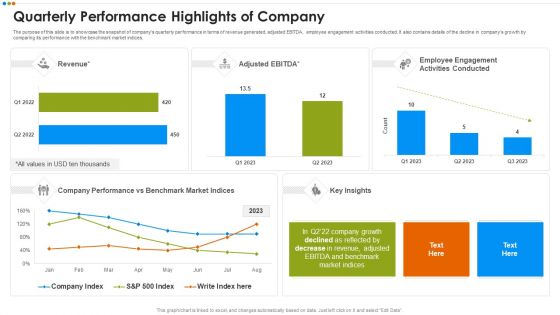
Quarterly Budget Analysis Of Business Organization Quarterly Performance Highlights Of Company Graphics PDF
The purpose of this slide is to showcase the snapshot of companys quarterly performance in terms of revenue generated, adjusted EBITDA, employee engagement activities conducted. It also contains details of the decline in companys growth by comparing its performance with the benchmark market indices.This is a Quarterly Budget Analysis Of Business Organization Quarterly Performance Highlights Of Company Graphics PDF template with various stages. Focus and dispense information on two stages using this creative set, that comes with editable features. It contains large content boxes to add your information on topics like Quarterly Performance Highlights Of Company You can also showcase facts, figures, and other relevant content using this PPT layout. Grab it now.
-
Performance Analysis Of New Product Development Global Presence Of Logistics Company Graphics PDF
This slide caters details about global presence of logistics company in terms of its distribution facilities, customers, countries and territories catered. This is a performance analysis of new product development global presence of logistics company graphics pdf template with various stages. Focus and dispense information on four stages using this creative set, that comes with editable features. It contains large content boxes to add your information on topics like global presence of logistics company. You can also showcase facts, figures, and other relevant content using this PPT layout. Grab it now.
-
Approaches For New Product Release Sales Performance Over Last Three Years Graphics PDF
This slide shows bar graph that demonstrating sales performance of top products over last three years along with region wise sales data Deliver an awe inspiring pitch with this creative approaches for new product release sales performance over last three years graphics pdf bundle. Topics like sales performance over last three years can be discussed with this completely editable template. It is available for immediate download depending on the needs and requirements of the user.
-
Before Vs After Cdn Implementation Performance Dashboard Ppt Show Graphics Download PDF
This slide depicts a comparative dashboard for before and after CDN implementation based on the cache miss, cache hit, latency, and memory utilization. Deliver an awe inspiring pitch with this creative before vs after cdn implementation performance dashboard ppt show graphics download pdf bundle. Topics like before vs after cdn implementation performance dashboard can be discussed with this completely editable template. It is available for immediate download depending on the needs and requirements of the user.
-
Performance As Pillar Of Cdn Design Ppt Layouts Graphics Pictures PDF
This slide describes the performance as a pillar of CDN design, such as its primary goal is to reduce delaying, and the critical factor is to consider the physical environment. Deliver and pitch your topic in the best possible manner with this performance as pillar of cdn design ppt layouts graphics pictures pdf. Use them to share invaluable insights on performance as pillar of cdn design and impress your audience. This template can be altered and modified as per your expectations. So, grab it now.
-
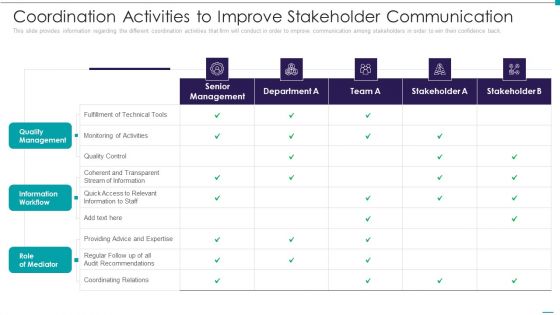
Enhance Performance Of Workforce Coordination Activities To Improve Stakeholder Communication Graphics PDF
This slide provides information regarding the different coordination activities that firm will conduct in order to improve communication among stakeholders in order to win their confidence back. Deliver an awe inspiring pitch with this creative enhance performance of workforce coordination activities to improve stakeholder communication graphics pdf bundle. Topics like quality management, information workflow, role of mediator can be discussed with this completely editable template. It is available for immediate download depending on the needs and requirements of the user.
-
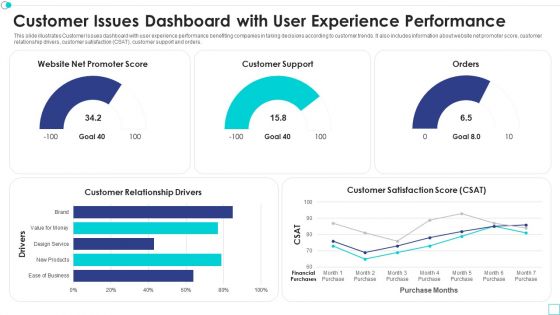
Customer Issues Dashboard With User Experience Performance Graphics PDF
This slide illustrates Customer Issues dashboard with user experience performance benefiting companies in taking decisions according to customer trends. It also includes information about website net promoter score, customer relationship drivers, customer satisfaction CSAT, customer support and orders. Showcasing this set of slides titled customer issues dashboard with user experience performance graphics pdf. The topics addressed in these templates are customer issues dashboard with user experience performance. All the content presented in this PPT design is completely editable. Download it and make adjustments in color, background, font etc. as per your unique business setting.
-
Sales Rep Scorecard Sales Representatives Scorecard Bar Graph For Sku Performance Comparison Clipart PDF
Deliver an awe inspiring pitch with this creative sales rep scorecard sales representatives scorecard bar graph for sku performance comparison clipart pdf bundle. Topics like sales representatives scorecard bar graph for sku performance comparison can be discussed with this completely editable template. It is available for immediate download depending on the needs and requirements of the user.
-
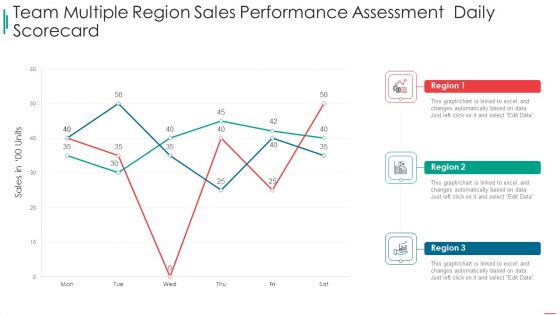
Sales Rep Scorecard Team Multiple Region Sales Performance Assessment Daily Scorecard Graphics PDF
Deliver an awe inspiring pitch with this creative sales rep scorecard team multiple region sales performance assessment daily scorecard graphics pdf bundle. Topics like team multiple region sales performance assessment daily scorecard can be discussed with this completely editable template. It is available for immediate download depending on the needs and requirements of the user.
-
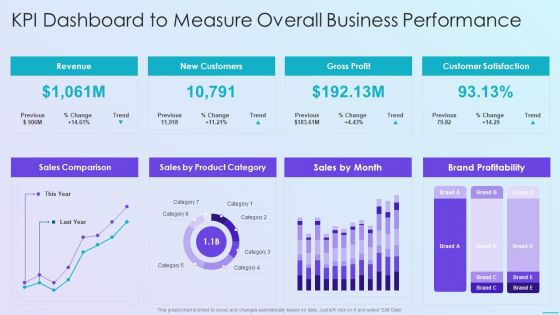
Playbook For Application Developers KPI Dashboard To Measure Overall Business Performance Graphics PDF
Deliver and pitch your topic in the best possible manner with this playbook for application developers kpi dashboard to measure overall business performance graphics pdf Use them to share invaluable insights on kpi dashboard to measure overall business performance and impress your audience. This template can be altered and modified as per your expectations. So, grab it now.
-
Effective Sales Technique For New Product Launch KPI Dashboard To Monitor Sales Performance Graphics PDF
This slide shows sales performance monitoring dashboard. Metrics included in the dashboard are sales revenue, sales growth, average revenue per unit, customer lifetime value and customer acquisition cost.Deliver an awe inspiring pitch with this creative Effective Sales Technique For New Product Launch KPI Dashboard To Monitor Sales Performance Graphics PDF bundle. Topics like Country Performance, Average Revenue, Customer Acquisition can be discussed with this completely editable template. It is available for immediate download depending on the needs and requirements of the user.
-
Monthly Sales Report Performance Scorecard Icon Graphics PDF
Presenting Monthly Sales Report Performance Scorecard Icon Graphics PDFC to provide visual cues and insights. Share and navigate important information on four stages that need your due attention. This template can be used to pitch topics like Scorecard Icon, Monthly Sales, Report Performance. In addtion, this PPT design contains high resolution images, graphics, etc, that are easily editable and available for immediate download.
-
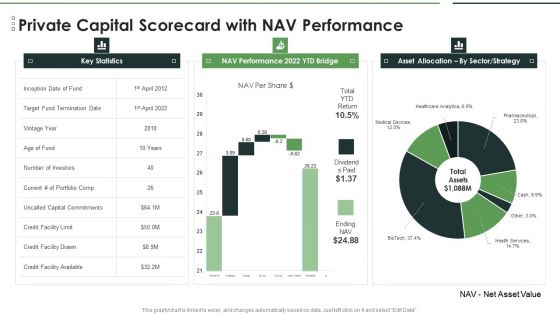
Private Capital Scorecard With Nav Performance Graphics PDF
Deliver an awe inspiring pitch with this creative Private Capital Scorecard With Nav Performance Graphics PDF bundle. Topics like Asset Allocation, Capital Commitments, Credit Facility can be discussed with this completely editable template. It is available for immediate download depending on the needs and requirements of the user.
-
Capacity Allotment Management Icon To Optimize Business Performance Graphics PDF
Persuade your audience using this Capacity Allotment Management Icon To Optimize Business Performance Graphics PDF. This PPT design covers three stages, thus making it a great tool to use. It also caters to a variety of topics including Capacity Allotment Management, Optimize Business Performance. Download this PPT design now to present a convincing pitch that not only emphasizes the topic but also showcases your presentation skills.
-
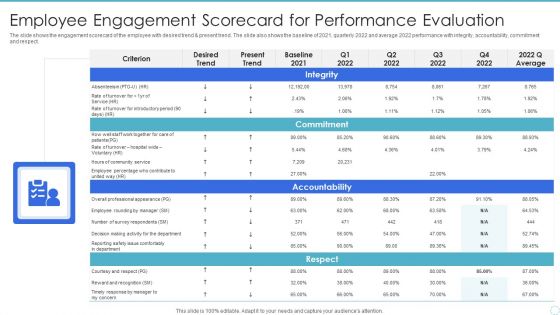
Employee Engagement Scorecard For Performance Evaluation Graphics PDF
The slide shows the engagement scorecard of the employee with desired trend and present trend. The slide also shows the baseline of 2021, quarterly 2022 and average 2022 performance with integrity, accountability, commitment and respect. Showcasing this set of slides titled Employee Engagement Scorecard For Performance Evaluation Graphics PDF. The topics addressed in these templates are Community Service, Accountability, Survey Respondents. All the content presented in this PPT design is completely editable. Download it and make adjustments in color, background, font etc. as per your unique business setting.
-
Importance Of Performance Improvement Plan In Organization Graphics PDF
Presenting Importance Of Performance Improvement Plan In Organization Graphics PDF to dispense important information. This template comprises four stages. It also presents valuable insights into the topics including Clear Organizational Goals, Proper Communication, Determining Strategic. This is a completely customizable PowerPoint theme that can be put to use immediately. So, download it and address the topic impactfully.
-
Call Center Agent Quality Assurance Balanced Scorecard Template With Branch Performance Graphics PDF
Deliver and pitch your topic in the best possible manner with this Call Center Agent Quality Assurance Balanced Scorecard Template With Branch Performance Graphics PDF Use them to share invaluable insights on Agent Quality, Assurance Balanced, Scorecard Template and impress your audience. This template can be altered and modified as per your expectations. So, grab it now.
-
Procurement KPI Performance Benchmark Graphics PDF
This slide covers the procurement performance benchmarks for the organizations such as spend under management, cost avoidance, vender performance etc. Deliver and pitch your topic in the best possible manner with this Procurement KPI Performance Benchmark Graphics PDF. Use them to share invaluable insights on Cost Savings, Vendor Performance, Total Cost and impress your audience. This template can be altered and modified as per your expectations. So, grab it now.
-
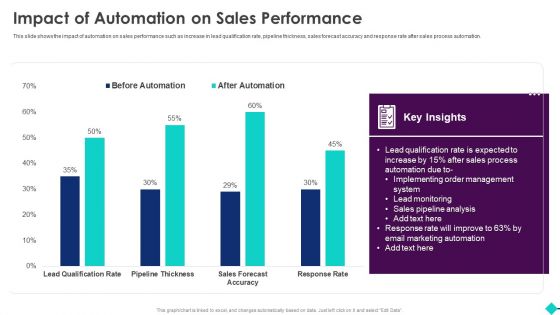
Sales Process Automation For Revenue Growth Impact Of Automation On Sales Performance Graphics PDF
This slide shows the impact of automation on sales performance such as increase in lead qualification rate, pipeline thickness, sales forecast accuracy and response rate after sales process automation.Deliver an awe inspiring pitch with this creative Sales Process Automation For Revenue Growth Impact Of Automation On Sales Performance Graphics PDF bundle. Topics like Lead Qualification, Order Management, Marketing Automation can be discussed with this completely editable template. It is available for immediate download depending on the needs and requirements of the user.
-
Workforce Department Performance Graph Ppt Model Graphics Pictures PDF
This slide shows performance graph of HR department. Information covered in this slide is related to total hirings and turnover in the last four years. Pitch your topic with ease and precision using this Workforce Department Performance Graph Ppt Model Graphics Pictures PDF. This layout presents information on New Hiring, Continuous Increase, Employee Turnover, 2019 To 2022. It is also available for immediate download and adjustment. So, changes can be made in the color, design, graphics or any other component to create a unique layout.
-
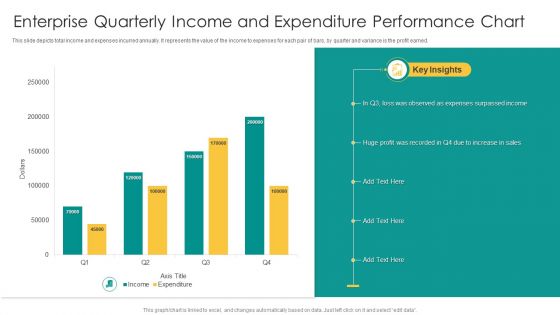
Enterprise Quarterly Income And Expenditure Performance Chart Graphics PDF
This slide depicts total income and expenses incurred annually. It represents the value of the income to expenses for each pair of bars, by quarter and variance is the profit earned. Pitch your topic with ease and precision using this Enterprise Quarterly Income And Expenditure Performance Chart Graphics PDF. This layout presents information on Expenses Surpassed Income, Sales, Huge Profit. It is also available for immediate download and adjustment. So, changes can be made in the color, design, graphics or any other component to create a unique layout.
-
Trend Of Quarterly Funding For Start Up Project Performance Chart Graphics PDF
This slide depicts investment made in different start up projects for 2 years. It also includes the investment amount, funding quarters in graphical form with a trend line and insights. Pitch your topic with ease and precision using this Trend Of Quarterly Funding For Start Up Project Performance Chart Graphics PDF. This layout presents information on Good Management, Efficient Team, Investment Decreased. It is also available for immediate download and adjustment. So, changes can be made in the color, design, graphics or any other component to create a unique layout.
-
Marketing And Operation Planning Dashboard To Drive Better Performance Graphics PDF
This slide covers sales and operations planning dashboard to improve performance. It involves bookings plan, year on year growth, bookings plan per year and total growth and sales made by sales manager. Showcasing this set of slides titled Marketing And Operation Planning Dashboard To Drive Better Performance Graphics PDF. The topics addressed in these templates are Sales Manager, Growth Made, Bookings Plan By Year. All the content presented in this PPT design is completely editable. Download it and make adjustments in color, background, font etc. as per your unique business setting.


