Dashboard infographic PowerPoint Presentation Templates and Google Slides
-
Client Acquisition Cost For Customer Retention Search Engine Marketing Dashboard For CAC Calculation Infographics PDF
This slide shows a Search Engine Marketing Dashboard with details such as lead form paid search, CAC, top performing campaigns, cost per conversion, cost per click etc. Deliver an awe inspiring pitch with this creative client acquisition cost for customer retention search engine marketing dashboard for cac calculation infographics pdf bundle. Topics like performing, campaign, social media, marketing, customer acquisition cost can be discussed with this completely editable template. It is available for immediate download depending on the needs and requirements of the user.
-
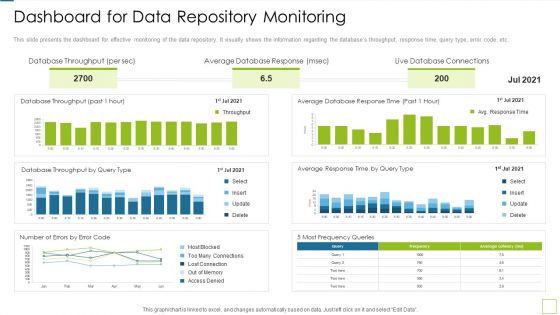
Database Expansion And Optimization Dashboard For Data Repository Monitoring Ppt Model Infographic Template
This slide presents the dashboard for effective monitoring of the data repository. It visually shows the information regarding the databases throughput, response time, query type, error code, etc. Deliver and pitch your topic in the best possible manner with this database expansion and optimization dashboard for data repository monitoring ppt model infographic template. Use them to share invaluable insights on database throughput, average database response, live database connections and impress your audience. This template can be altered and modified as per your expectations. So, grab it now.
-
Business Management Dashboards Sales Ppt Infographics Graphics Design PDF
Deliver and pitch your topic in the best possible manner with this business management dashboards sales ppt infographics graphics design pdf. Use them to share invaluable insights on value, customer, revenue and impress your audience. This template can be altered and modified as per your expectations. So, grab it now.
-
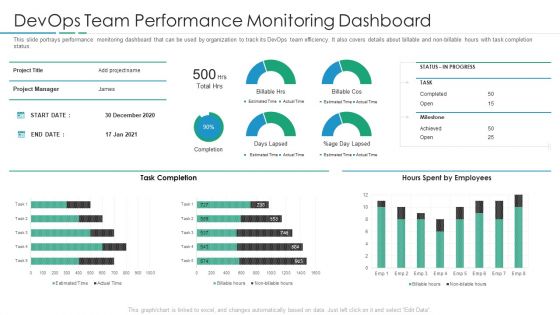
Devops Team Performance Monitoring Dashboard Infographics PDF
Deliver an awe inspiring pitch with this creative devops team performance monitoring dashboard infographics pdf bundle. Topics like devops team performance monitoring dashboard can be discussed with this completely editable template. It is available for immediate download depending on the needs and requirements of the user.
-
hotel cafe business plan coffee shop business dashboard profit infographics pdf
This slide shows the coffee shop business dashboard which includes profit by state, average sales by month, profit, sales by product type, etc. Deliver and pitch your topic in the best possible manner with this hotel cafe business plan coffee shop business dashboard profit infographics pdf. Use them to share invaluable insights on coffee shop business dashboard and impress your audience. This template can be altered and modified as per your expectations. So, grab it now.
-
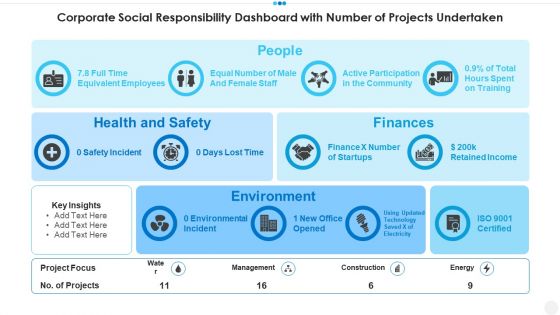
Corporate Social Responsibility Dashboard With Number Of Projects Undertaken Infographics PDF
Showcasing this set of slides titled corporate social responsibility dashboard with number of projects undertaken infographics pdf. The topics addressed in these templates are people, finances, environment, health and safety . All the content presented in this PPT design is completely editable. Download it and make adjustments in color, background, font etc. as per your unique business setting.
-
Customer Relationship Management Dashboard Ppt Infographic Template Model PDF
This slide covers the customer relationship management dashboard which includes in progress and completed activities, lead target details, etc. Deliver and pitch your topic in the best possible manner with this customer relationship management dashboard ppt infographic template model pdf. Use them to share invaluable insights on customer relationship management dashboard and impress your audience. This template can be altered and modified as per your expectations. So, grab it now.
-
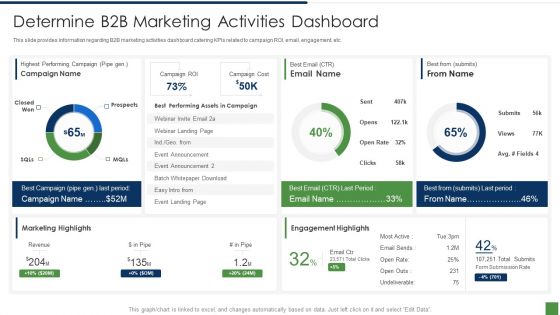
B2B Lead Generation Plan Determine B2b Marketing Activities Dashboard Infographics PDF
This slide provides information regarding B2B marketing activities dashboard catering KPIs related to campaign ROI, email, engagement, etc. Deliver and pitch your topic in the best possible manner with this b2b lead generation plan determine b2b marketing activities dashboard infographics pdf. Use them to share invaluable insights on determine b2b marketing activities dashboard and impress your audience. This template can be altered and modified as per your expectations. So, grab it now.
-
HR Dashboard With Staff Resignation Status Ppt Infographic Template Images PDF
Showcasing this set of slides titled hr dashboard with staff resignation status ppt infographic template images pdf. The topics addressed in these templates are total head count, age distribution, resign employees distribution by gender, employees years. All the content presented in this PPT design is completely editable. Download it and make adjustments in color, background, font etc. as per your unique business setting.
-
Transformation Plan Dashboard Ppt Infographic Template Show PDF
Deliver and pitch your topic in the best possible manner with this transformation plan dashboard ppt infographic template show pdf. Use them to share invaluable insights on dashword and impress your audience. This template can be altered and modified as per your expectations. So, grab it now.
-
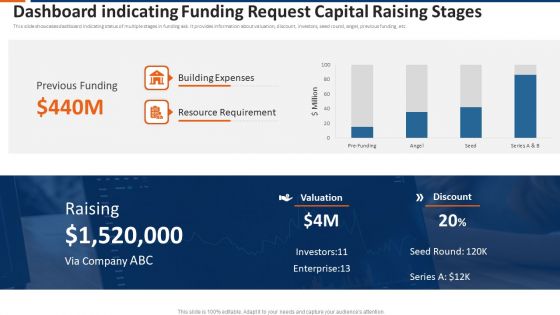
Dashboard Indicating Funding Request Capital Raising Stages Ppt Show Infographics PDF
This slide showcases dashboard indicating status of multiple stages in funding ask. It provides information about valuation, discount, investors, seed round, angel, previous funding, etc. Showcasing this set of slides titled dashboard indicating funding request capital raising stages ppt show infographics pdf. The topics addressed in these templates are previous funding, building expenses, resource requirement. All the content presented in this PPT design is completely editable. Download it and make adjustments in color, background, font etc. as per your unique business setting.
-
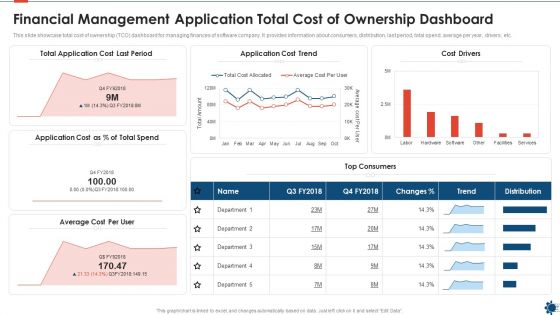
Financial Management Application Total Cost Of Ownership Dashboard Infographics PDF
This slide showcase total cost of ownership TCO dashboard for managing finances of software company. It provides information about consumers, distribution, last period, total spend, average per year, drivers, etc. Showcasing this set of slides titled financial management application total cost of ownership dashboard infographics pdf. The topics addressed in these templates are cost, application. All the content presented in this PPT design is completely editable. Download it and make adjustments in color, background, font etc. as per your unique business setting.
-
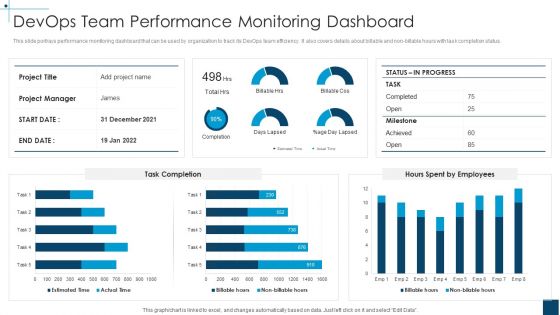
Devops Principles For Hybrid Cloud IT Devops Team Performance Monitoring Dashboard Infographics PDF
This slide portrays performance monitoring dashboard that can be used by organization to track its DevOps team efficiency. It also covers details about billable and non-billable hours with task completion status.Deliver and pitch your topic in the best possible manner with this devops principles for hybrid cloud it devops team performance monitoring dashboard infographics pdf Use them to share invaluable insights on devops team performance monitoring dashboard and impress your audience. This template can be altered and modified as per your expectations. So, grab it now.
-
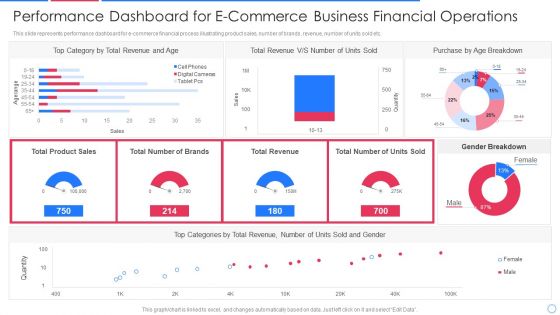
Performance Dashboard For E Commerce Business Financial Operations Infographics PDF
This slide represents performance dashboard for e-commerce financial process illustrating product sales, number of brands, revenue, number of units sold etc.Pitch your topic with ease and precision using this performance dashboard for e commerce business financial operations infographics pdf This layout presents information on category by total revenue, total revenue, purchase by age breakdown It is also available for immediate download and adjustment. So, changes can be made in the color, design, graphics or any other component to create a unique layout.
-
Marketing KPI Dashboard With Cost Per Click Infographics PDF
The following slide showcases a comprehensive KPI dashboard used to analyze the pay-per-click advertising performance. The KPIs covered in the slide are total ad cost, total clicks, impressions, cost per conversion, conversion rate, cost per click etc. Pitch your topic with ease and precision using this Marketing KPI Dashboard With Cost Per Click Infographics PDF. This layout presents information on Conversions, Cost, Impressions. It is also available for immediate download and adjustment. So, changes can be made in the color, design, graphics or any other component to create a unique layout.
-
Dashboard Of Property Operations And Maintenance Ppt Infographic Template Objects PDF
This slide focuses on maintenance dashboard for certified reliability engineer which covers team efficiency, cumulative savings, planned maintenance, chiller performance analysis, portfolio comparison, alarm and fault diagnostics, etc. Pitch your topic with ease and precision using this Dashboard Of Property Operations And Maintenance Ppt Infographic Template Objects PDF. This layout presents information on Planned Maintenance Efficiency, Chiller Performance Analysis, Portfolio Comparison Team, Alarm And Fault. It is also available for immediate download and adjustment. So, changes can be made in the color, design, graphics or any other component to create a unique layout.
-
Price Optimization Dashboard Product Pricing Strategies Analysis Ppt Infographic Template Visuals PDF
This slide covers the details of price optimization which focuses on price changes, leader, distribution, and benchmark. Deliver and pitch your topic in the best possible manner with this Price Optimization Dashboard Product Pricing Strategies Analysis Ppt Infographic Template Visuals PDF. Use them to share invaluable insights on Price Changes Sep, Price Leader Accessories, Per Price Range and impress your audience. This template can be altered and modified as per your expectations. So, grab it now.
-
Essential Activities In Recruitment Process Tracking Dashboard Turnover Hiring New Employees At Workplace Infographics PDF
This slide provides information regarding tracking of essential activities associated to recruitment process and presented in dashboard. Deliver an awe inspiring pitch with this creative Essential Activities In Recruitment Process Tracking Dashboard Turnover Hiring New Employees At Workplace Infographics PDF bundle. Topics like Turnover Rate, Recruitment Conversion, Recruiting Funnel can be discussed with this completely editable template. It is available for immediate download depending on the needs and requirements of the user.
-
Software Product Evaluation KPI Dashboard With Average Defects Infographics PDF
Mentioned slide indicates software product testing KPI dashboard which shows various aspects like defects by type and severity, average solution over last 18 weeks etc. These metrics can assist the developers to evaluate the performance of software by performing test.Showcasing this set of slides titled Software Product Evaluation KPI Dashboard With Average Defects Infographics PDF The topics addressed in these templates are Software Product, Evaluation Dashboard, Average Defects All the content presented in this PPT design is completely editable. Download it and make adjustments in color, background, font etc. as per your unique business setting.
-
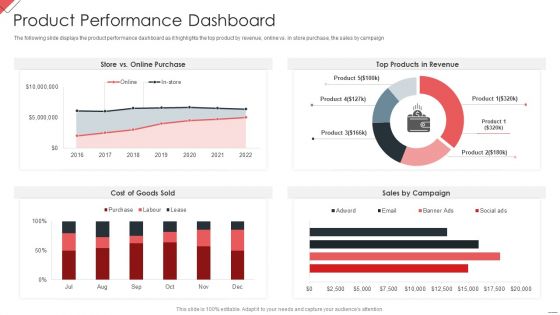
New Commodity Market Viability Review Product Performance Dashboard Infographics PDF
The following slide displays the product performance dashboard as it highlights the top product by revenue, online vs. in store purchase, the sales by campaign Deliver an awe inspiring pitch with this creative New Commodity Market Viability Review Product Performance Dashboard Infographics PDF bundle. Topics like Online Purchase, Products Revenue, Sales Campaign can be discussed with this completely editable template. It is available for immediate download depending on the needs and requirements of the user.
-
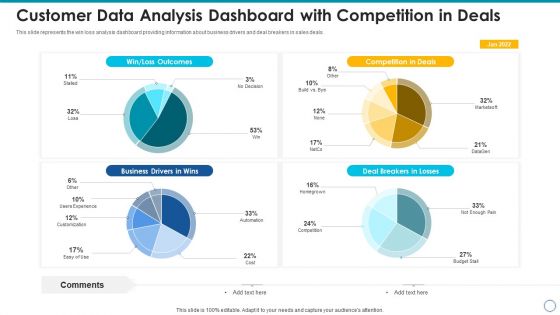
Customer Data Analysis Dashboard With Competition In Deals Infographics PDF
This slide represents the win loss analysis dashboard providing information about business drivers and deal breakers in sales deals. Pitch your topic with ease and precision using this customer data analysis dashboard with competition in deals infographics pdf. This layout presents information on customer data analysis dashboard with competition in deals. It is also available for immediate download and adjustment. So, changes can be made in the color, design, graphics or any other component to create a unique layout.
-
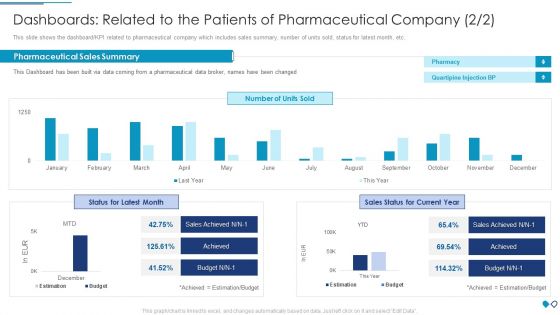
Dashboards Related To The Patients Of Pharmaceutical Company Infographics PDF
This slide shows the dashboard or KPI related to pharmaceutical company which includes sales summary, number of units sold, status for latest month, etc.Deliver an awe inspiring pitch with this creative dashboards related to the patients of pharmaceutical company infographics pdf bundle. Topics like pharmaceutical sales summary, pharmaceutical data broker, quartipine injection can be discussed with this completely editable template. It is available for immediate download depending on the needs and requirements of the user.
-
Project Task Management And Time Monitoring Dashboard Infographics PDF
This slide is shows the project task management and time tracking dashboard which includes task progress Gantt chart, task overdue list, upcoming deadline list and workload column chart. Pitch your topic with ease and precision using this project task management and time monitoring dashboard infographics pdf. This layout presents information on planning, design, development. It is also available for immediate download and adjustment. So, changes can be made in the color, design, graphics or any other component to create a unique layout.
-
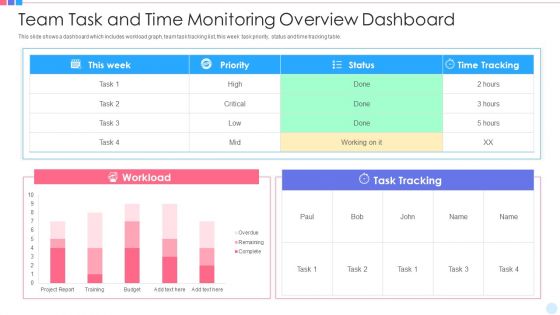
Team Task And Time Monitoring Overview Dashboard Infographics PDF
This slide shows a dashboard which includes workload graph, team task tracking list, this week task priority, status and time tracking table. Showcasing this set of slides titled team task and time monitoring overview dashboard infographics pdf. The topics addressed in these templates are team task and time monitoring overview dashboard. All the content presented in this PPT design is completely editable. Download it and make adjustments in color, background, font etc. as per your unique business setting.
-
Employees Evaluation Dashboard With Employee And Salary Data Infographics PDF
Pitch your topic with ease and precision using this employees evaluation dashboard with employee and salary data infographics pdf. This layout presents information on employees evaluation dashboard with employee and salary data. It is also available for immediate download and adjustment. So, changes can be made in the color, design, graphics or any other component to create a unique layout.
-
Project Problem Administration Tracking Dashboard Infographics PDF
This slide covers dashboard which helps the project managers to keep the track of all issues in detail. It also includes project name, department, project owner, detail of the issue, priority and status. Showcasing this set of slides titled project problem administration tracking dashboard infographics pdf. The topics addressed in these templates are project problem administration tracking dashboard. All the content presented in this PPT design is completely editable. Download it and make adjustments in color, background, font etc. as per your unique business setting.
-
Strategic Procedure To Improve Employee Efficiency Company Financial Performance Dashboard Infographics PDF
This slide highlights KPI dashboard exhibiting overall improvement in the financial performance of company as the consequences of program implementation. Deliver and pitch your topic in the best possible manner with this strategic procedure to improve employee efficiency company financial performance dashboard infographics pdf Use them to share invaluable insights on company financial performance dashboard and impress your audience. This template can be altered and modified as per your expectations. So, grab it now.
-
Staff Retention Plan Dashboard For Employee Retention Polices Ppt Infographics Backgrounds PDF
Purpose of the following slide is to show the Employee Attrition dashboard as it highlights the Employee turnover rate, average seniority of employees in months, year-over-year turnover rate etc. Deliver and pitch your topic in the best possible manner with this staff retention plan dashboard for employee retention polices ppt infographics backgrounds pdf. Use them to share invaluable insights on turnover rate, employees these and impress your audience. This template can be altered and modified as per your expectations. So, grab it now.
-
Sustainability Calculation With KPI Financial Performance Indicator Dashboard Infographics PDF Template PDF
This slide shows financial performance indicator dashboard covering net profit and net sales, profitability indicator ratios, cogs and net profit by region or channel. Deliver an awe inspiring pitch with this creative sustainability calculation with kpi financial performance indicator dashboard infographics pdf bundle. Topics like net profit margin, net profit and net sales, profitability indicator ratios, sold breakdown can be discussed with this completely editable template. It is available for immediate download depending on the needs and requirements of the user.
-
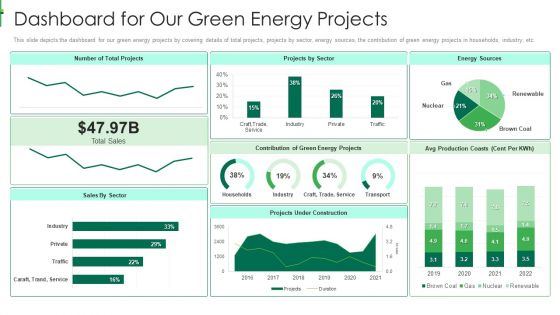
Sustainable Energy Dashboard For Our Green Energy Projects Infographics PDF
This slide depicts the dashboard for our green energy projects by covering details of total projects, projects by sector, energy sources, the contribution of green energy projects in households, industry, etc.Deliver and pitch your topic in the best possible manner with this sustainable energy dashboard for our green energy projects infographics pdf Use them to share invaluable insights on dashboard for our green energy projects and impress your audience. This template can be altered and modified as per your expectations. So, grab it now.
-
Cognitive Computing Action Plan Tracking Customer Data Insights Dashboard Ppt Infographics Graphic Tips PDF
This slide provides information regarding customer data insights dashboard in terms of average churn risk, segments, high earner, highly engaged customers, etc. Deliver and pitch your topic in the best possible manner with this cognitive computing action plan tracking customer data insights dashboard ppt infographics graphic tips pdf. Use them to share invaluable insights on median lifetime spend, average churm risk, brand affinities and impress your audience. This template can be altered and modified as per your expectations. So, grab it now.
-
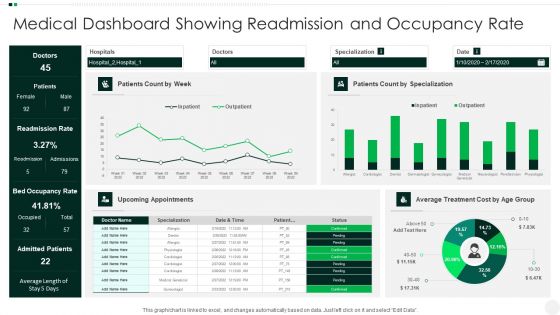
Medical Dashboard Showing Readmission And Occupancy Rate Infographics PDF
Pitch your topic with ease and precision using this Medical Dashboard Showing Readmission And Occupancy Rate Infographics PDF. This layout presents information on Medical Dashboard Showing Readmission And Occupancy Rate. It is also available for immediate download and adjustment. So, changes can be made in the color, design, graphics or any other component to create a unique layout.
-
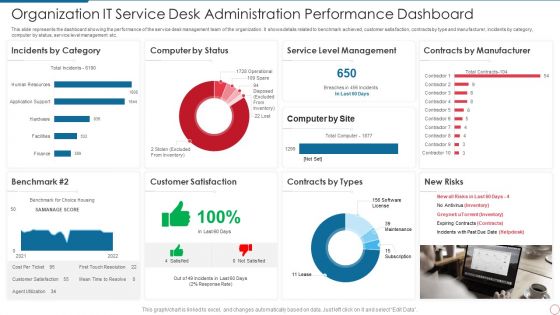
Organization IT Service Desk Administration Performance Dashboard Infographics PDF
This slide represents the dashboard showing the performance of the service desk management team of the organization. It shows details related to benchmark achieved, customer satisfaction, contracts by type and manufacturer, incidents by category, computer by status, service level management etc. Showcasing this set of slides titled Organization IT Service Desk Administration Performance Dashboard Infographics PDF. The topics addressed in these templates are Service, Management, Manufacturer. All the content presented in this PPT design is completely editable. Download it and make adjustments in color, background, font etc. as per your unique business setting.
-
Efficient Ways For Successful Project Administration Project And Tasks Implementation Dashboard Infographics PDF
This slide shows the dashboard related to project such as tasks, performance metrics and many more.Deliver an awe inspiring pitch with this creative Efficient Ways For Successful Project Administration Project And Tasks Implementation Dashboard Infographics PDF bundle. Topics like Project And Tasks Implementation Dashboard can be discussed with this completely editable template. It is available for immediate download depending on the needs and requirements of the user.
-
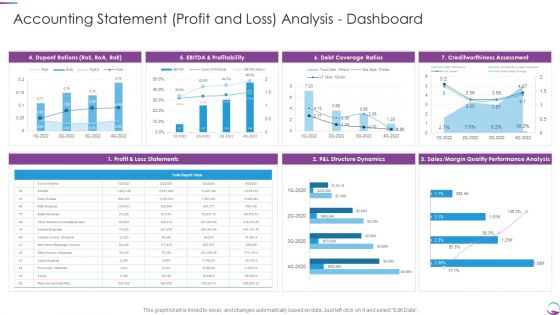
Accounting Statement Profit And Loss Analysis Dashboard Infographics PDF
Deliver an awe inspiring pitch with this creative Accounting Statement Profit And Loss Analysis Dashboard Infographics PDF bundle. Topics like Accounting Statement Profit And Loss Analysis Dashboard can be discussed with this completely editable template. It is available for immediate download depending on the needs and requirements of the user.
-
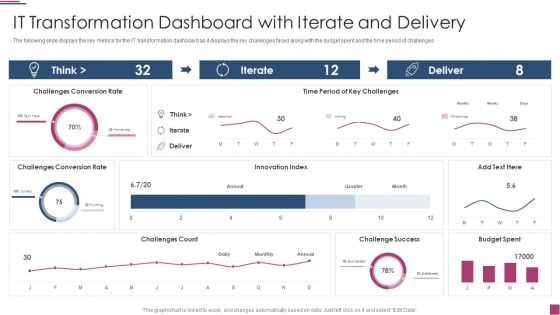
Innovation Procedure For Online Business IT Transformation Dashboard With Iterate And Delivery Infographics PDF
The following slide displays the key metrics for the IT transformation dashboard as it displays the key challenges faced along with the budget spent and the time period of challenges Deliver an awe inspiring pitch with this creative Innovation Procedure For Online Business IT Transformation Dashboard With Iterate And Delivery Infographics PDF bundle. Topics like IT Transformation Dashboard With Iterate And Delivery can be discussed with this completely editable template. It is available for immediate download depending on the needs and requirements of the user.
-
Project Management And Execution Status Dashboard Infographics PDF
This slide illustrates facts and figures related to project implementation status. It includes milestones, achievements, time spent, overall costs, team workload etc.Showcasing this set of slides titled Project Management And Execution Status Dashboard Infographics PDF. The topics addressed in these templates are Achievement, Team Workload, Overall Cost. All the content presented in this PPT design is completely editable. Download it and make adjustments in color, background, font etc. as per your unique business setting.
-
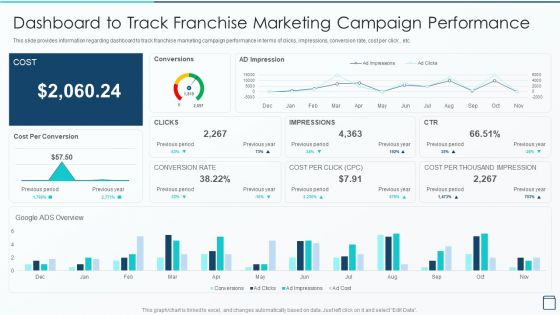
Effective Franchise Marketing Strategy Dashboard To Track Franchise Marketing Infographics PDF
This slide provides information regarding dashboard to track franchise marketing campaign performance in terms of clicks, impressions, conversion rate, cost per click , etc. Deliver and pitch your topic in the best possible manner with this Effective Franchise Marketing Strategy Dashboard To Track Franchise Marketing Infographics PDF Use them to share invaluable insights on Dashboard To Track Franchise Marketing Campaign Performance and impress your audience. This template can be altered and modified as per your expectations. So, grab it now.
-
Revenue Analysis KPI Dashboard Post Building Marketing Strategy Infographics PDF
Following slide outlines a revenue analysis dashboard showcasing the business results after implementing marketing strategy. It provides information about total revenue for the month, revenue for year to date, revenue trend, product revenue and services revenue etc. Pitch your topic with ease and precision using this revenue analysis kpi dashboard post building marketing strategy infographics pdf. This layout presents information on revenue analysis kpi dashboard post building marketing strategy. It is also available for immediate download and adjustment. So, changes can be made in the color, design, graphics or any other component to create a unique layout.
-
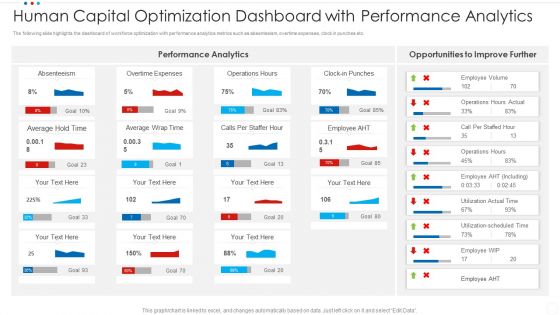
Human Capital Optimization Dashboard With Performance Analytics Infographics PDF
The following slide highlights the dashboard of workforce optimization with performance analytics metrics such as absenteeism, overtime expenses, clock in punches etc. Showcasing this set of slides titled human capital optimization dashboard with performance analytics infographics pdf. The topics addressed in these templates are average, overtime expenses, absenteeism. All the content presented in this PPT design is completely editable. Download it and make adjustments in color, background, font etc. as per your unique business setting.
-
Streamlining HR Service Delivery To Ensure Organizational Transformation Dashboard Human Resources Infographics PDF
Deliver an awe inspiring pitch with this creative streamlining hr service delivery to ensure organizational transformation dashboard human resources infographics pdf bundle. Topics like dashboard human resources service delivery cases can be discussed with this completely editable template. It is available for immediate download depending on the needs and requirements of the user.
-
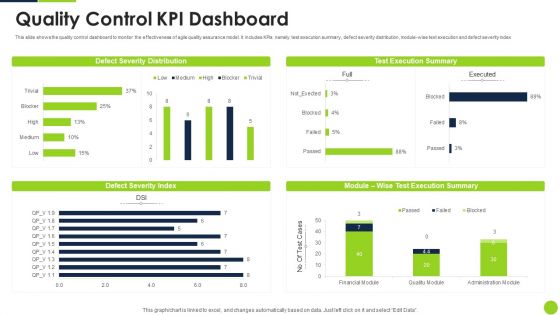
Agile Methodology Quality Control Quality Control KPI Dashboard Ppt Infographic Template Layout Ideas PDF
This slide shows the quality control dashboard to monitor the effectiveness of agile quality assurance model. It includes KPIs namely test execution summary, defect severity distribution, module-wise text execution and defect severity index Deliver an awe inspiring pitch with this creative agile methodology quality control quality control kpi dashboard ppt infographic template layout ideas pdf bundle. Topics like quality control kpi dashboard can be discussed with this completely editable template. It is available for immediate download depending on the needs and requirements of the user.
-
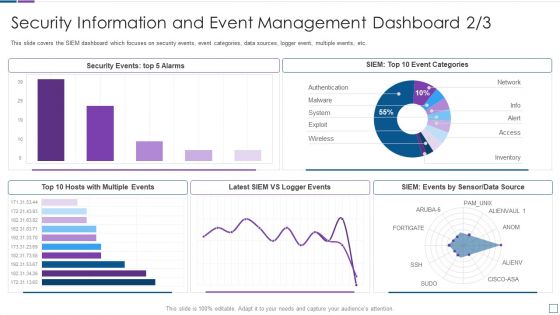
Real Time Assessment Of Security Threats Security Information And Event Management Dashboard Infographics PDF
This slide covers the SIEM dashboard which focuses on security events, event categories, data sources, logger event, multiple events, etc. Deliver an awe inspiring pitch with this creative real time assessment of security threats security information and event management dashboard infographics pdf bundle. Topics like security information and event management dashboard can be discussed with this completely editable template. It is available for immediate download depending on the needs and requirements of the user.
-
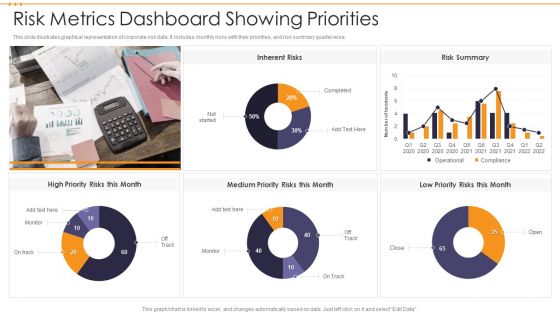
Risk Metrics Dashboard Showing Priorities Infographics PDF
This slide illustrates graphical representation of corporate risk data. It includes monthly risks with their priorities, and risk summary quarter wise. Showcasing this set of slides titled Risk Metrics Dashboard Showing Priorities Infographics PDF. The topics addressed in these templates are Risk Metrics Dashboard Showing Priorities. All the content presented in this PPT design is completely editable. Download it and make adjustments in color, background, font etc. as per your unique business setting.
-
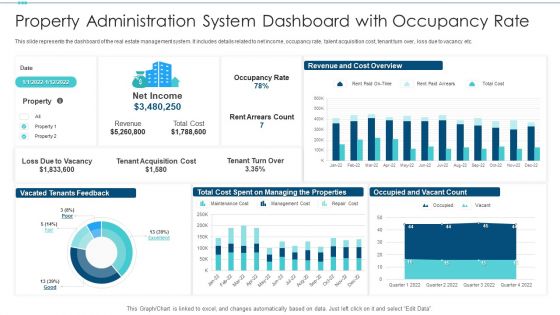
Property Administration System Dashboard With Occupancy Rate Infographics PDF
Pitch your topic with ease and precision using this property administration system dashboard with occupancy rate infographics pdf. This layout presents information on revenue, cost, occupancy rate. It is also available for immediate download and adjustment. So, changes can be made in the color, design, graphics or any other component to create a unique layout.
-
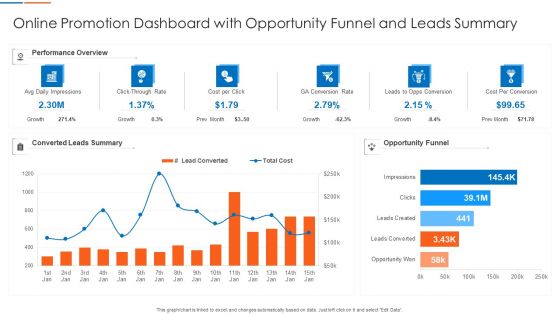
Online Promotion Dashboard With Opportunity Funnel And Leads Summary Infographics PDF Guidelines PDF
Showcasing this set of slides titled Online Promotion Dashboard With Opportunity Funnel And Leads Summary Infographics PDF Guidelines PDF The topics addressed in these templates are Online Promotion Dashboard With Opportunity Funnel And Leads Summary All the content presented in this PPT design is completely editable. Download it and make adjustments in color, background, font etc. as per your unique business setting.
-
Reverse Proxy Server IT Dashboard For Reverse Proxy Performance Tracking Ppt Infographics Pictures PDF
This slide represents the dashboard for reverse proxy performance tracking by covering details of CPU load, available memory, and connections. Deliver and pitch your topic in the best possible manner with this reverse proxy server it dashboard for reverse proxy performance tracking ppt infographics pictures pdf. Use them to share invaluable insights on dashboard reverse, proxy performance tracking and impress your audience. This template can be altered and modified as per your expectations. So, grab it now.
-
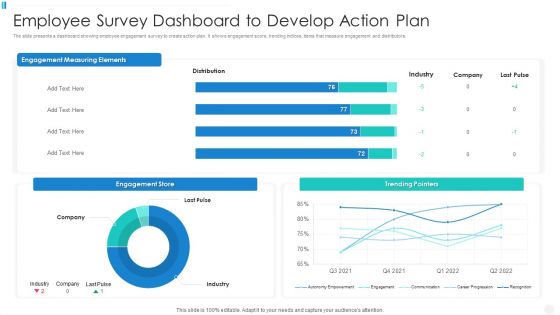
Employee Survey Dashboard To Develop Action Plan Infographics PDF
The slide presents a dashboard showing employee engagement survey to create action plan. It shows engagement score, trending indices, items that measure engagement and distributors. Showcasing this set of slides titled employee survey dashboard to develop action plan infographics pdf The topics addressed in these templates are employee survey dashboard to develop action plan All the content presented in this PPT design is completely editable. Download it and make adjustments in color, background, font etc. as per your unique business setting.
-
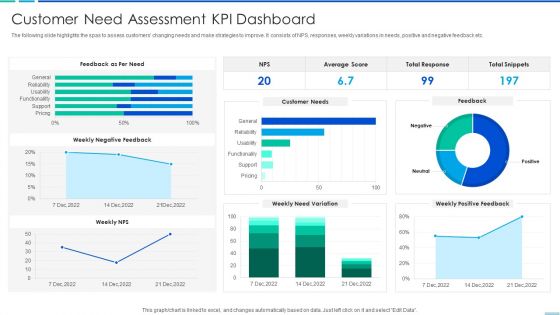
Customer Need Assessment Kpi Dashboard Infographics PDF
The following slide highlights the spas to assess customers changing needs and make strategies to improve. It consists of NPS, responses, weekly variations in needs, positive and negative feedback etc. Showcasing this set of slides titled customer need assessment kpi dashboard infographics pdf. The topics addressed in these templates are customer need assessment kpi dashboard. All the content presented in this PPT design is completely editable. Download it and make adjustments in color, background, font etc. as per your unique business setting.
-
Security KPI Dashboard To Manage User Access Ppt Infographic Template Graphics Pictures PDF
Pitch your topic with ease and precision using this Security KPI Dashboard To Manage User Access Ppt Infographic Template Graphics Pictures PDF. This layout presents information on Devices, Security KPI Dashboard, Workspace. It is also available for immediate download and adjustment. So, changes can be made in the color, design, graphics or any other component to create a unique layout.
-
Social Media Tracking Dashboard With Posts And Clicks Ppt Infographics Slide Portrait PDF
Showcasing this set of slides titled Social Media Tracking Dashboard With Posts And Clicks Ppt Infographics Slide Portrait PDF. The topics addressed in these templates are Social Media, Tracking Dashboard. All the content presented in this PPT design is completely editable. Download it and make adjustments in color, background, font etc. as per your unique business setting.
-
Monthly Sales Report Performance Monitoring Dashboard Icon Infographics PDF
This is a Monthly Sales Report Performance Monitoring Dashboard Icon Infographics PDF template with various stages. Focus and dispense information on four stages using this creative set, that comes with editable features. It contains large content boxes to add your information on topics like Monthly Sales, Dashboard Icon, Report Performance. You can also showcase facts, figures, and other relevant content using this PPT layout. Grab it now.
-
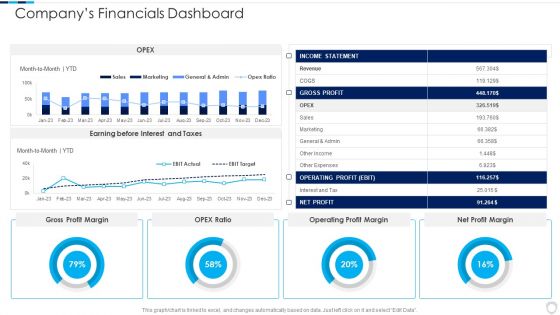
Financial Report Of An IT Firm Companys Financials Dashboard Infographics PDF
Deliver an awe inspiring pitch with this creative Financial Report Of An IT Firm Companys Financials Dashboard Infographics PDF bundle. Topics like Operating Profit, Gross Profit, Income Statement can be discussed with this completely editable template. It is available for immediate download depending on the needs and requirements of the user.
-
BANT Sales Lead Qualification Model Sales Dashboard With Lead Conversional And Lead Infographics PDF
The following slide displays the key metrics for the sales as it highlights the lead conversion ratio , opportunists, proposal sent and key performing employees. Deliver and pitch your topic in the best possible manner with this BANT Sales Lead Qualification Model Sales Dashboard With Lead Conversional And Lead Infographics PDF. Use them to share invaluable insights on Converted Leads, Lead Conversion, Employee Leads and impress your audience. This template can be altered and modified as per your expectations. So, grab it now.
-
Degree Of Operational Leverage Dashboard With Income Statement Ppt Infographics Layout PDF
This slide illustrates graphical representation of company revenue and income statement. It includes monthly revenue, revenue by products, revenue by country etc. Pitch your topic with ease and precision using this Degree Of Operational Leverage Dashboard With Income Statement Ppt Infographics Layout PDF. This layout presents information on Monthly Revenue, Income Statement, Product. It is also available for immediate download and adjustment. So, changes can be made in the color, design, graphics or any other component to create a unique layout.
-
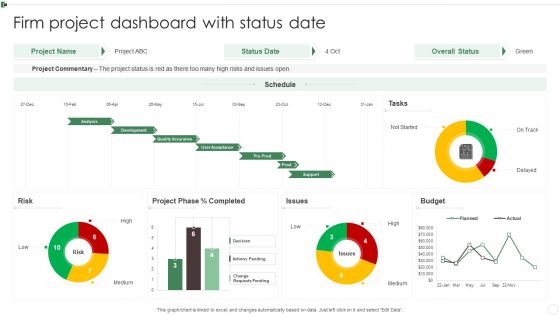
Firm Project Dashboard With Status Date Ppt Infographics Slides PDF
This graph or chart is linked to excel, and changes automatically based on data. Just left click on it and select Edit Data. Pitch your topic with ease and precision using this Firm Project Dashboard With Status Date Ppt Infographics Slides PDF. This layout presents information on Project Commentary, Budget, Project Phase, Risk. It is also available for immediate download and adjustment. So, changes can be made in the color, design, graphics or any other component to create a unique layout.
-
Performance KPI Dashboard To Analyze Instagram Marketing Strategy Performance Infographics PDF
The following slide outlines KPI metrics dashboard of Instagram video marketing. The KPIs covered in the slide are followers, engagement, likes, comments, impressions, reach, video views and saves.Deliver an awe inspiring pitch with this creative Performance KPI Dashboard To Analyze Instagram Marketing Strategy Performance Infographics PDF bundle. Topics like Engagement, Impressions, Comments can be discussed with this completely editable template. It is available for immediate download depending on the needs and requirements of the user.
-
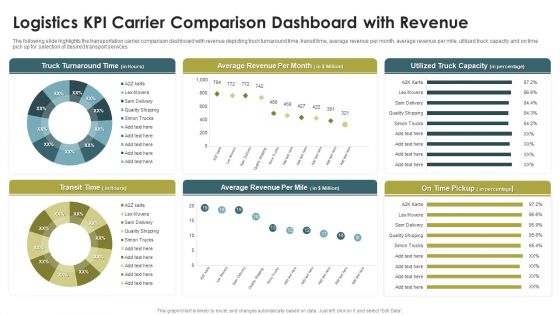
Logistics KPI Carrier Comparison Dashboard With Revenue Ppt Infographics Portfolio PDF
The following slide highlights the transportation carrier comparison dashboard with revenue depicting truck turnaround time, transit time, average revenue per month, average revenue per mile, utilized truck capacity and on time pick up for selection of desired transport services. Pitch your topic with ease and precision using this Logistics KPI Carrier Comparison Dashboard With Revenue Ppt Infographics Portfolio PDF. This layout presents information on Truck Turnaround Time, Average Revenue, Per Month, Transit Time. It is also available for immediate download and adjustment. So, changes can be made in the color, design, graphics or any other component to create a unique layout.
-
Logistics KPI Status Dashboard With Monthly KPI Ppt Infographic Template Layout PDF
The following slide highlights the transportation status dashboard with monthly KPI illustrating order status with customer, order date and delivery date. It shows financial performance for four quarters as well as todays order, inventory and monthly KPI with Inventory, shipping cost for past 30 days. Pitch your topic with ease and precision using this Logistics KPI Status Dashboard With Monthly KPI Ppt Infographic Template Layout PDF. This layout presents information on Order Status, Today Order, Inventory, Monthly KPI. It is also available for immediate download and adjustment. So, changes can be made in the color, design, graphics or any other component to create a unique layout.
-
Dashboard For Logistics KPI Management System Of Logistics Company Infographics PDF
The following slide highlights the dashboard for transportation management system of logistics company illustrating shipment status of 30 days, shipment by carrier, on time shipment, average shipment cost, carrier efficiency and shipment count. Pitch your topic with ease and precision using this Dashboard For Logistics KPI Management System Of Logistics Company Infographics PDF. This layout presents information on Shipment Status, Shipment By Carrier, On Time Shipment. It is also available for immediate download and adjustment. So, changes can be made in the color, design, graphics or any other component to create a unique layout.


