Dashboard infographic PowerPoint Presentation Templates and Google Slides
-
Management Dashboard For Business Disaster Plan Infographics PDF
This slide shows the dashboard for disaster management plan. This template highlights risk metrics that the management needs to consider and track for proper disaster management. It includes Risk assessment, risk rating etc. Showcasing this set of slides titled Management Dashboard For Business Disaster Plan Infographics PDF Graphics. The topics addressed in these templates are Risk Assessments, Risk Tolerances Exceeded, Risk Without Controls. All the content presented in this PPT design is completely editable. Download it and make adjustments in color, background, font etc. as per your unique business setting.
-
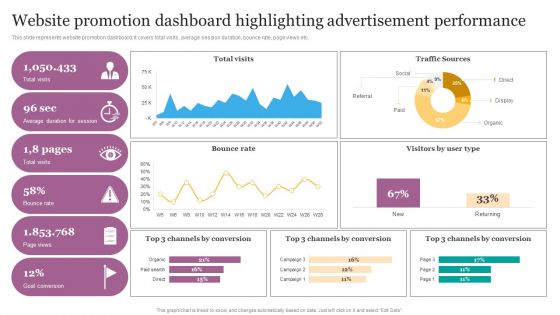
Website Promotion Dashboard Highlighting Advertisement Performance Ppt Infographics Portfolio PDF
This slide represents website promotion dashboard. It covers total visits, average session duration, bounce rate, page views etc. Create an editable Website Promotion Dashboard Highlighting Advertisement Performance Ppt Infographics Portfolio PDF that communicates your idea and engages your audience. Whether youre presenting a business or an educational presentation, pre designed presentation templates help save time. Website Promotion Dashboard Highlighting Advertisement Performance Ppt Infographics Portfolio PDF is highly customizable and very easy to edit, covering many different styles from creative to business presentations. Slidegeeks has creative team members who have crafted amazing templates. So, go and get them without any delay.
-
Different Brands Performance Tracking Dashboard Ppt Gallery Infographics PDF
This slide provides information regarding different brands performance tracking dashboard in terms of brand metric, brand commitment, advertising metrics, and purchase metrics. Take your projects to the next level with our ultimate collection of Different Brands Performance Tracking Dashboard Ppt Gallery Infographics PDF. Slidegeeks has designed a range of layouts that are perfect for representing task or activity duration, keeping track of all your deadlines at a glance. Tailor these designs to your exact needs and give them a truly corporate look with your own brand colors they will make your projects stand out from the rest.
-
Software Defined Networking Development Strategies Dashboard For Software Defined Networking Sdn Infographics PDF
This slide depicts the dashboard for the software-defined network by covering details of bandwidth administrator, traffic quality, active flows, development tools, completed tasks, wide-area network bandwidth, and G drive. Find a pre designed and impeccable Software Defined Networking Development Strategies Dashboard For Software Defined Networking Sdn Infographics PDF. The templates can ace your presentation without additional effort. You can download these easy to edit presentation templates to make your presentation stand out from others. So, what are you waiting for Download the template from Slidegeeks today and give a unique touch to your presentation.
-
KPI Dashboard To Track Risk Events Ppt Infographic Template Layout Ideas PDF
This slide displays KPI dashboard that can be used by a firm to track multiple risk events. Metrics covered in the dashboard are residual risks by period and risk category by total risk rating. Are you in need of a template that can accommodate all of your creative concepts This one is crafted professionally and can be altered to fit any style. Use it with Google Slides or PowerPoint. Include striking photographs, symbols, depictions, and other visuals. Fill, move around, or remove text boxes as desired. Test out color palettes and font mixtures. Edit and save your work, or work with colleagues. Download KPI Dashboard To Track Risk Events Ppt Infographic Template Layout Ideas PDF and observe how to make your presentation outstanding. Give an impeccable presentation to your group and make your presentation unforgettable.
-
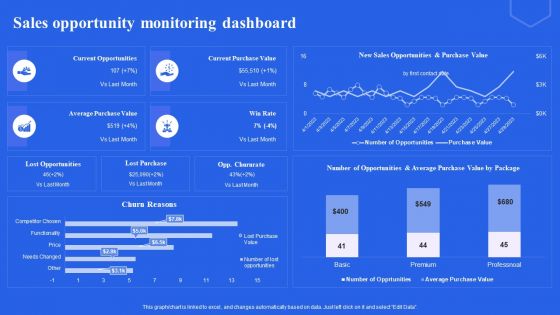
Sales Opportunity Monitoring Dashboard Ppt Infographics Good PDF
Explore a selection of the finest Sales Opportunity Monitoring Dashboard Ppt Infographics Good PDF here. With a plethora of professionally designed and pre made slide templates, you can quickly and easily find the right one for your upcoming presentation. You can use our Sales Opportunity Monitoring Dashboard Ppt Infographics Good PDF to effectively convey your message to a wider audience. Slidegeeks has done a lot of research before preparing these presentation templates. The content can be personalized and the slides are highly editable. Grab templates today from Slidegeeks.
-
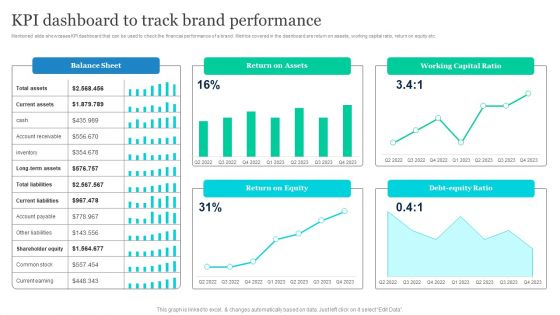
Effective Product Positioning Approach Kpi Dashboard To Track Brand Performance Infographics PDF
Mentioned slide showcases KPI dashboard that can be used to check the financial performance of a brand. Metrics covered in the dashboard are return on assets, working capital ratio, return on equity etc. Slidegeeks is one of the best resources for PowerPoint templates. You can download easily and regulate Effective Product Positioning Approach Kpi Dashboard To Track Brand Performance Infographics PDF for your personal presentations from our wonderful collection. A few clicks is all it takes to discover and get the most relevant and appropriate templates. Use our Templates to add a unique zing and appeal to your presentation and meetings. All the slides are easy to edit and you can use them even for advertisement purposes.
-
Implementing Lean Production Tool And Techniques Lean Manufacturing Dashboard Showcasing Infographics PDF
This slide represents lean manufacturing dashboard showcasing production progress. It covers production volume, order volume, downtime, returned item etc. Explore a selection of the finest Implementing Lean Production Tool And Techniques Lean Manufacturing Dashboard Showcasing Infographics PDF here. With a plethora of professionally designed and pre made slide templates, you can quickly and easily find the right one for your upcoming presentation. You can use our Implementing Lean Production Tool And Techniques Lean Manufacturing Dashboard Showcasing Infographics PDF to effectively convey your message to a wider audience. Slidegeeks has done a lot of research before preparing these presentation templates. The content can be personalized and the slides are highly editable. Grab templates today from Slidegeeks.
-
Digital Marketing Metrics Dashboard To Marketing And Promotion Automation Infographics Pdf
This slide presents a dashboard to measure and track performance of digital marketing activities using various metrics. It highlights element such as leads, users, users to leads, leads to MQLs, MQLs to SQLs, SQLs to opportunities, social events and social interactions.Whether you have daily or monthly meetings, a brilliant presentation is necessary. Digital Marketing Metrics Dashboard To Marketing And Promotion Automation Infographics Pdf can be your best option for delivering a presentation. Represent everything in detail using Digital Marketing Metrics Dashboard To Marketing And Promotion Automation Infographics Pdf and make yourself stand out in meetings. The template is versatile and follows a structure that will cater to your requirements. All the templates prepared by Slidegeeks are easy to download and edit. Our research experts have taken care of the corporate themes as well. So, give it a try and see the results.
-
Dashboard To Track Binary Multi Level Marketing Progress Multi Level Marketing Infographics Pdf
This slide represents metric dashboard that helps marketers in tracking and managing binary network marketing. It covers KPIs such as network bonus, expenditure, profit etc. Are you in need of a template that can accommodate all of your creative concepts This one is crafted professionally and can be altered to fit any style. Use it with Google Slides or PowerPoint. Include striking photographs, symbols, depictions, and other visuals. Fill, move around, or remove text boxes as desired. Test out color palettes and font mixtures. Edit and save your work, or work with colleagues. Download Dashboard To Track Binary Multi Level Marketing Progress Multi Level Marketing Infographics Pdf and observe how to make your presentation outstanding. Give an impeccable presentation to your group and make your presentation unforgettable.
-
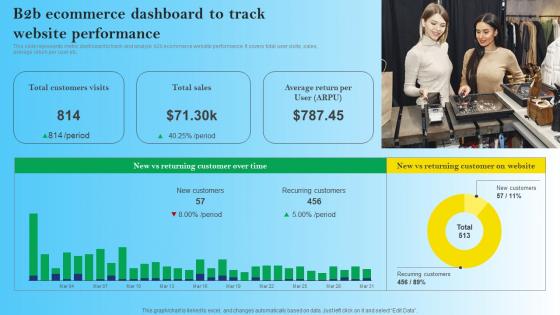
B2B Ecommerce Dashboard To Track Website Performance B2B Digital Commerce Infographics Pdf
This slide represents metric dashboard to track and analyze b2b ecommerce website performance. It covers total user visits, sales, average return per user etc. The B2B Ecommerce Dashboard To Track Website Performance B2B Digital Commerce Infographics Pdf is a compilation of the most recent design trends as a series of slides. It is suitable for any subject or industry presentation, containing attractive visuals and photo spots for businesses to clearly express their messages. This template contains a variety of slides for the user to input data, such as structures to contrast two elements, bullet points, and slides for written information. Slidegeeks is prepared to create an impression.
-
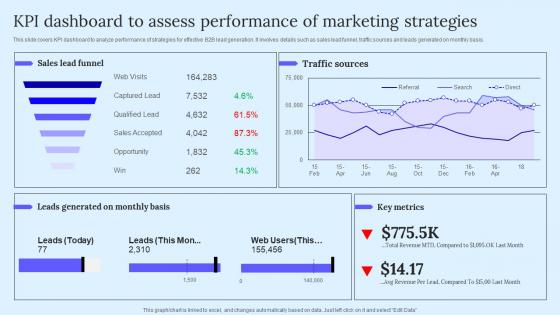
KPI Dashboard To Assess Performance B2B Marketing Techniques To Attract Potential Infographics Pdf
This slide covers KPI dashboard to analyze performance of strategies for effective B2B lead generation. It involves details such as sales lead funnel, traffic sources and leads generated on monthly basis. Slidegeeks has constructed KPI Dashboard To Assess Performance B2B Marketing Techniques To Attract Potential Infographics Pdf after conducting extensive research and examination. These presentation templates are constantly being generated and modified based on user preferences and critiques from editors. Here, you will find the most attractive templates for a range of purposes while taking into account ratings and remarks from users regarding the content. This is an excellent jumping off point to explore our content and will give new users an insight into our top notch PowerPoint Templates.
-
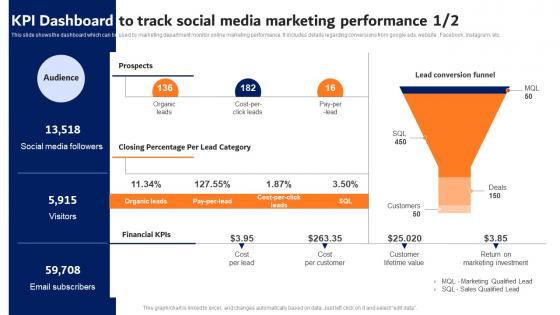
Digital Advertising Strategies KPI Dashboard To Track Social Media Infographics Pdf
This slide shows the dashboard which can be used by marketing department monitor online marketing performance. It includes details regarding conversions from google ads, website , Facebook, Instagram, etc. Make sure to capture your audiences attention in your business displays with our gratis customizable Digital Advertising Strategies KPI Dashboard To Track Social Media Infographics Pdf. These are great for business strategies, office conferences, capital raising or task suggestions. If you desire to acquire more customers for your tech business and ensure they stay satisfied, create your own sales presentation with these plain slides.
-
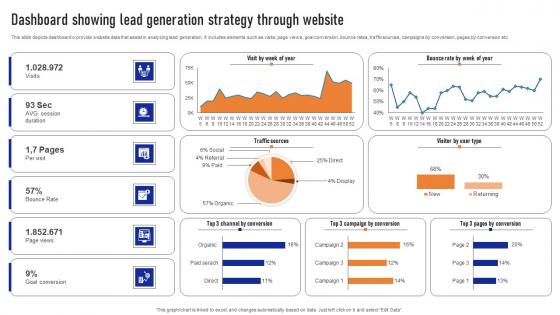
Dashboard Showing Lead Generation Strategy Through Website Ppt Infographic Template Rules Pdf
This slide depicts dashboard o provide website data that assist in analyzing lead generation. It includes elements such as visits, page views, goal conversion, bounce rates, traffic sources, campaigns by conversion, pages by conversion etc. Pitch your topic with ease and precision using this Dashboard Showing Lead Generation Strategy Through Website Ppt Infographic Template Rules Pdf. This layout presents information on Goal Conversion, Bounce Rates, Traffic Sources. It is also available for immediate download and adjustment. So, changes can be made in the color, design, graphics or any other component to create a unique layout.
-
KPI Dashboard For Estimating Monthly Cash Flow Infographics Pdf
Following slide demonstrates KPI dashboard to forecast monthly business money flow for cash flow management planning. It includes components such as projected profit before tax, net operating cash flow, net financial cash flow, net investing cash flow, etc. Showcasing this set of slides titled KPI Dashboard For Estimating Monthly Cash Flow Infographics Pdf. The topics addressed in these templates are KPI Dashboard, Estimating Monthly Cash Flow, Net Financial Cash Flow. All the content presented in this PPT design is completely editable. Download it and make adjustments in color, background, font etc. as per your unique business setting.
-
Consumer Segmentation Dashboard For Website Analytics Infographics Pdf
This slide showcases a dashboard for segmenting customers to perform website analytics. It includes key components such as bounce rate of returning users, bounce rate of new users, sessions, number of sessions per users, etc. Pitch your topic with ease and precision using this Consumer Segmentation Dashboard For Website Analytics Infographics Pdf. This layout presents information on Consumer Segmentation Dashboard, Website Analytics, Segmenting Customers. It is also available for immediate download and adjustment. So, changes can be made in the color, design, graphics or any other component to create a unique layout.
-
Dashboard For Tracking Email Mass Marketing Definitive Guide On Mass Advertising Infographics Pdf
This slide showcases the dashboard for monitoring the email marketing campaign performance. It includes the open rate, click-through rate CTR, bounce rate, conversion ratio, new subscribers, and unsubscribe rate. Do you have to make sure that everyone on your team knows about any specific topic I yes, then you should give Dashboard For Tracking Email Mass Marketing Definitive Guide On Mass Advertising Infographics Pdf a try. Our experts have put a lot of knowledge and effort into creating this impeccable Dashboard For Tracking Email Mass Marketing Definitive Guide On Mass Advertising Infographics Pdf. You can use this template for your upcoming presentations, as the slides are perfect to represent even the tiniest detail. You can download these templates from the Slidegeeks website and these are easy to edit. So grab these today.
-
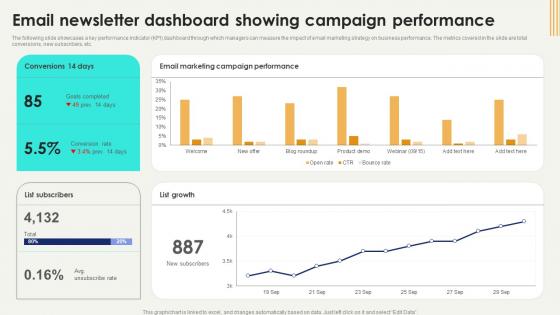
Email Newsletter Dashboard Digital Marketing Strategies Improve Enterprise Sales Infographics Pdf
The following slide showcases a key performance indicator KPI dashboard through which managers can measure the impact of email marketing strategy on business performance. The metrics covered in the slide are total conversions, new subscribers, etc. The Email Newsletter Dashboard Digital Marketing Strategies Improve Enterprise Sales Infographics Pdf is a compilation of the most recent design trends as a series of slides. It is suitable for any subject or industry presentation, containing attractive visuals and photo spots for businesses to clearly express their messages. This template contains a variety of slides for the user to input data, such as structures to contrast two elements, bullet points, and slides for written information. Slidegeeks is prepared to create an impression.
-
KPI Dashboard Track Pr Internal Branding Strategy For Enhanced Advocacy Infographics Pdf
This slide shows dashboard which can be used by organizations to measure the results of public relation strategy. It includes metrics such as media coverage rate, social media engagement rate, share of voice and brand mentions. Explore a selection of the finest KPI Dashboard Track Pr Internal Branding Strategy For Enhanced Advocacy Infographics Pdf here. With a plethora of professionally designed and pre made slide templates, you can quickly and easily find the right one for your upcoming presentation. You can use our KPI Dashboard Track Pr Internal Branding Strategy For Enhanced Advocacy Infographics Pdf to effectively convey your message to a wider audience. Slidegeeks has done a lot of research before preparing these presentation templates. The content can be personalized and the slides are highly editable. Grab templates today from Slidegeeks.
-
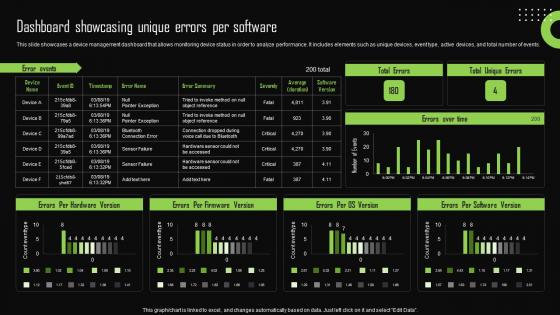
Dashboard Showcasing Unique Errors Per Software Iot Device Management Infographics Pdf
This slide showcases a device management dashboard that allows monitoring device status in order to analyze performance. It includes elements such as unique devices, event type, active devices, and total number of events. If you are looking for a format to display your unique thoughts, then the professionally designed Dashboard Showcasing Unique Errors Per Software Iot Device Management Infographics Pdf is the one for you. You can use it as a Google Slides template or a PowerPoint template. Incorporate impressive visuals, symbols, images, and other charts. Modify or reorganize the text boxes as you desire. Experiment with shade schemes and font pairings. Alter, share or cooperate with other people on your work. Download Dashboard Showcasing Unique Errors Per Software Iot Device Management Infographics Pdf and find out how to give a successful presentation. Present a perfect display to your team and make your presentation unforgettable.
-
Dashboard To Track Binary Multi Level Effective Network Marketing Promotion Tactics Infographics Pdf
This slide represents metric dashboard that helps marketers in tracking and managing binary network marketing. It covers KPIs such as network bonus, expenditure, profit etc. Here you can discover an assortment of the finest PowerPoint and Google Slides templates. With these templates, you can create presentations for a variety of purposes while simultaneously providing your audience with an eye catching visual experience. Download Dashboard To Track Binary Multi Level Effective Network Marketing Promotion Tactics Infographics Pdf to deliver an impeccable presentation. These templates will make your job of preparing presentations much quicker, yet still, maintain a high level of quality. Slidegeeks has experienced researchers who prepare these templates and write high quality content for you. Later on, you can personalize the content by editing the Dashboard To Track Binary Multi Level Effective Network Marketing Promotion Tactics Infographics Pdf.


