Dashboard and kpis PowerPoint Presentation Templates and Google Slides
-
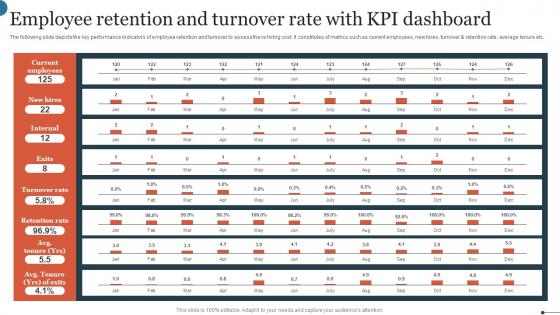
Employee Retention And Turnover Rate With KPI Dashboard Graphics Pdf
The following slide depicts the key performance indicators of employee retention and turnover to assess the re hiring cost. It constitutes of metrics such as current employees, new hires, turnover and retention rate, average tenure etc. Showcasing this set of slides titled Employee Retention And Turnover Rate With KPI Dashboard Graphics Pdf. The topics addressed in these templates are Current Employees, Turnover Rate, Retention Rate. All the content presented in this PPT design is completely editable. Download it and make adjustments in color, background, font etc. as per your unique business setting.
-
Bounce Rate KPI Tracking Dashboard With Average Pages And Time Inspiration Pdf
The following slide showcases dashboard that helps to identify the average time spent on page by visitors and the bounce rate. It also includes page load time, bounce rate by browser and details on internet explorer. Pitch your topic with ease and precision using this Bounce Rate KPI Tracking Dashboard With Average Pages And Time Inspiration Pdf. This layout presents information on Page Load Time, Bounce Rate, Internet Explorer. It is also available for immediate download and adjustment. So, changes can be made in the color, design, graphics or any other component to create a unique layout.
-
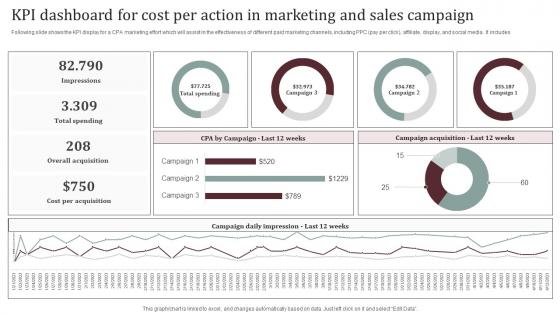
KPI Dashboard For Cost Per Action In Marketing And Sales Campaign Sample Pdf
Following slide shows the KPI display for a CPA marketing effort which will assist in the effectiveness of different paid marketing channels, including PPC pay per click, affiliate, display, and social media. It includes. Showcasing this set of slides titled KPI Dashboard For Cost Per Action In Marketing And Sales Campaign Sample Pdf. The topics addressed in these templates are Campaign Acquisition, Campaign Daily Impression. All the content presented in this PPT design is completely editable. Download it and make adjustments in color, background, font etc. as per your unique business setting.
-
Learning And Improvement KPI Dashboard Ppt Powerpoint Presentation Complete Deck With Slides
This Learning And Improvement KPI Dashboard Ppt Powerpoint Presentation Complete Deck With Slides acts as backup support for your ideas, vision, thoughts, etc. Use it to present a thorough understanding of the topic. This PPT slideshow can be utilized for both in-house and outside presentations depending upon your needs and business demands. Entailing fourteen slides with a consistent design and theme, this template will make a solid use case. As it is intuitively designed, it suits every business vertical and industry. All you have to do is make a few tweaks in the content or any other component to design unique presentations. The biggest advantage of this complete deck is that it can be personalized multiple times once downloaded. The color, design, shapes, and other elements are free to modify to add personal touches. You can also insert your logo design in this PPT layout. Therefore a well-thought and crafted presentation can be delivered with ease and precision by downloading this Learning And Improvement KPI Dashboard Ppt Powerpoint Presentation Complete Deck With Slides PPT slideshow.
-
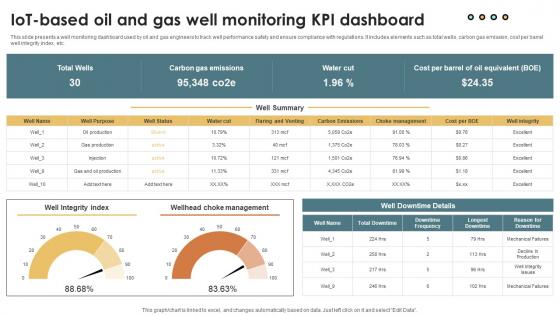
IoT Solutions For Oil IoT Based Oil And Gas Well Monitoring KPI Dashboard IoT SS V
This slide presents a well monitoring dashboard used by oil and gas engineers to track well performance safety and ensure compliance with regulations. It includes elements such as total wells, carbon gas emission, cost per barrel well integrity index, etc. This modern and well-arranged IoT Solutions For Oil IoT Based Oil And Gas Well Monitoring KPI Dashboard IoT SS V provides lots of creative possibilities. It is very simple to customize and edit with the Powerpoint Software. Just drag and drop your pictures into the shapes. All facets of this template can be edited with Powerpoint, no extra software is necessary. Add your own material, put your images in the places assigned for them, adjust the colors, and then you can show your slides to the world, with an animated slide included.
-
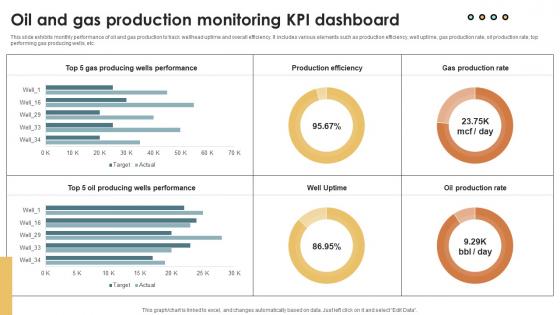
IoT Solutions For Oil Oil And Gas Production Monitoring KPI Dashboard IoT SS V
This slide exhibits monthly performance of oil and gas production to track wellhead uptime and overall efficiency. It includes various elements such as production efficiency, well uptime, gas production rate, oil production rate, top performing gas producing wells, etc. Take your projects to the next level with our ultimate collection of IoT Solutions For Oil Oil And Gas Production Monitoring KPI Dashboard IoT SS V. Slidegeeks has designed a range of layouts that are perfect for representing task or activity duration, keeping track of all your deadlines at a glance. Tailor these designs to your exact needs and give them a truly corporate look with your own brand colors they will make your projects stand out from the rest
-
Strategies To Build Meaningful Dashboard And Kpi For Evaluating Overall Employee Icons Pdf
The slide showcases dashboard and KPI evaluating employees overall performance and how employee working is going on in an organization . It contains KPIs such as employee absenteeism , employee overtime hours, employee training costs, overall employee effectiveness . Create an editable Strategies To Build Meaningful Dashboard And Kpi For Evaluating Overall Employee Icons Pdf that communicates your idea and engages your audience. Whether you are presenting a business or an educational presentation, pre-designed presentation templates help save time. Strategies To Build Meaningful Dashboard And Kpi For Evaluating Overall Employee Icons Pdf is highly customizable and very easy to edit, covering many different styles from creative to business presentations. Slidegeeks has creative team members who have crafted amazing templates. So, go and get them without any delay.
-
Cash Performance Analysis With KPI Dashboard Objectives And Key Result Methodology For Business
The following slide depicts finance performance of company to manage cash transactions and invest finances appropriately. It includes elements such as quick ratio, current ratio, payables outstanding, sales outstanding, working capital etc. Do you have to make sure that everyone on your team knows about any specific topic I yes, then you should give Cash Performance Analysis With KPI Dashboard Objectives And Key Result Methodology For Business a try. Our experts have put a lot of knowledge and effort into creating this impeccable Cash Performance Analysis With KPI Dashboard Objectives And Key Result Methodology For Business. You can use this template for your upcoming presentations, as the slides are perfect to represent even the tiniest detail. You can download these templates from the Slidegeeks website and these are easy to edit. So grab these today
-
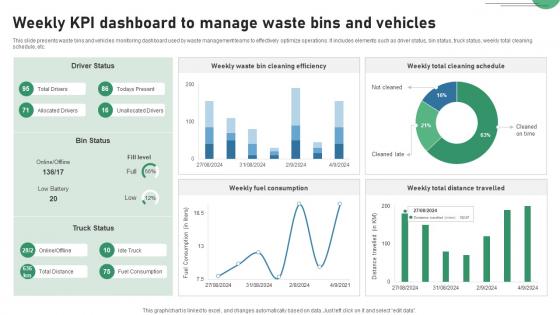
Weekly KPI Dashboard To Manage Waste Bins And Vehicles IOT Applications In Smart Waste IoT SS V
This slide presents waste bins and vehicles monitoring dashboard used by waste management teams to effectively optimize operations. It includes elements such as driver status, bin status, truck status, weekly total cleaning schedule, etc. Find highly impressive Weekly KPI Dashboard To Manage Waste Bins And Vehicles IOT Applications In Smart Waste IoT SS V on Slidegeeks to deliver a meaningful presentation. You can save an ample amount of time using these presentation templates. No need to worry to prepare everything from scratch because Slidegeeks experts have already done a huge research and work for you. You need to download Weekly KPI Dashboard To Manage Waste Bins And Vehicles IOT Applications In Smart Waste IoT SS V for your upcoming presentation. All the presentation templates are 100 percent editable and you can change the color and personalize the content accordingly. Download now.
-
KPI Dashboard To Analyze Website Traffic Developing And Creating Digital Content Strategy SS V
The following slide showcases KPI dashboard to assess web traffic and content performance. It includes elements such as visitors by channel, overall conversion rate, search, direct, referral etc. The best PPT templates are a great way to save time, energy, and resources. Slidegeeks have 100 percent editable powerpoint slides making them incredibly versatile. With these quality presentation templates, you can create a captivating and memorable presentation by combining visually appealing slides and effectively communicating your message. Download KPI Dashboard To Analyze Website Traffic Developing And Creating Digital Content Strategy SS V from Slidegeeks and deliver a wonderful presentation.
-
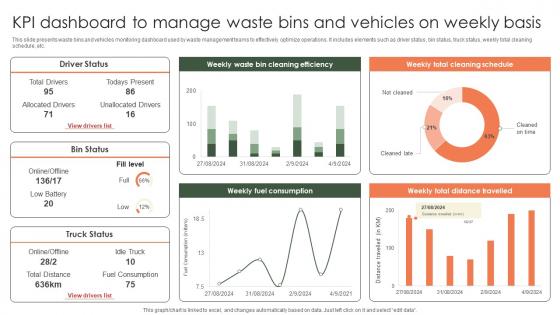
Kpi Dashboard To Manage Waste Bins And Vehicles On Weekly Implementation Of E Waste Guidelines
This slide presents waste bins and vehicles monitoring dashboard used by waste management teams to effectively optimize operations. It includes elements such as driver status, bin status, truck status, weekly total cleaning schedule, etc. Welcome to our selection of the Kpi Dashboard To Manage Waste Bins And Vehicles On Weekly Implementation Of E Waste Guidelines. These are designed to help you showcase your creativity and bring your sphere to life. Planning and Innovation are essential for any business that is just starting out. This collection contains the designs that you need for your everyday presentations. All of our PowerPoints are 100 percent editable, so you can customize them to suit your needs. This multi-purpose template can be used in various situations. Grab these presentation templates today.
-
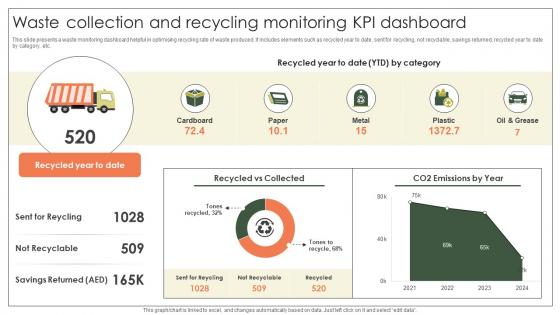
Waste Collection And Recycling Monitoring Kpi Dashboard Implementation Of E Waste Guidelines
This slide presents a waste monitoring dashboard helpful in optimising recycling rate of waste produced. It includes elements such as recycled year to date, sent for recycling, not recyclable, savings returned, recycled year to date by category, etc. From laying roadmaps to briefing everything in detail, our templates are perfect for you. You can set the stage with your presentation slides. All you have to do is download these easy-to-edit and customizable templates. Waste Collection And Recycling Monitoring Kpi Dashboard Implementation Of E Waste Guidelines will help you deliver an outstanding performance that everyone would remember and praise you for. Do download this presentation today.
-
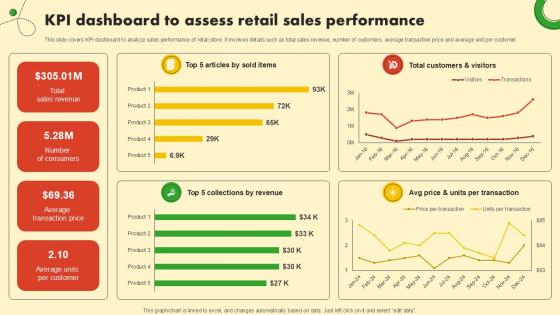
KPI Dashboard To Assess Retail Sales Food And Grocery Retail Ppt Sample
This slide covers KPI dashboard to analyze sales performance of retail store. It involves details such as total sales revenue, number of customers, average transaction price and average unit per customer. From laying roadmaps to briefing everything in detail, our templates are perfect for you. You can set the stage with your presentation slides. All you have to do is download these easy-to-edit and customizable templates. KPI Dashboard To Assess Retail Sales Food And Grocery Retail Ppt Sample will help you deliver an outstanding performance that everyone would remember and praise you for. Do download this presentation today.
-
KPI Dashboard To Assess Retail Store Food And Grocery Retail Ppt Presentation
This slide covers dashboard to analyze customer retention rate in retail store post implementing strategies. It involves KPIs such as sales square foot on location basis, total number of units per transaction and net profit. Present like a pro with KPI Dashboard To Assess Retail Store Food And Grocery Retail Ppt Presentation. Create beautiful presentations together with your team, using our easy-to-use presentation slides. Share your ideas in real-time and make changes on the fly by downloading our templates. So whether you are in the office, on the go, or in a remote location, you can stay in sync with your team and present your ideas with confidence. With Slidegeeks presentation got a whole lot easier. Grab these presentations today.
-
Retail KPI Dashboard To Track Food And Grocery Retail Ppt Slide
This slide covers retail dashboard to track number of visitors to assess retail store performance. It involves details such as total revenue generated by different stores, sales and gross profit by product category and average basket value. This Retail KPI Dashboard To Track Food And Grocery Retail Ppt Slide is perfect for any presentation, be it in front of clients or colleagues. It is a versatile and stylish solution for organizing your meetings. The Retail KPI Dashboard To Track Food And Grocery Retail Ppt Slide features a modern design for your presentation meetings. The adjustable and customizable slides provide unlimited possibilities for acing up your presentation. Slidegeeks has done all the homework before launching the product for you. So, do not wait, grab the presentation templates today


