IoT Solutions For Oil IoT Based Oil And Gas Well Monitoring KPI Dashboard IoT SS V
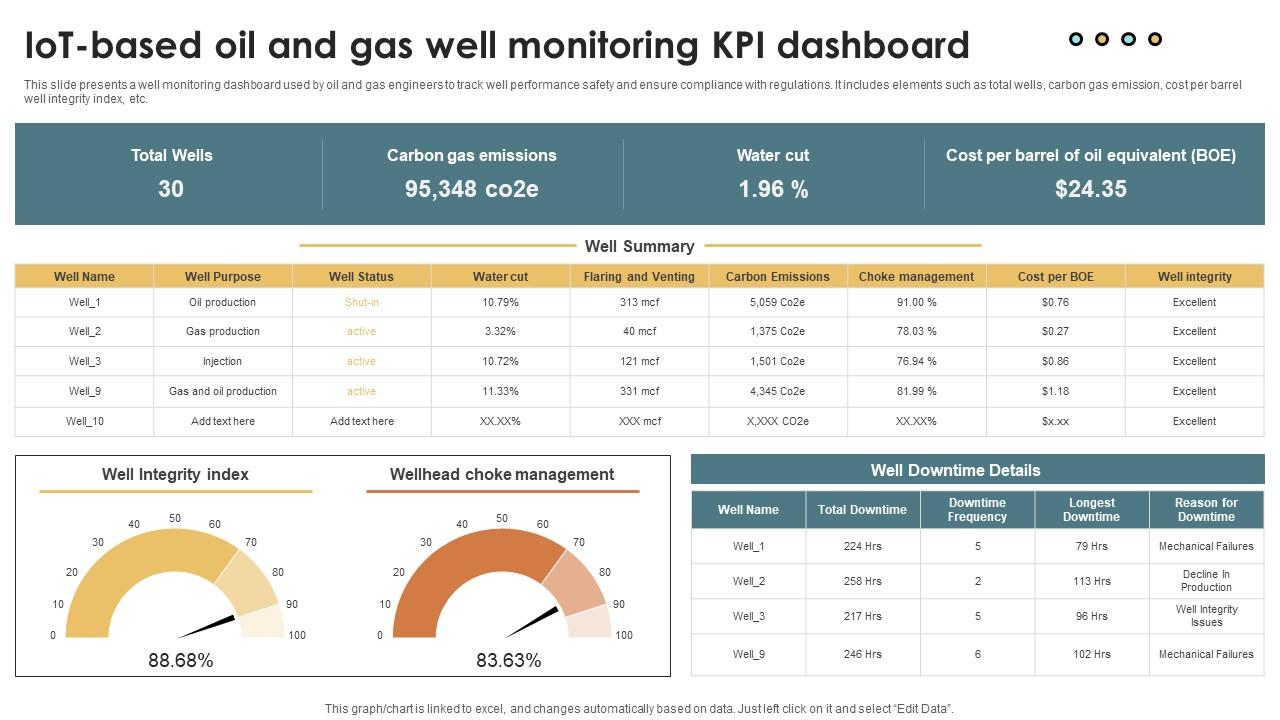
This slide presents a well monitoring dashboard used by oil and gas engineers to track well performance safety and ensure compliance with regulations. It includes elements such as total wells, carbon gas emission, cost per barrel well integrity index, etc.
- Google Slides is a new FREE Presentation software from Google.
- All our content is 100% compatible with Google Slides.
- Just download our designs, and upload them to Google Slides and they will work automatically.
- Amaze your audience with SlideGeeks and Google Slides.
-
Want Changes to This PPT Slide? Check out our Presentation Design Services
- WideScreen Aspect ratio is becoming a very popular format. When you download this product, the downloaded ZIP will contain this product in both standard and widescreen format.
-

- Some older products that we have may only be in standard format, but they can easily be converted to widescreen.
- To do this, please open the SlideGeeks product in Powerpoint, and go to
- Design ( On the top bar) -> Page Setup -> and select "On-screen Show (16:9)” in the drop down for "Slides Sized for".
- The slide or theme will change to widescreen, and all graphics will adjust automatically. You can similarly convert our content to any other desired screen aspect ratio.
Compatible With Google Slides

Get This In WideScreen
You must be logged in to download this presentation.
 Impress Your
 Audience
 100%
100% Editable
Google Slides
Features of these PowerPoint presentation slides:
This slide presents a well monitoring dashboard used by oil and gas engineers to track well performance safety and ensure compliance with regulations. It includes elements such as total wells, carbon gas emission, cost per barrel well integrity index, etc. This modern and well-arranged IoT Solutions For Oil IoT Based Oil And Gas Well Monitoring KPI Dashboard IoT SS V provides lots of creative possibilities. It is very simple to customize and edit with the Powerpoint Software. Just drag and drop your pictures into the shapes. All facets of this template can be edited with Powerpoint, no extra software is necessary. Add your own material, put your images in the places assigned for them, adjust the colors, and then you can show your slides to the world, with an animated slide included. This slide presents a well monitoring dashboard used by oil and gas engineers to track well performance safety and ensure compliance with regulations. It includes elements such as total wells, carbon gas emission, cost per barrel well integrity index, etc.
People who downloaded this PowerPoint presentation also viewed the following :
IoT Solutions For Oil IoT Based Oil And Gas Well Monitoring KPI Dashboard IoT SS V with all 10 slides:
Use our IoT Solutions For Oil IoT Based Oil And Gas Well Monitoring KPI Dashboard IoT SS V to effectively help you save your valuable time. They are readymade to fit into any presentation structure.
Most Relevant Reviews
-
Innovative and Colorful designs.
-
Unique research projects to present in meeting.

 Home
Home 


