Businesses dashboards PowerPoint Presentation Templates and Google Slides
-
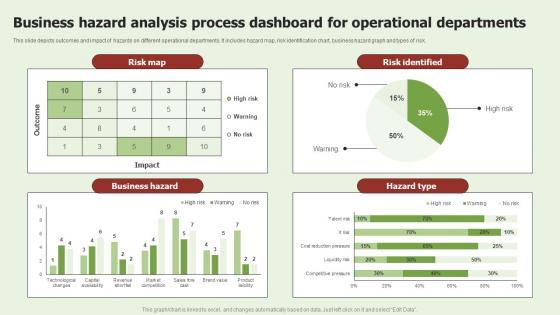
Business Hazard Analysis Process Dashboard For Operational Departments Microsoft Pdf
This slide depicts outcomes and impact of hazards on different operational departments. It includes hazard map, risk identification chart, business hazard graph and types of risk. Pitch your topic with ease and precision using this Business Hazard Analysis Process Dashboard For Operational Departments Microsoft Pdf. This layout presents information on Risk Map, Business Hazard, Hazard Type. It is also available for immediate download and adjustment. So, changes can be made in the color, design, graphics or any other component to create a unique layout.
-
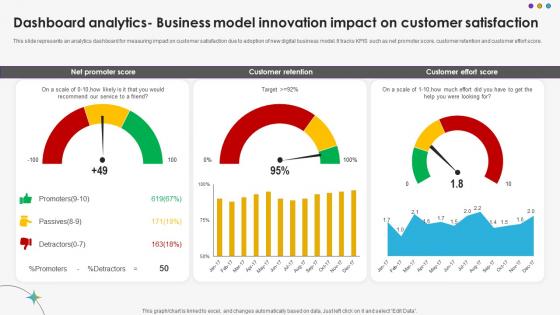
Dashboard Analytics Business Model Innovation Impact On Customer Satisfaction DT SS V
This slide represents an analytics dashboard for measuring impact on customer satisfaction due to adoption of new digital business model. It tracks KPIS such as net promoter score, customer retention and customer effort score.The Dashboard Analytics Business Model Innovation Impact On Customer Satisfaction DT SS V is a compilation of the most recent design trends as a series of slides. It is suitable for any subject or industry presentation, containing attractive visuals and photo spots for businesses to clearly express their messages. This template contains a variety of slides for the user to input data, such as structures to contrast two elements, bullet points, and slides for written information. Slidegeeks is prepared to create an impression.
-
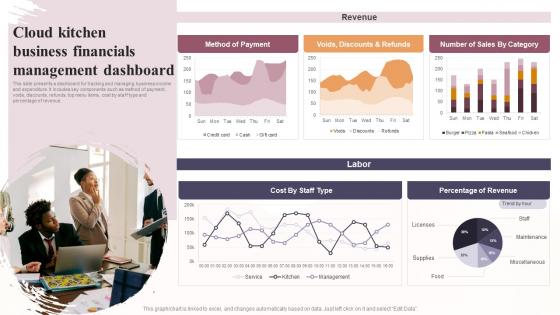
Cloud Kitchen Business Financials Management Dashboard Global Virtual Restaurant Mockup Pdf
This slide presents a dashboard for tracking and managing business income and expenditure. It includes key components such as method of payment, voids, discounts, refunds, top menu items, cost by staff type and percentage of revenue. If you are looking for a format to display your unique thoughts, then the professionally designed Cloud Kitchen Business Financials Management Dashboard Global Virtual Restaurant Mockup Pdf is the one for you. You can use it as a Google Slides template or a PowerPoint template. Incorporate impressive visuals, symbols, images, and other charts. Modify or reorganize the text boxes as you desire. Experiment with shade schemes and font pairings. Alter, share or cooperate with other people on your work. Download Cloud Kitchen Business Financials Management Dashboard Global Virtual Restaurant Mockup Pdf and find out how to give a successful presentation. Present a perfect display to your team and make your presentation unforgettable.
-
Cloud Kitchen Business Performance Management Dashboard Global Virtual Restaurant Structure Pdf
This slide highlights a dashboard to track and manage performance progress of a dark kitchen business. It showcases components such as income, expense, order rate, activity, total order complete, total order delivered, total order cancelled, order pending and popular food. Crafting an eye-catching presentation has never been more straightforward. Let your presentation shine with this tasteful yet straightforward Cloud Kitchen Business Performance Management Dashboard Global Virtual Restaurant Structure Pdf template. It offers a minimalistic and classy look that is great for making a statement. The colors have been employed intelligently to add a bit of playfulness while still remaining professional. Construct the ideal Cloud Kitchen Business Performance Management Dashboard Global Virtual Restaurant Structure Pdf that effortlessly grabs the attention of your audience. Begin now and be certain to wow your customers.
-
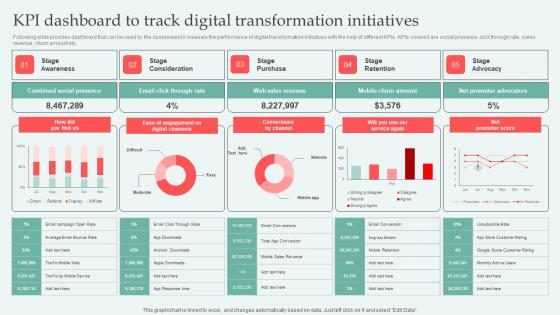
KPI Dashboard To Track Digital Approaches To Increase Business Growth Professional Pdf
Following slide provides dashboard that can be used by the businesses to measure the performance of digital transformation initiatives with the help of different KPIs. KPIs covered are social presence, click through rate, sales revenue, churn amount etc. If your project calls for a presentation, then Slidegeeks is your go to partner because we have professionally designed, easy to edit templates that are perfect for any presentation. After downloading, you can easily edit KPI Dashboard To Track Digital Approaches To Increase Business Growth Professional Pdf and make the changes accordingly. You can rearrange slides or fill them with different images. Check out all the handy templates
-
Performance Tracking KPI Dashboard Digital Approaches To Increase Business Growth Summary Pdf
Mentioned slide provides information about the key performance indicators that can be used by managers to measure the success of digital marketing strategy, KPIs covered are status, progress, priority and timeline. Formulating a presentation can take up a lot of effort and time, so the content and message should always be the primary focus. The visuals of the PowerPoint can enhance the presenters message, so our Performance Tracking KPI Dashboard Digital Approaches To Increase Business Growth Summary Pdf was created to help save time. Instead of worrying about the design, the presenter can concentrate on the message while our designers work on creating the ideal templates for whatever situation is needed. Slidegeeks has experts for everything from amazing designs to valuable content, we have put everything into Performance Tracking KPI Dashboard Digital Approaches To Increase Business Growth Summary Pdf
-
Techniques To Optimize Business Performance Dashboard To Evaluate Display Advertising Inspiration Pdf
This slide provides a dashboard to assess the rate of conversion and cost of display advertising campaign by different sources. It includes source, average cost of marketing, conversion, click, revenue, impression by source. Find highly impressive Techniques To Optimize Business Performance Dashboard To Evaluate Display Advertising Inspiration Pdf on Slidegeeks to deliver a meaningful presentation. You can save an ample amount of time using these presentation templates. No need to worry to prepare everything from scratch because Slidegeeks experts have already done a huge research and work for you. You need to download Techniques To Optimize Business Performance Dashboard To Evaluate Display Advertising Inspiration Pdf for your upcoming presentation. All the presentation templates are 100 percent editable and you can change the color and personalize the content accordingly. Download now.
-
Techniques To Optimize Business Performance Dashboard To Measure Display Advertising Icons Pdf
This slide provides a dashboard to monitor the display advertising campaign performance in order to reduce overall marketing cost. It incorporates advertising cost, average number of clicks and impressions, clicks per day, revenue by campaign, etc. If your project calls for a presentation, then Slidegeeks is your go-to partner because we have professionally designed, easy-to-edit templates that are perfect for any presentation. After downloading, you can easily edit Techniques To Optimize Business Performance Dashboard To Measure Display Advertising Icons Pdf and make the changes accordingly. You can rearrange slides or fill them with different images. Check out all the handy templates
-
Cash Performance Analysis With KPI Dashboard Objectives And Key Result Methodology For Business
The following slide depicts finance performance of company to manage cash transactions and invest finances appropriately. It includes elements such as quick ratio, current ratio, payables outstanding, sales outstanding, working capital etc. Do you have to make sure that everyone on your team knows about any specific topic I yes, then you should give Cash Performance Analysis With KPI Dashboard Objectives And Key Result Methodology For Business a try. Our experts have put a lot of knowledge and effort into creating this impeccable Cash Performance Analysis With KPI Dashboard Objectives And Key Result Methodology For Business. You can use this template for your upcoming presentations, as the slides are perfect to represent even the tiniest detail. You can download these templates from the Slidegeeks website and these are easy to edit. So grab these today
-
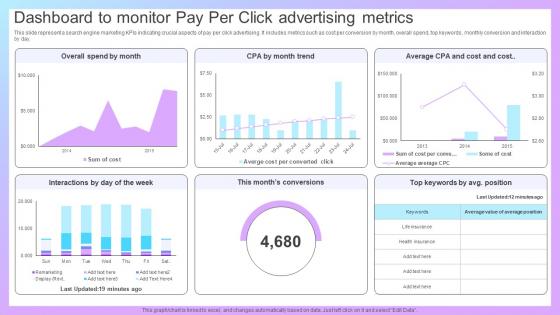
Increasing Business Awareness Dashboard To Monitor Pay Per Click Advertising Strategy SS V
This slide represent a search engine marketing KPIs indicating crucial aspects of pay per click advertising. It includes metrics such as cost per conversion by month, overall spend, top keywords, monthly conversion and interaction by day. Get a simple yet stunning designed Increasing Business Awareness Dashboard To Monitor Pay Per Click Advertising Strategy SS V. It is the best one to establish the tone in your meetings. It is an excellent way to make your presentations highly effective. So, download this PPT today from Slidegeeks and see the positive impacts. Our easy-to-edit Increasing Business Awareness Dashboard To Monitor Pay Per Click Advertising Strategy SS V can be your go-to option for all upcoming conferences and meetings. So, what are you waiting for Grab this template today.
-
Increasing Business Awareness Tracking Dashboard For Social Media Engagement Strategy SS V
This slide represents a dashboard tracking multiple social media campaigns performance KPIs. It includes metrics such as average impressions per post, average reach, engagement rate, click through rate, reactions and CTR. This Increasing Business Awareness Tracking Dashboard For Social Media Engagement Strategy SS V is perfect for any presentation, be it in front of clients or colleagues. It is a versatile and stylish solution for organizing your meetings. The Increasing Business Awareness Tracking Dashboard For Social Media Engagement Strategy SS V features a modern design for your presentation meetings. The adjustable and customizable slides provide unlimited possibilities for acing up your presentation. Slidegeeks has done all the homework before launching the product for you. So, do not wait, grab the presentation templates today
-
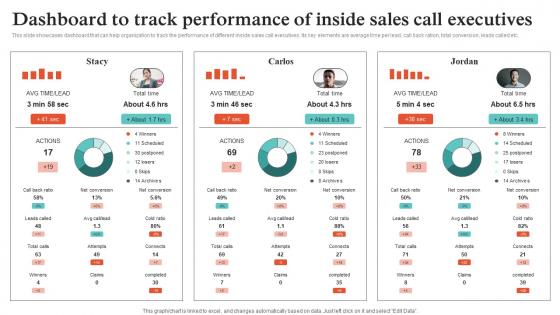
Virtual Sales Strategies For Business Dashboard To Track Performance Of Inside Strategy SS V
This slide showcases dashboard that can help organization to track the performance of different inside sales call executives. Its key elements are average time per lead, call back ration, total conversion, leads called etc. Make sure to capture your audiences attention in your business displays with our gratis customizable Virtual Sales Strategies For Business Dashboard To Track Performance Of Inside Strategy SS V. These are great for business strategies, office conferences, capital raising or task suggestions. If you desire to acquire more customers for your tech business and ensure they stay satisfied, create your own sales presentation with these plain slides.
-
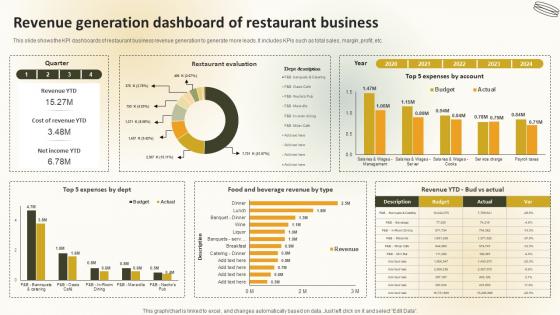
Revenue Generation Dashboard Of Restaurant Business Create An Effective Restaurant
This slide shows the KPI dashboards of restaurant business revenue generation to generate more leads. It includes KPIs such as total sales, margin,profit, etc. Present like a pro with Revenue Generation Dashboard Of Restaurant Business Create An Effective Restaurant. Create beautiful presentations together with your team, using our easy-to-use presentation slides. Share your ideas in real-time and make changes on the fly by downloading our templates. So whether you are in the office, on the go, or in a remote location, you can stay in sync with your team and present your ideas with confidence. With Slidegeeks presentation got a whole lot easier. Grab these presentations today.
-
Improving Business Marketing Performance Dashboard To Track Influencer CRP DK SS V
This slide showcases influencer marketing performance assessment dashboard with KPI metrics such as media engagement, likes, comments, impressions etc. Are you in need of a template that can accommodate all of your creative concepts This one is crafted professionally and can be altered to fit any style. Use it with Google Slides or PowerPoint. Include striking photographs, symbols, depictions, and other visuals. Fill, move around, or remove text boxes as desired. Test out color palettes and font mixtures. Edit and save your work, or work with colleagues. Download Improving Business Marketing Performance Dashboard To Track Influencer CRP DK SS V and observe how to make your presentation outstanding. Give an impeccable presentation to your group and make your presentation unforgettable.
-
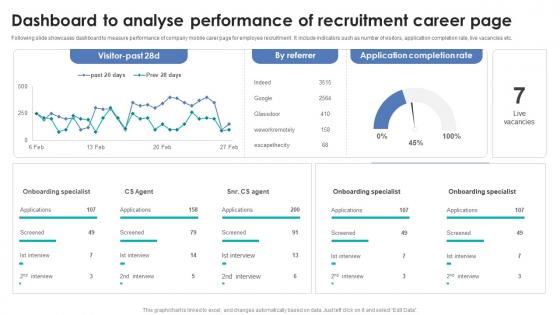
Integrating Automation For Effective Business Dashboard To Analyse Performance Of Recruitment
Following slide showcases dashboard to measure performance of company mobile carer page for employee recruitment . It include indicators such as number of visitors, application completion rate, live vacancies etc. Present like a pro with Integrating Automation For Effective Business Dashboard To Analyse Performance Of Recruitment. Create beautiful presentations together with your team, using our easy-to-use presentation slides. Share your ideas in real-time and make changes on the fly by downloading our templates. So whether you are in the office, on the go, or in a remote location, you can stay in sync with your team and present your ideas with confidence. With Slidegeeks presentation got a whole lot easier. Grab these presentations today.
-
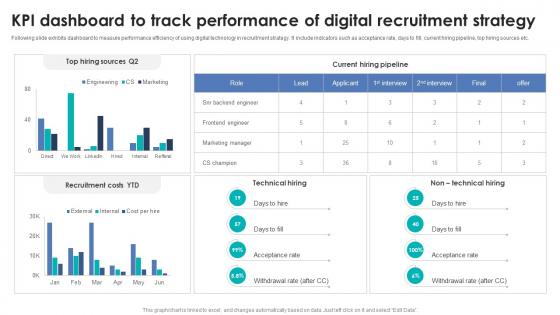
Integrating Automation For Effective Business Kpi Dashboard To Track Performance Of Digital
Following slide exhibits dashboard to measure performance efficiency of using digital technology in recruitment strategy. It include indicators such as acceptance rate, days to fill, current hiring pipeline, top hiring sources etc. Crafting an eye-catching presentation has never been more straightforward. Let your presentation shine with this tasteful yet straightforward Integrating Automation For Effective Business Kpi Dashboard To Track Performance Of Digital template. It offers a minimalistic and classy look that is great for making a statement. The colors have been employed intelligently to add a bit of playfulness while still remaining professional. Construct the ideal Integrating Automation For Effective Business Kpi Dashboard To Track Performance Of Digital that effortlessly grabs the attention of your audience Begin now and be certain to wow your customers
-
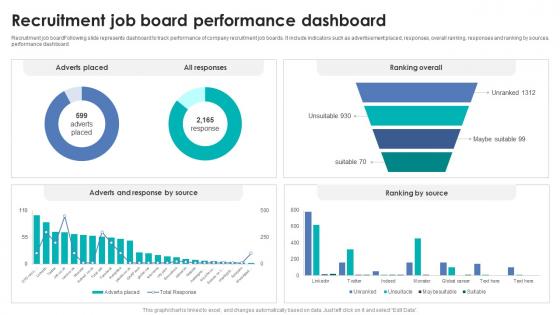
Integrating Automation For Effective Business Recruitment Job Board Performance Dashboard
Recruitment job boardFollowing slide represents dashboard to track performance of company recruitment job boards. It include indicators such as advertisement placed, responses, overall ranking, responses and ranking by sources performance dashboard. Presenting this PowerPoint presentation, titled Integrating Automation For Effective Business Recruitment Job Board Performance Dashboard, with topics curated by our researchers after extensive research. This editable presentation is available for immediate download and provides attractive features when used. Download now and captivate your audience. Presenting this Integrating Automation For Effective Business Recruitment Job Board Performance Dashboard. Our researchers have carefully researched and created these slides with all aspects taken into consideration. This is a completely customizable Integrating Automation For Effective Business Recruitment Job Board Performance Dashboard that is available for immediate downloading. Download now and make an impact on your audience. Highlight the attractive features available with our PPTs.
-
Product Analytics Dashboard To Track Engagement Driving Business Success Integrating Product
This slide illustrates a dashboard to monitor customer engagement on company website by leveraging product analytics tools aimed at making necessary improvements. It covers insights regarding active monthly users, new users, total completed purchases, screen views, average duration of session, etc. There are so many reasons you need a Product Analytics Dashboard To Track Engagement Driving Business Success Integrating Product. The first reason is you can not spend time making everything from scratch, Thus, Slidegeeks has made presentation templates for you too. You can easily download these templates from our website easily.
-
Product Analytics Kpi Dashboard For Lead Generation Driving Business Success Integrating Product
This slide illustrates a dashboard to monitor the lead generation on website page using product analytics aimed at making necessary improvements. It covers insights regarding analysis of lead conversions, event retention rate and page views Do you have to make sure that everyone on your team knows about any specific topic I yes, then you should give Product Analytics Kpi Dashboard For Lead Generation Driving Business Success Integrating Product a try. Our experts have put a lot of knowledge and effort into creating this impeccable Product Analytics Kpi Dashboard For Lead Generation Driving Business Success Integrating Product. You can use this template for your upcoming presentations, as the slides are perfect to represent even the tiniest detail. You can download these templates from the Slidegeeks website and these are easy to edit. So grab these today
-
Performance Tracking Dashboard For Food Product And Beverage Business
The slide showcases dashboard representing food and beverage business performance tracking tool , which assist to evaluate monthly performance of employees, customer retention etc. Slidegeeks has constructed Performance Tracking Dashboard For Food Product And Beverage Business after conducting extensive research and examination. These presentation templates are constantly being generated and modified based on user preferences and critiques from editors. Here, you will find the most attractive templates for a range of purposes while taking into account ratings and remarks from users regarding the content. This is an excellent jumping-off point to explore our content and will give new users an insight into our top-notch PowerPoint Templates.
-
Deploying Strategies For Business KPI Dashboard To Track Product Performance Strategy SS V
This slide represents KPI dashboard for measuring product performance. It covers total activities, new customers, events, net promoter score. Coming up with a presentation necessitates that the majority of the effort goes into the content and the message you intend to convey. The visuals of a PowerPoint presentation can only be effective if it supplements and supports the story that is being told. Keeping this in mind our experts created Deploying Strategies For Business KPI Dashboard To Track Product Performance Strategy SS V to reduce the time that goes into designing the presentation. This way, you can concentrate on the message while our designers take care of providing you with the right template for the situation.
-
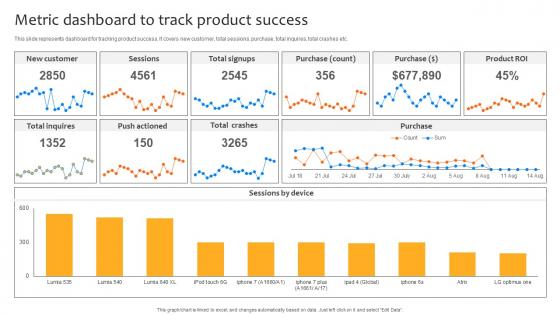
Deploying Strategies For Business Metric Dashboard To Track Product Success Strategy SS V
This slide represents dashboard for tracking product success. It covers new customer, total sessions, purchase, total inquires, total crashes etc. Explore a selection of the finest Deploying Strategies For Business Metric Dashboard To Track Product Success Strategy SS V here. With a plethora of professionally designed and pre-made slide templates, you can quickly and easily find the right one for your upcoming presentation. You can use our Deploying Strategies For Business Metric Dashboard To Track Product Success Strategy SS V to effectively convey your message to a wider audience. Slidegeeks has done a lot of research before preparing these presentation templates. The content can be personalized and the slides are highly editable. Grab templates today from Slidegeeks.
-
Deploying Strategies For Business Product Line Market Performance Assessment Dashboard Strategy SS V
This slide showcases market analysis KPI dashboard for checking performance of product line items. It provides details about product revenue, revenue breakdown, time to market, existing products, etc. Take your projects to the next level with our ultimate collection of Deploying Strategies For Business Product Line Market Performance Assessment Dashboard Strategy SS V. Slidegeeks has designed a range of layouts that are perfect for representing task or activity duration, keeping track of all your deadlines at a glance. Tailor these designs to your exact needs and give them a truly corporate look with your own brand colors they will make your projects stand out from the rest
-
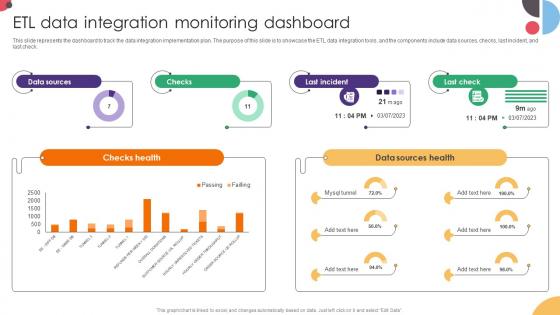
ETL Data Integration Monitoring Dashboard Data Integration Strategies For Business
This slide represents the dashboard to track the data integration implementation plan. The purpose of this slide is to showcase the ETL data integration tools, and the components include data sources, checks, last incident, and last check. Are you searching for a ETL Data Integration Monitoring Dashboard Data Integration Strategies For Business that is uncluttered, straightforward, and original Its easy to edit, and you can change the colors to suit your personal or business branding. For a presentation that expresses how much effort you have put in, this template is ideal With all of its features, including tables, diagrams, statistics, and lists, its perfect for a business plan presentation. Make your ideas more appealing with these professional slides. Download ETL Data Integration Monitoring Dashboard Data Integration Strategies For Business from Slidegeeks today.
-
KPI Dashboard For Tracking Business Investment Portfolio Investment Fund PPT Example
Mentioned slide demonstrates the key performance indicator dashboard of the business financial portfolio.It includes key elements such as portfolio value, yield cost ratio, annual dividends, unrealized gains, investment style, investment allocation by sectors, etc. Here you can discover an assortment of the finest PowerPoint and Google Slides templates. With these templates, you can create presentations for a variety of purposes while simultaneously providing your audience with an eye catching visual experience. Download KPI Dashboard For Tracking Business Investment Portfolio Investment Fund PPT Example to deliver an impeccable presentation. These templates will make your job of preparing presentations much quicker, yet still, maintain a high level of quality. Slidegeeks has experienced researchers who prepare these templates and write high quality content for you. Later on, you can personalize the content by editing the KPI Dashboard For Tracking Business Investment Portfolio Investment Fund PPT Example.


