Businesses dashboards PowerPoint Presentation Templates and Google Slides
-
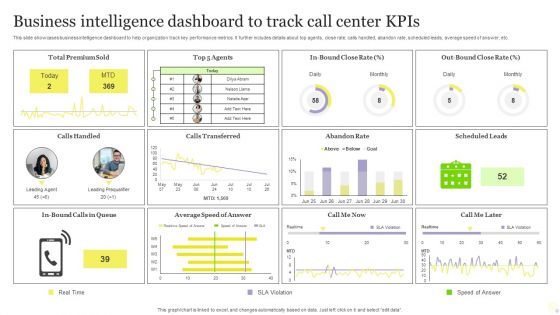
Business Intelligence Dashboard To Track Call Center Kpis Download PDF
This slide showcases business intelligence dashboard to help organization track key performance metrics. It further includes details about top agents, close rate, calls handled, abandon rate, scheduled leads, average speed of answer, etc. Pitch your topic with ease and precision using this Business Intelligence Dashboard To Track Call Center Kpis Download PDF. This layout presents information on Business Intelligence Dashboard, Track Call Center Kpis. It is also available for immediate download and adjustment. So, changes can be made in the color, design, graphics or any other component to create a unique layout.
-
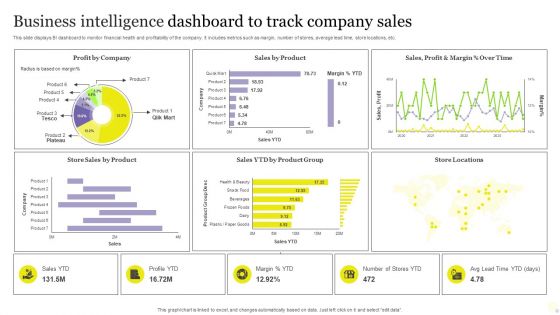
Business Intelligence Dashboard To Track Company Sales Rules PDF
This slide displays BI dashboard to monitor financial health and profitability of the company. It includes metrics such as margin, number of stores, average lead time, store locations, etc. Showcasing this set of slides titled Business Intelligence Dashboard To Track Company Sales Rules PDF. The topics addressed in these templates are Business Intelligence Dashboard, Track Company Sales. All the content presented in this PPT design is completely editable. Download it and make adjustments in color, background, font etc. as per your unique business setting.
-
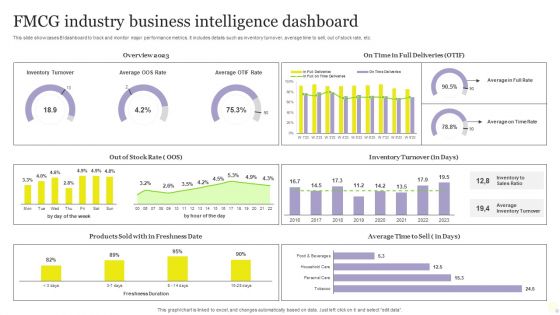
FMCG Industry Business Intelligence Dashboard Mockup PDF
This slide showcases BI dashboard to track and monitor major performance metrics. It includes details such as inventory turnover, average time to sell, out of stock rate, etc. Pitch your topic with ease and precision using this FMCG Industry Business Intelligence Dashboard Mockup PDF. This layout presents information on Average, Inventory Turnover, Business Intelligence Dashboard. It is also available for immediate download and adjustment. So, changes can be made in the color, design, graphics or any other component to create a unique layout.
-
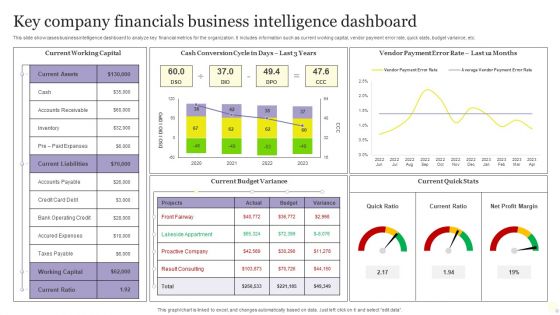
Key Company Financials Business Intelligence Dashboard Graphics PDF
This slide showcases business intelligence dashboard to analyze key financial metrics for the organization. It includes information such as current working capital, vendor payment error rate, quick stats, budget variance, etc. Showcasing this set of slides titled Key Company Financials Business Intelligence Dashboard Graphics PDF. The topics addressed in these templates are Key Company Financials, Business Intelligence Dashboard. All the content presented in this PPT design is completely editable. Download it and make adjustments in color, background, font etc. as per your unique business setting.
-
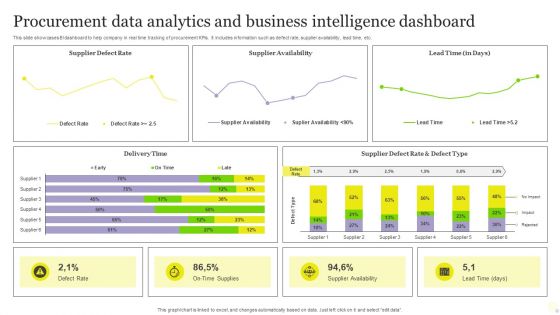
Procurement Data Analytics And Business Intelligence Dashboard Pictures PDF
This slide showcases BI dashboard to help company in real time tracking of procurement KPIs. It includes information such as defect rate, supplier availability, lead time, etc. Pitch your topic with ease and precision using this Procurement Data Analytics And Business Intelligence Dashboard Pictures PDF. This layout presents information on Procurement Data Analytics, Business Intelligence Dashboard. It is also available for immediate download and adjustment. So, changes can be made in the color, design, graphics or any other component to create a unique layout.
-
IT Alignment For Strategic Dashboard For Tracking Business And IT Alignment Professional PDF
This slide depicts the dashboard for business and IT alignment by covering details of total sales, customer support service, percentage of business operations aligned IT, usage of communication channels, and top performer associates. Formulating a presentation can take up a lot of effort and time, so the content and message should always be the primary focus. The visuals of the PowerPoint can enhance the presenters message, so our IT Alignment For Strategic Dashboard For Tracking Business And IT Alignment Professional PDF was created to help save time. Instead of worrying about the design, the presenter can concentrate on the message while our designers work on creating the ideal templates for whatever situation is needed. Slidegeeks has experts for everything from amazing designs to valuable content, we have put everything into IT Alignment For Strategic Dashboard For Tracking Business And IT Alignment Professional PDF.
-
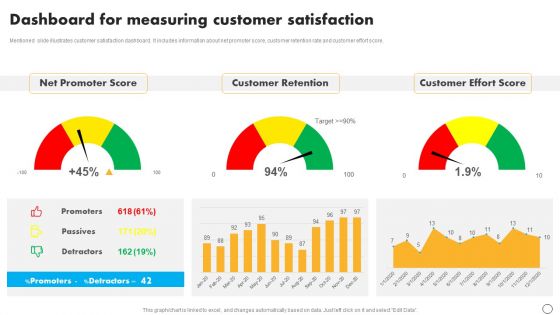
Retail Business Optimization Through Operational Excellence Strategy Dashboard Measuring Customer Template PDF
Mentioned slide illustrates customer satisfaction dashboard. It includes information about net promoter score, customer retention rate and customer effort score. Present like a pro with Retail Business Optimization Through Operational Excellence Strategy Dashboard Measuring Customer Template PDF Create beautiful presentations together with your team, using our easy to use presentation slides. Share your ideas in real time and make changes on the fly by downloading our templates. So whether you are in the office, on the go, or in a remote location, you can stay in sync with your team and present your ideas with confidence. With Slidegeeks presentation got a whole lot easier. Grab these presentations today.
-
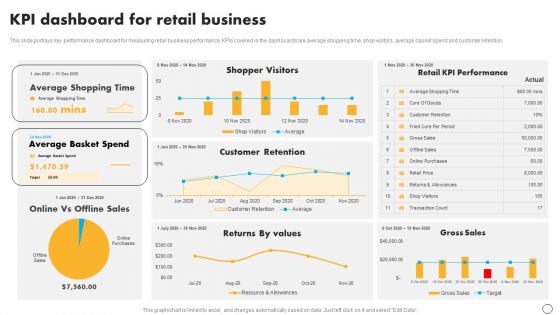
Retail Business Optimization Through Operational Excellence Strategy KPI Dashboard For Retail Business Mockup PDF
This slide portrays key performance dashboard for measuring retail business performance. KPIs covered in the dashboards are average shopping time, shop visitors, average basket spend and customer retention. Boost your pitch with our creative Retail Business Optimization Through Operational Excellence Strategy KPI Dashboard For Retail Business Mockup PDF. Deliver an awe-inspiring pitch that will mesmerize everyone. Using these presentation templates you will surely catch everyones attention. You can browse the ppts collection on our website. We have researchers who are experts at creating the right content for the templates. So you do not have to invest time in any additional work. Just grab the template now and use them.
-
Execution Of ICT Strategic Plan ICT Business Security KPI Dashboard Designs PDF
This slide represents ICT Information and Communication Technology business security dashboard to track threats and incidents. It covers details regarding issues by control type, risk categories, etc. Boost your pitch with our creative Execution Of ICT Strategic Plan ICT Business Security KPI Dashboard Designs PDF. Deliver an awe inspiring pitch that will mesmerize everyone. Using these presentation templates you will surely catch everyones attention. You can browse the ppts collection on our website. We have researchers who are experts at creating the right content for the templates. So you do not have to invest time in any additional work. Just grab the template now and use them.
-
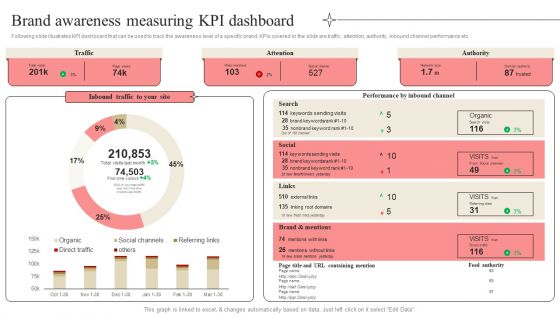
Developing Market Leading Businesses Brand Awareness Measuring KPI Dashboard Themes PDF
Following slide illustrates KPI dashboard that can be used to track the awareness level of a specific brand. KPIs covered in the slide are traffic, attention, authority, inbound channel performance etc. Are you in need of a template that can accommodate all of your creative concepts This one is crafted professionally and can be altered to fit any style. Use it with Google Slides or PowerPoint. Include striking photographs, symbols, depictions, and other visuals. Fill, move around, or remove text boxes as desired. Test out color palettes and font mixtures. Edit and save your work, or work with colleagues. Download Developing Market Leading Businesses Brand Awareness Measuring KPI Dashboard Themes PDF and observe how to make your presentation outstanding. Give an impeccable presentation to your group and make your presentation unforgettable.
-
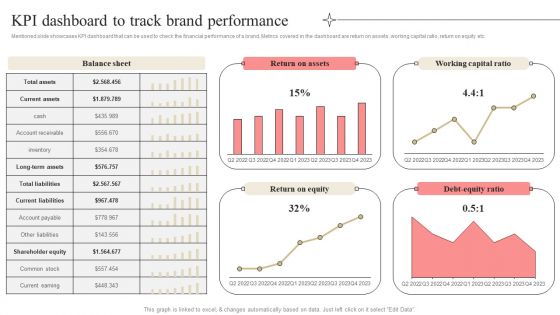
Developing Market Leading Businesses KPI Dashboard To Track Brand Performance Summary PDF
Mentioned slide showcases KPI dashboard that can be used to check the financial performance of a brand. Metrics covered in the dashboard are return on assets, working capital ratio, return on equity etc. Coming up with a presentation necessitates that the majority of the effort goes into the content and the message you intend to convey. The visuals of a PowerPoint presentation can only be effective if it supplements and supports the story that is being told. Keeping this in mind our experts created Developing Market Leading Businesses KPI Dashboard To Track Brand Performance Summary PDF to reduce the time that goes into designing the presentation. This way, you can concentrate on the message while our designers take care of providing you with the right template for the situation.
-
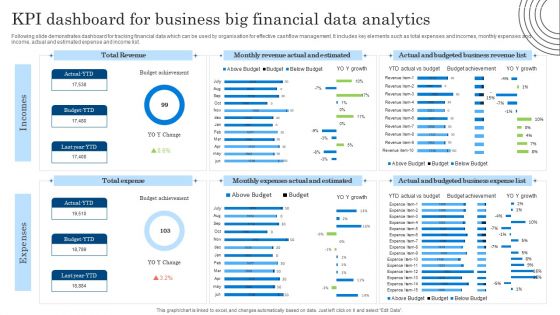
KPI Dashboard For Business Big Financial Data Analytics Diagrams PDF
Following slide demonstrates dashboard for tracking financial data which can be used by organisation for effective cashflow management. It includes key elements such as total expenses and incomes, monthly expenses and income, actual and estimated expense and income list. Showcasing this set of slides titled KPI Dashboard For Business Big Financial Data Analytics Diagrams PDF. The topics addressed in these templates are KPI Dashboard, Business Big Financial, Data Analytics. All the content presented in this PPT design is completely editable. Download it and make adjustments in color, background, font etc. as per your unique business setting.
-
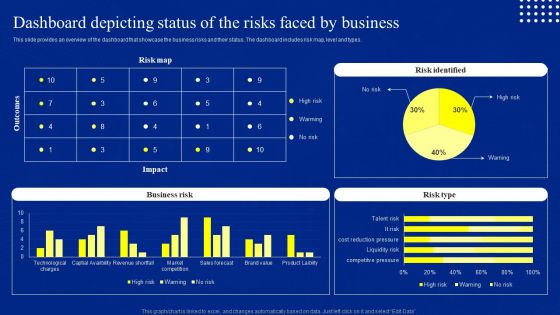
Risk Control And Surveillance Dashboard Depicting Status Of The Risks Faced By Business Elements PDF
This slide provides an overview of the dashboard that showcase the business risks and their status. The dashboard includes risk map, level and types. The best PPT templates are a great way to save time, energy, and resources. Slidegeeks have 100 percent editable powerpoint slides making them incredibly versatile. With these quality presentation templates, you can create a captivating and memorable presentation by combining visually appealing slides and effectively communicating your message. Download Risk Control And Surveillance Dashboard Depicting Status Of The Risks Faced By Business Elements PDF from Slidegeeks and deliver a wonderful presentation.
-
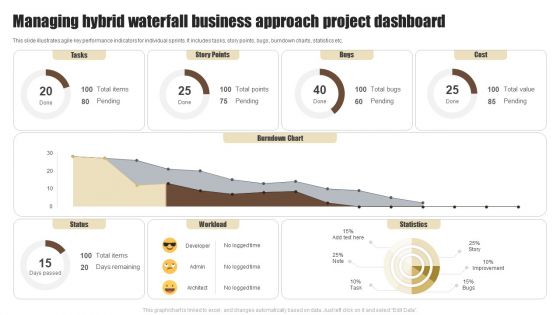
Managing Hybrid Waterfall Business Approach Project Dashboard Summary PDF
This slide illustrates agile key performance indicators for individual sprints. It includes tasks, story points, bugs, burndown charts, statistics etc. Showcasing this set of slides titled Managing Hybrid Waterfall Business Approach Project Dashboard Summary PDF. The topics addressed in these templates are Tasks, Story Points, Bugs. All the content presented in this PPT design is completely editable. Download it and make adjustments in color, background, font etc. as per your unique business setting.
-
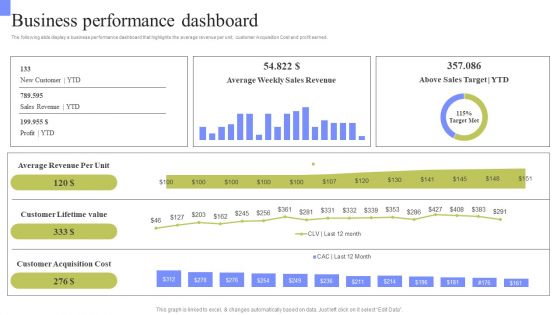
Periodic Revenue Model Business Performance Dashboard Rules PDF
The following slide display a business performance dashboard that highlights the average revenue per unit, customer Acquisition Cost and profit earned. This Periodic Revenue Model Business Performance Dashboard Rules PDF from Slidegeeks makes it easy to present information on your topic with precision. It provides customization options, so you can make changes to the colors, design, graphics, or any other component to create a unique layout. It is also available for immediate download, so you can begin using it right away. Slidegeeks has done good research to ensure that you have everything you need to make your presentation stand out. Make a name out there for a brilliant performance.
-
Hotel Administration Software Dashboard For Business Intelligence Infographics PDF
This slide covers HMS dashboard. The purpose of this dashboard is to get an overview of hotel key metrics and to check financial status against targets. It includes elements such as reservations, check in guests, reservation type and housekeeping. Pitch your topic with ease and precision using this Hotel Administration Software Dashboard For Business Intelligence Infographics PDF. This layout presents information on Guest, Housekeeping, Reservation Type. It is also available for immediate download and adjustment. So, changes can be made in the color, design, graphics or any other component to create a unique layout.
-
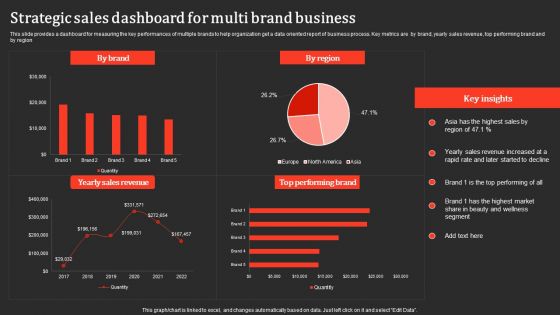
Strategic Sales Dashboard For Multi Brand Business Professional PDF
This slide provides a dashboard for measuring the key performances of multiple brands to help organization get a data oriented report of business process. Key metrics are by brand, yearly sales revenue, top performing brand and by region. Pitch your topic with ease and precision using this Strategic Sales Dashboard For Multi Brand Business Professional PDF. This layout presents information on Yearly Sales Revenue, Performing Brand. It is also available for immediate download and adjustment. So, changes can be made in the color, design, graphics or any other component to create a unique layout.
-
Business Continuous Process Improvement KPI Dashboard In Healthcare Industry Guidelines PDF
Following slides shows the complete outline of healthcare business process improvement KPI dashboard which will assist in providing better services to patients . The major metrics mentioned in a slide are such as average patients discharge by hour or on weekly basis Showcasing this set of slides titled Business Continuous Process Improvement KPI Dashboard In Healthcare Industry Guidelines PDF. The topics addressed in these templates are Patients, Discharge List, Healthcare Industry. All the content presented in this PPT design is completely editable. Download it and make adjustments in color, background, font etc. as per your unique business setting.
-
Catering Business Advertisement Plan KPI Dashboard With Revenue Comparison Icons PDF
This slide shows the KPI dashboard of the catering industry to evaluate the actual and potential targets. It includes KPIs such as expenditure, sales revenue, beverage, etc. Showcasing this set of slides titled Catering Business Advertisement Plan KPI Dashboard With Revenue Comparison Icons PDF. The topics addressed in these templates are Expenditure, Revenue Comparison, Department. All the content presented in this PPT design is completely editable. Download it and make adjustments in color, background, font etc. as per your unique business setting.
-
Dashboard Showcasing Business Revenue Target Vs Accomplishment Assessment Information PDF
This slide represents dashboard showcasing company revenue target vs achievement analysis which helps track business growth. It provides information regarding metrics such as monthly production targets, business revenue targets and generated, monthly budgeted cost and expenses per lead. Showcasing this set of slides titled Dashboard Showcasing Business Revenue Target Vs Accomplishment Assessment Information PDF. The topics addressed in these templates are Total Revenue, Target, Achievement. All the content presented in this PPT design is completely editable. Download it and make adjustments in color, background, font etc. as per your unique business setting.
-
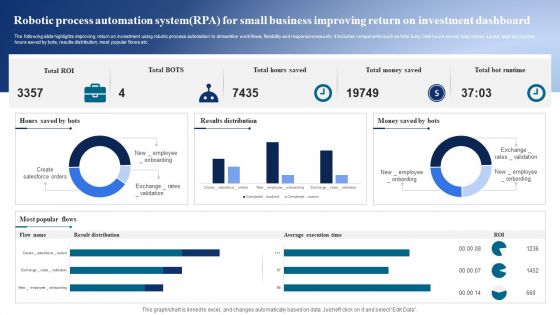
Robotic Process Automation Systemrpa For Small Business Improving Return On Investment Dashboard Ideas PDF
The following slide highlights improving return on investment using robotic process automation to streamline workflows, flexibility and responsiveness etc. It includes components such as total bots, total hours saved, total money saved, total bot runtime, hours saved by bots, results distribution, most popular flows etc. Showcasing this set of slides titled Robotic Process Automation Systemrpa For Small Business Improving Return On Investment Dashboard Ideas PDF. The topics addressed in these templates are Results Distribution, Popular Flows, Runtime. All the content presented in this PPT design is completely editable. Download it and make adjustments in color, background, font etc. as per your unique business setting.
-
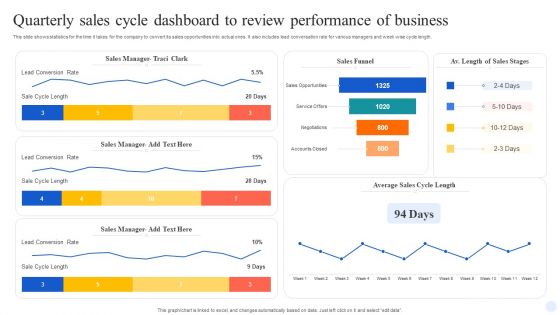
Quarterly Sales Cycle Dashboard To Review Performance Of Business Demonstration PDF
This slide shows statistics for the time it takes for the company to convert its sales opportunities into actual ones. It also includes lead conversation rate for various managers and week wise cycle length. Showcasing this set of slides titled Quarterly Sales Cycle Dashboard To Review Performance Of Business Demonstration PDF. The topics addressed in these templates are Sales Manager, Sales Funnel, Lead Conversion Rate. All the content presented in this PPT design is completely editable. Download it and make adjustments in color, background, font etc. as per your unique business setting.
-
Quarterly Sales Performance Of Business Dashboard With Region And Product Wise Comparison Guidelines PDF
This slide displays sales analysis for different products and regions in each quarter. t also includes inter year comparisons. Pitch your topic with ease and precision using this Quarterly Sales Performance Of Business Dashboard With Region And Product Wise Comparison Guidelines PDF. This layout presents information on Product Wise Quarterly Sales, Comparison. It is also available for immediate download and adjustment. So, changes can be made in the color, design, graphics or any other component to create a unique layout.
-
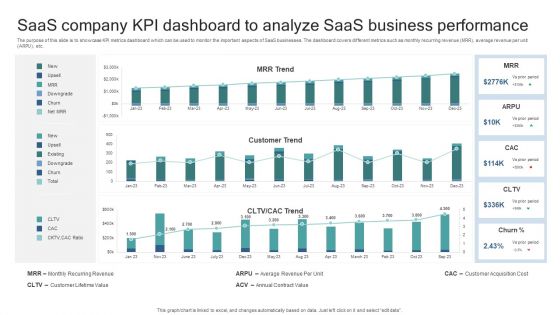
Saas Company KPI Dashboard To Analyze Saas Business Performance Elements PDF
The purpose of this slide is to showcase KPI metrics dashboard which can be used to monitor the important aspects of SaaS businesses. The dashboard covers different metrics such as monthly recurring revenue MRR, average revenue per unit ARPU, etc. Pitch your topic with ease and precision using this Saas Company KPI Dashboard To Analyze Saas Business Performance Elements PDF. This layout presents information on Monthly Recurring Revenue, Customer Lifetime Value, Average Revenue Per Unit, Annual Contract Value, Customer Acquisition Cost. It is also available for immediate download and adjustment. So, changes can be made in the color, design, graphics or any other component to create a unique layout.
-
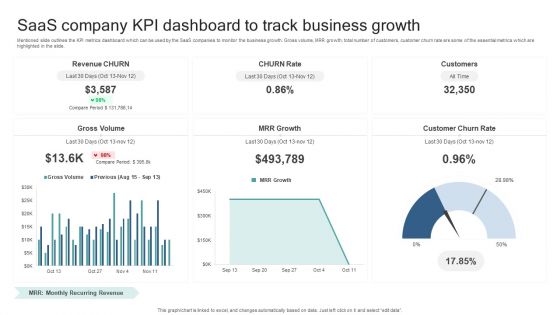
Saas Company KPI Dashboard To Track Business Growth Guidelines PDF
Mentioned slide outlines the KPI metrics dashboard which can be used by the SaaS companies to monitor the business growth. Gross volume, MRR growth, total number of customers, customer churn rate are some of the essential metrics which are highlighted in the slide. Showcasing this set of slides titled Saas Company KPI Dashboard To Track Business Growth Guidelines PDF. The topics addressed in these templates are Gross Volume, Mrr Growth, Customer Churn Rate. All the content presented in this PPT design is completely editable. Download it and make adjustments in color, background, font etc. as per your unique business setting.
-
Marketers Guide To Data Analysis Optimization Dashboard For Tracking Business Blog Kpis Infographics PDF
This slide covers the dashboard for analyzing blogging KPIs such as performance, published posts, views, new blog subscribers, top blog posts by pageviews, top blog posts by CTR, etc. Coming up with a presentation necessitates that the majority of the effort goes into the content and the message you intend to convey. The visuals of a PowerPoint presentation can only be effective if it supplements and supports the story that is being told. Keeping this in mind our experts created Marketers Guide To Data Analysis Optimization Dashboard For Tracking Business Blog Kpis Infographics PDF to reduce the time that goes into designing the presentation. This way, you can concentrate on the message while our designers take care of providing you with the right template for the situation.
-
Website Analytics Dashboard To Track Business Performance Guidelines PDF
This slide exhibits visual report to track web performance metrics such as bounce rates, conversion rate, etc. It focuses on visualizing how effectively any website is converting traffic. It involves information related to number of users, page visitors, etc. Pitch your topic with ease and precision using this Website Analytics Dashboard To Track Business Performance Guidelines PDF. This layout presents information on Website Analytics, Dashboard To Track, Business Performance. It is also available for immediate download and adjustment. So, changes can be made in the color, design, graphics or any other component to create a unique layout.
-
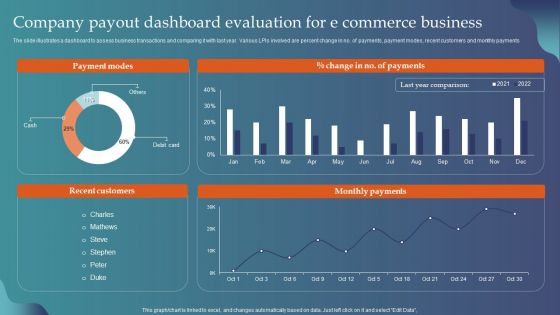
Company Payout Dashboard Evaluation For E Commerce Business Background PDF
The slide illustrates a dashboard to assess business transactions and comparing it with last year. Various LPIs involved are percent change in no. of payments, payment modes, recent customers and monthly payments. Showcasing this set of slides titled Company Payout Dashboard Evaluation For E Commerce Business Background PDF. The topics addressed in these templates are Payment Modes, Recent Customers, Monthly Payments. All the content presented in this PPT design is completely editable. Download it and make adjustments in color, background, font etc. as per your unique business setting.
-
Facts Assessment Business Intelligence KPI Dashboard Processing Ppt PowerPoint Presentation Summary Graphics Template PDF
Presenting this set of slides with name facts assessment business intelligence kpi dashboard processing ppt powerpoint presentation summary graphics template pdf. This is a one stage process. The stages in this process are brand awareness, web traffic, social media, grp, mind, processing. This is a completely editable PowerPoint presentation and is available for immediate download. Download now and impress your audience.
-
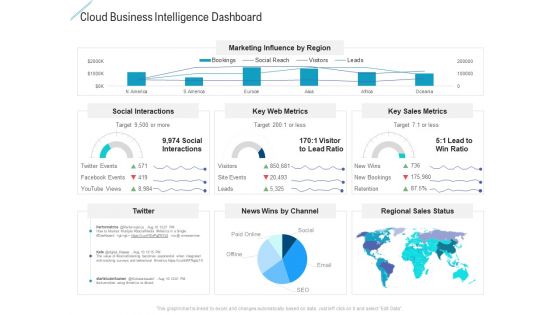
Cloud Business Intelligence Dashboard Graphics PDF
Deliver and pitch your topic in the best possible manner with this cloud business intelligence dashboard graphics pdf. Use them to share invaluable insights on social interactions, key web metrics, key sales metrics and impress your audience. This template can be altered and modified as per your expectations. So, grab it now.
-
Business Partner Lifecycle Management Dashboard Icon Rules PDF
Showcasing this set of slides titled Business Partner Lifecycle Management Dashboard Icon Rules PDF. The topics addressed in these templates are Management Dashboard Icon, Business Partner Lifecycle. All the content presented in this PPT design is completely editable. Download it and make adjustments in color, background, font etc. as per your unique business setting.
-
Business Plan Review Dashboard With Task Details Sample PDF
The following slide showcases dashboard of plan review to track KPIs and other relevant details regarding business, department and projects. Key indicators covered are contracts, proposals, documents review, bid date, plan review, completion percentage and priority. Pitch your topic with ease and precision using this Business Plan Review Dashboard With Task Details Sample PDF. This layout presents information on Business Plan Review, Dashboard With Task Details. It is also available for immediate download and adjustment. So, changes can be made in the color, design, graphics or any other component to create a unique layout.
-
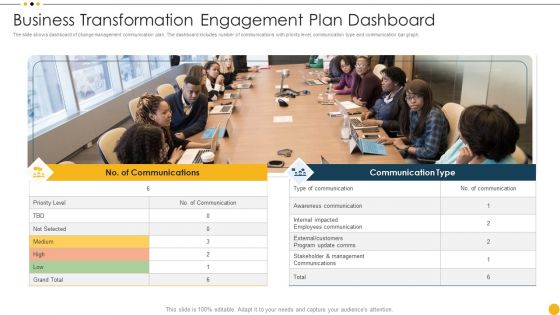
Business Transformation Engagement Plan Dashboard Ppt Outline Format PDF
The slide shows dashboard of change management communication plan. The dashboard includes number of communications with priority level, communication type and communication bar graph. Persuade your audience using this Business Transformation Engagement Plan Dashboard Ppt Outline Format PDF. This PPT design covers two stages, thus making it a great tool to use. It also caters to a variety of topics including Communications, Awareness Communication, Priority Level. Download this PPT design now to present a convincing pitch that not only emphasizes the topic but also showcases your presentation skills.
-
Business Program Kpis Dashboard Icon Ppt Portfolio Aids PDF
Presenting Business Program Kpis Dashboard Icon Ppt Portfolio Aids PDF to dispense important information. This template comprises three stages. It also presents valuable insights into the topics including Business Program, Kpis Dashboard, Icon. This is a completely customizable PowerPoint theme that can be put to use immediately. So, download it and address the topic impactfully.
-
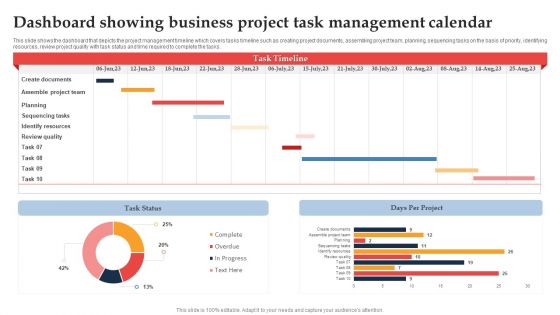
Dashboard Showing Business Project Task Management Calendar Ppt File Example File PDF
This slide shows the dashboard that depicts the project management timeline which covers tasks timeline such as creating project documents, assembling project team, planning, sequencing tasks on the basis of priority, identifying resources, review project quality with task status and time required to complete the tasks. Showcasing this set of slides titled Dashboard Showing Business Project Task Management Calendar Ppt File Example File PDF. The topics addressed in these templates are Days Per Project, Task Status, Create Documents. All the content presented in this PPT design is completely editable. Download it and make adjustments in color, background, font etc. as per your unique business setting.
-
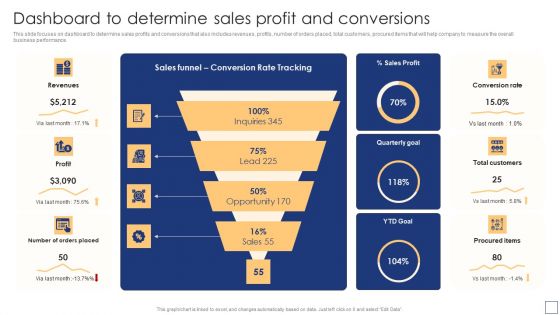
Business Process Redesigning Dashboard To Determine Sales Profit And Conversions Slides PDF
This slide focuses on dashboard to determine sales profits and conversions that also includes revenues, profits, number of orders placed, total customers, procured items that will help company to measure the overall business performance. There are so many reasons you need a Business Process Redesigning Dashboard To Determine Sales Profit And Conversions Slides PDF. The first reason is you cant spend time making everything from scratch, Thus, Slidegeeks has made presentation templates for you too. You can easily download these templates from our website easily.
-
Building An IT Strategy Plan For Business Expansion Dashboard To Track IT Security Incidents Prevailing Across Firm Infographics PDF
This slide portrays information regarding the dashboard that firm will track various incidents detected. These incidents will be managed in order to avoid security risks. There are so many reasons you need a Building An IT Strategy Plan For Business Expansion Dashboard To Track IT Security Incidents Prevailing Across Firm Infographics PDF. The first reason is you can not spend time making everything from scratch, Thus, Slidegeeks has made presentation templates for you too. You can easily download these templates from our website easily.
-
Deployment Of Business Process Dashboard To Determine Sales Profit And Conversions Demonstration PDF
This slide focuses on dashboard to determine sales profits and conversions that also includes revenues, profits, number of orders placed, total customers, procured items that will help company to measure the overall business performance. There are so many reasons you need a Deployment Of Business Process Dashboard To Determine Sales Profit And Conversions Demonstration PDF. The first reason is you cant spend time making everything from scratch, Thus, Slidegeeks has made presentation templates for you too. You can easily download these templates from our website easily.
-
Business Management Analytics Procedure Dashboard Icon Inspiration PDF
Presenting Business Management Analytics Procedure Dashboard Icon Inspiration PDF to dispense important information. This template comprises four stages. It also presents valuable insights into the topics including Business Management Analytics, Procedure Dashboard Icon. This is a completely customizable PowerPoint theme that can be put to use immediately. So, download it and address the topic impactfully.
-
Business Operations Metrics Dashboard Icon Graphics PDF
Showcasing this set of slides titled Business Operations Metrics Dashboard Icon Graphics PDF. The topics addressed in these templates are Business Operations, Metrics Dashboard Icon. All the content presented in this PPT design is completely editable. Download it and make adjustments in color, background, font etc. as per your unique business setting.
-
Business Activities Monitoring Dashboard Icon Diagrams PDF
Presenting Business Activities Monitoring Dashboard Icon Diagrams PDF to dispense important information. This template comprises Four stages. It also presents valuable insights into the topics including Business Activities, Monitoring Dashboard Icon. This is a completely customizable PowerPoint theme that can be put to use immediately. So, download it and address the topic impactfully.
-
Best Practices To Create SAP Cloud Based Business Intelligence Platform Dashboards Summary PDF
This slide includes tips to enhance the overall user experience while making SAP analytics cloud dashboards. It includes tips such as utilize semantic and industry-specific colours, keep visualization clear, group related data, etc. Presenting Best Practices To Create SAP Cloud Based Business Intelligence Platform Dashboards Summary PDF to dispense important information. This template comprises four stages. It also presents valuable insights into the topics including Utilize Semantic Industry Specific, Keep Visualizations Clear, Group Related Data. This is a completely customizable PowerPoint theme that can be put to use immediately. So, download it and address the topic impactfully.
-
Smart Business Evaluation Icon With Dashboard Sample PDF
Presenting Smart Business Evaluation Icon With Dashboard Sample PDF to dispense important information. This template comprises three stages. It also presents valuable insights into the topics including Smart Business Evaluation Icon, Dashboard. This is a completely customizable PowerPoint theme that can be put to use immediately. So, download it and address the topic impactfully.
-
Business Intelligence Dashboard Icon For Data Analysis And Visualization Information PDF
Persuade your audience using this Business Intelligence Dashboard Icon For Data Analysis And Visualization Information PDF. This PPT design covers three stages, thus making it a great tool to use. It also caters to a variety of topics including Business Intelligence Dashboard Icon, Data Analysis And Visualization. Download this PPT design now to present a convincing pitch that not only emphasizes the topic but also showcases your presentation skills.
-
Business Intelligence Dashboard Icon To Analyze Industry Trends Topics PDF
Persuade your audience using this Business Intelligence Dashboard Icon To Analyze Industry Trends Topics PDF. This PPT design covers three stages, thus making it a great tool to use. It also caters to a variety of topics including Business Intelligence Dashboard Icon, Analyze Industry Trends. Download this PPT design now to present a convincing pitch that not only emphasizes the topic but also showcases your presentation skills.
-
Business Intelligence Dashboard Icon To Track Kpis Pictures PDF
Persuade your audience using this Business Intelligence Dashboard Icon To Track Kpis Pictures PDF. This PPT design covers three stages, thus making it a great tool to use. It also caters to a variety of topics including Business Intelligence, Dashboard Icon, Track Kpis. Download this PPT design now to present a convincing pitch that not only emphasizes the topic but also showcases your presentation skills.
-
Business Executive Report Report Dashboard Icon Sample PDF
Presenting Business Executive Report Report Dashboard Icon Sample PDF to dispense important information. This template comprises three stages. It also presents valuable insights into the topics including Business Executive, Report Report, Dashboard. This is a completely customizable PowerPoint theme that can be put to use immediately. So, download it and address the topic impactfully.
-
Business Dashboard Icon With Decline Formats PDF
Presenting Business Dashboard Icon With Decline Formats PDF to dispense important information. This template comprises three stages. It also presents valuable insights into the topics including Business Dashboard Icon, Decline. This is a completely customizable PowerPoint theme that can be put to use immediately. So, download it and address the topic impactfully.
-
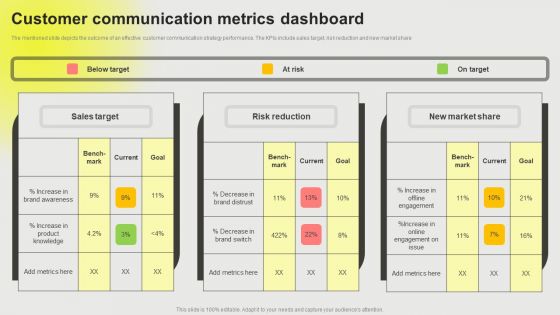
Developing A Successful Business Communication Plan Customer Communication Metrics Dashboard Download PDF
The mentioned slide depicts the outcome of an effective customer communication strategy performance. The KPIs include sales target, risk reduction and new market share Whether you have daily or monthly meetings, a brilliant presentation is necessary. Developing A Successful Business Communication Plan Customer Communication Metrics Dashboard Download PDF can be your best option for delivering a presentation. Represent everything in detail using Developing A Successful Business Communication Plan Customer Communication Metrics Dashboard Download PDF and make yourself stand out in meetings. The template is versatile and follows a structure that will cater to your requirements. All the templates prepared by Slidegeeks are easy to download and edit. Our research experts have taken care of the corporate themes as well. So, give it a try and see the results.
-
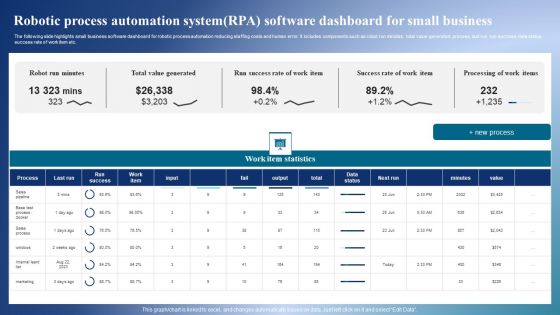
Robotic Process Automation Systemrpa Software Dashboard For Small Business Sample PDF
The following slide highlights small business software dashboard for robotic process automation reducing staffing costs and human error. It includes components such as robot run minutes, total value generated, process, last run, run success, data status, success rate of work item etc. Pitch your topic with ease and precision using this Robotic Process Automation Systemrpa Software Dashboard For Small Business Sample PDF. This layout presents information on Work Item Statistics, Business, Total Value Generated. It is also available for immediate download and adjustment. So, changes can be made in the color, design, graphics or any other component to create a unique layout.
-
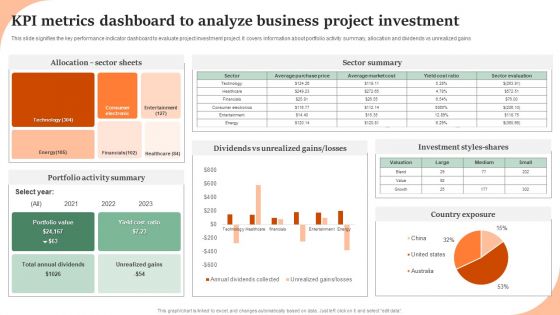
KPI Metrics Dashboard To Analyze Business Project Investment Graphics PDF
This slide signifies the key performance indicator dashboard to evaluate project investment project. It covers information about portfolio activity summary, allocation and dividends vs unrealized gains. Showcasing this set of slides titled KPI Metrics Dashboard To Analyze Business Project Investment Graphics PDF. The topics addressed in these templates are Allocation Sector Sheets, Sector Summary, Investment Styles Shares. All the content presented in this PPT design is completely editable. Download it and make adjustments in color, background, font etc. as per your unique business setting.
-
KPI Dashboard To Measure User On Boarding In Ecommerce Business Microsoft PDF
This slide signifies the key performance indicator dashboard to track customer onboarding in online business. It covers information about customer satisfaction rate, net promoter score and CSAT score. Showcasing this set of slides titled KPI Dashboard To Measure User On Boarding In Ecommerce Business Microsoft PDF. The topics addressed in these templates are User Boarding Icon, Develop Ecommerce Business. All the content presented in this PPT design is completely editable. Download it and make adjustments in color, background, font etc. as per your unique business setting.
-
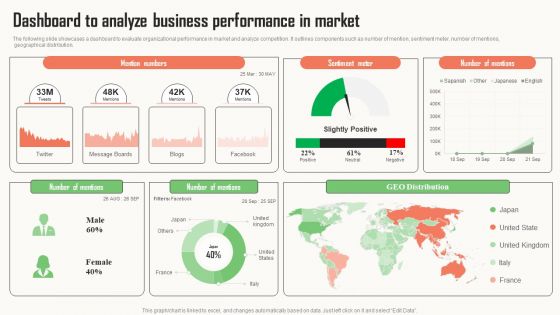
Strategic Market Insight Implementation Guide Dashboard To Analyze Business Performance In Market Slides PDF
The following slide showcases a dashboard to evaluate organizational performance in market and analyze competition. It outlines components such as number of mention, sentiment meter, number of mentions, geographical distribution. Get a simple yet stunning designed Strategic Market Insight Implementation Guide Dashboard To Analyze Business Performance In Market Slides PDF. It is the best one to establish the tone in your meetings. It is an excellent way to make your presentations highly effective. So, download this PPT today from Slidegeeks and see the positive impacts. Our easy to edit Strategic Market Insight Implementation Guide Dashboard To Analyze Business Performance In Market Slides PDF can be your go to option for all upcoming conferences and meetings. So, what are you waiting for Grab this template today.
-
Business Sales Optimization Advertisement Campaign Digital Marketing Performance Evaluation Dashboard Background PDF
This slide showcases the dashboard that helps to track and measure digital marketing campaign performance. It includes cost, clicks, impressions, STR, conversion rate, etc. Crafting an eye catching presentation has never been more straightforward. Let your presentation shine with this tasteful yet straightforward Business Sales Optimization Advertisement Campaign Digital Marketing Performance Evaluation Dashboard Background PDF template. It offers a minimalistic and classy look that is great for making a statement. The colors have been employed intelligently to add a bit of playfulness while still remaining professional. Construct the ideal Business Sales Optimization Advertisement Campaign Digital Marketing Performance Evaluation Dashboard Background PDF that effortlessly grabs the attention of your audience. Begin now and be certain to wow your customers.
-
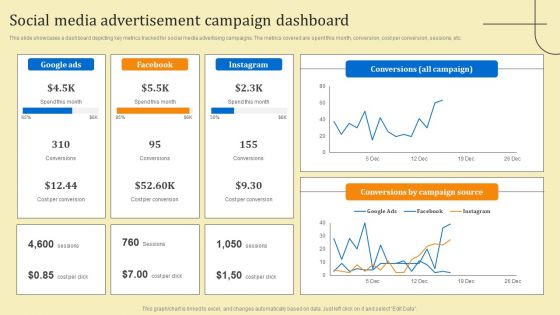
Business Sales Optimization Advertisement Campaign Social Media Advertisement Campaign Dashboard Graphics PDF
This slide showcases a dashboard depicting key metrics tracked for social media advertising campaigns. The metrics covered are spent this month, conversion, cost per conversion, sessions, etc. This modern and well arranged Business Sales Optimization Advertisement Campaign Social Media Advertisement Campaign Dashboard Graphics PDF provides lots of creative possibilities. It is very simple to customize and edit with the Powerpoint Software. Just drag and drop your pictures into the shapes. All facets of this template can be edited with Powerpoint no extra software is necessary. Add your own material, put your images in the places assigned for them, adjust the colors, and then you can show your slides to the world, with an animated slide included.
-
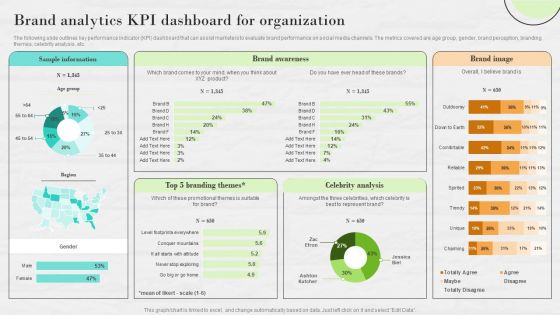
Market Research To Determine Business Opportunities Brand Analytics KPI Dashboard For Organization Inspiration PDF
The following slide outlines key performance indicator KPI dashboard that can assist marketers to evaluate brand performance on social media channels. The metrics covered are age group, gender, brand perception, branding themes, celebrity analysis, etc. There are so many reasons you need a Market Research To Determine Business Opportunities Brand Analytics KPI Dashboard For Organization Inspiration PDF. The first reason is you cannot spend time making everything from scratch, Thus, Slidegeeks has made presentation templates for you too. You can easily download these templates from our website easily.
-
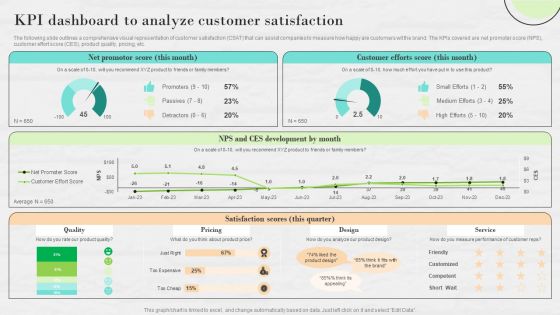
Market Research To Determine Business Opportunities KPI Dashboard To Analyze Customer Satisfaction Graphics PDF
The following slide outlines a comprehensive visual representation of customer satisfaction CSAT that can assist companies to measure how happy are customers wit the brand. The KPIs covered are net promoter score NPS, customer effort score CES, product quality, pricing, etc.Are you in need of a template that can accommodate all of your creative concepts This one is crafted professionally and can be altered to fit any style. Use it with Google Slides or PowerPoint. Include striking photographs, symbols, depictions, and other visuals. Fill, move around, or remove text boxes as desired. Test out color palettes and font mixtures. Edit and save your work, or work with colleagues. Download Market Research To Determine Business Opportunities KPI Dashboard To Analyze Customer Satisfaction Graphics PDF and observe how to make your presentation outstanding. Give an impeccable presentation to your group and make your presentation unforgettable.
-
Overview Of BI For Enhanced Decision Making Business Intelligence Key Metrics Dashboard Icons PDF
This slide covers the key performance tracking dashboard of an organization prepared with the help of BI software. It includes key metrics such as data exchange trend, department distribution, data sampling etc. Slidegeeks is one of the best resources for PowerPoint templates. You can download easily and regulate Overview Of BI For Enhanced Decision Making Business Intelligence Key Metrics Dashboard Icons PDF for your personal presentations from our wonderful collection. A few clicks is all it takes to discover and get the most relevant and appropriate templates. Use our Templates to add a unique zing and appeal to your presentation and meetings. All the slides are easy to edit and you can use them even for advertisement purposes.
-
Promotional Campaign Performance Tracking Dashboard For Business Growth Information PDF
This slide represents dashboard showcasing advertising campaign performance progress which helps to manage marketing activities effectively. It provides information regarding total marketing cost, website impressions, content clicks, customer acquisition, cost per campaign etc. Showcasing this set of slides titled Promotional Campaign Performance Tracking Dashboard For Business Growth Information PDF. The topics addressed in these templates are Website Impression, Content Clicks, Customer Acquisition . All the content presented in this PPT design is completely editable. Download it and make adjustments in color, background, font etc. as per your unique business setting.
-
Business Sales Procedures Improvement Dashboard Designs PDF
Following slide shows the dashboard for reengineering business sales processes which assist in accelerated processing times, lower costs, better customer service, and stronger employee retention. The KPI are proposals ,opportunities, etc. Pitch your topic with ease and precision using this Business Sales Procedures Improvement Dashboard Designs PDF. This layout presents information on Deals Opportunities Ratios, Opportunity, Deals Conversion Ratio. It is also available for immediate download and adjustment. So, changes can be made in the color, design, graphics or any other component to create a unique layout.


