Businesses dashboards PowerPoint Presentation Templates and Google Slides
-
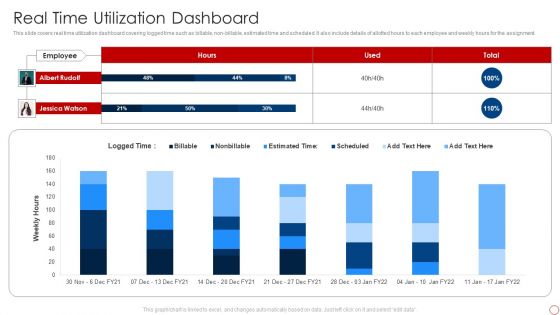
Kpis For Evaluating Business Sustainability Real Time Utilization Dashboard Portrait PDF
This slide covers real time utilization dashboard covering logged time such as billable, non-billable, estimated time and scheduled. It also include details of allotted hours to each employee and weekly hours for the assignment. Deliver an awe inspiring pitch with this creative Kpis For Evaluating Business Sustainability Real Time Utilization Dashboard Portrait PDF bundle. Topics like Logged Time, Employee, Albert Rudolf can be discussed with this completely editable template. It is available for immediate download depending on the needs and requirements of the user.
-
Business Process Management Dashboard Showing Pending Processes Graphics PDF
This slide shows the dashboard of business management by calculating the number of processes that are running as well as the ones that are completed. It also shows the unsettled or remaining process with average process duration. Showcasing this set of slides titled Business Process Management Dashboard Showing Pending Processes Graphics PDF. The topics addressed in these templates are Average Process, Time Span, Number Operations. All the content presented in this PPT design is completely editable. Download it and make adjustments in color, background, font etc. as per your unique business setting.
-
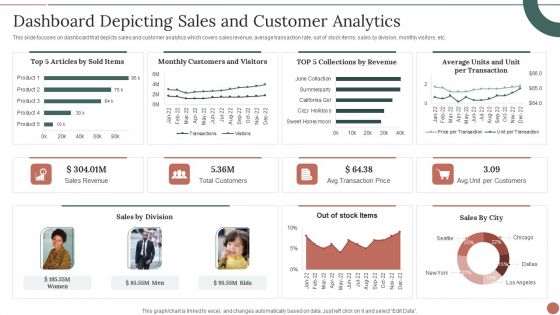
Retail Business Product Planning Procedure Dashboard Depicting Sales And Customer Analytics Themes PDF
This slide focuses on dashboard that depicts sales and customer analytics which covers sales revenue, average transaction rate, out of stock items, sales by division, monthly visitors, etc. Deliver and pitch your topic in the best possible manner with this Retail Business Product Planning Procedure Dashboard Depicting Sales And Customer Analytics Themes PDF. Use them to share invaluable insights on Sales Revenue, Total Customers, Sales By Division and impress your audience. This template can be altered and modified as per your expectations. So, grab it now.
-
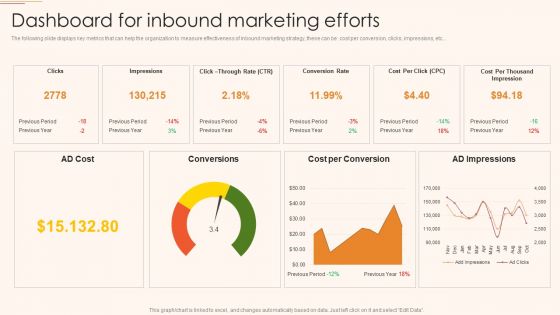
B2C And B2B Business Promotion Strategy Dashboard For Inbound Marketing Efforts Diagrams PDF
The following slide displays key metrics that can help the organization to measure effectiveness of inbound marketing strategy, these can be cost per conversion, clicks, impressions, etc. Deliver an awe inspiring pitch with this creative B2C And B2B Business Promotion Strategy Dashboard For Inbound Marketing Efforts Diagrams PDF bundle. Topics like Conversion Rate, Cost per Conversion, AD Impressions can be discussed with this completely editable template. It is available for immediate download depending on the needs and requirements of the user.
-
Online Business Client Experience Improvement Strategy Playbook Ecommerce Website Performance Tracking Dashboard Slides PDF
This slide provides information regarding ecommerce website performance tracking dashboard addressing page views, website conversions, etc. Deliver and pitch your topic in the best possible manner with this Online Business Client Experience Improvement Strategy Playbook Ecommerce Website Performance Tracking Dashboard Slides PDF. Use them to share invaluable insights on Organic Search, Bounce Rate, Customer Conversions Rate and impress your audience. This template can be altered and modified as per your expectations. So, grab it now.
-
Business Clients Composition Dashboard For Capital Fund Raising Ppt Infographic Template Microsoft PDF
This slide illustrates facts related to composition to corporate clients for capital raising. It includes revenue contribution by clients, total contract value, new and active clients and client metrics etc. Showcasing this set of slides titled Business Clients Composition Dashboard For Capital Fund Raising Ppt Infographic Template Microsoft PDF. The topics addressed in these templates are Revenue Contribution Clients, Client Metrics, Total Contract Value. All the content presented in this PPT design is completely editable. Download it and make adjustments in color, background, font etc. as per your unique business setting.
-
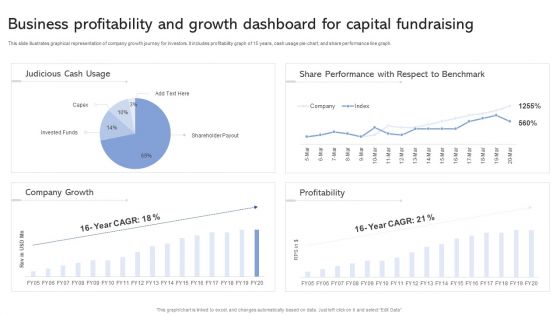
Business Profitability And Growth Dashboard For Capital Fundraising Ppt Slides Guide PDF
This slide illustrates graphical representation of company growth journey for investors. It includes profitability graph of 15 years, cash usage pie-chart, and share performance line graph. Showcasing this set of slides titled Business Profitability And Growth Dashboard For Capital Fundraising Ppt Slides Guide PDF. The topics addressed in these templates are Judicious Cash Usage, Share Performance, Respect To Benchmark. All the content presented in this PPT design is completely editable. Download it and make adjustments in color, background, font etc. as per your unique business setting.
-
Digital Media Tracking Dashboard Deploying Artificial Intelligence In Business Portrait PDF
This slide covers the digital marketing dashboard along with the lead breakdown, google analytics traffic, and social media channels.Deliver and pitch your topic in the best possible manner with this Digital Media Tracking Dashboard Deploying Artificial Intelligence In Business Portrait PDF. Use them to share invaluable insights on Digital Media, Tracking Dashboard and impress your audience. This template can be altered and modified as per your expectations. So, grab it now.
-
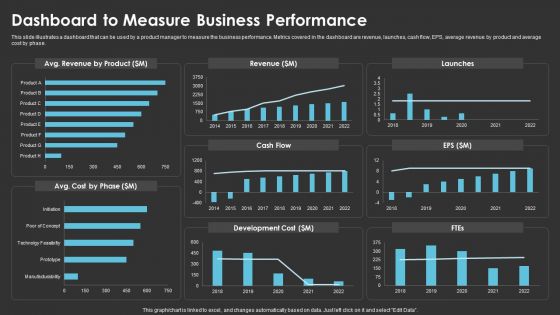
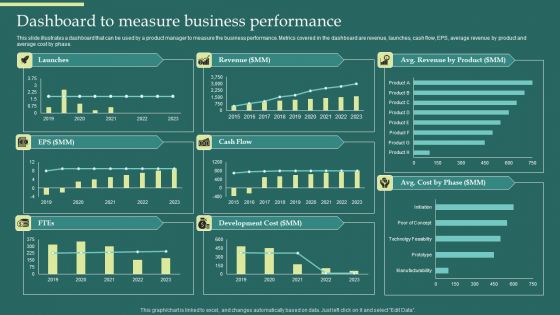
Method To Introduce New Product Offerings In The Industry Dashboard To Measure Business Performance Pictures PDF
This slide illustrates a dashboard that can be used by a product manager to measure the business performance. Metrics covered in the dashboard are revenue, launches, cash flow, EPS, average revenue by product and average cost by phase. Deliver and pitch your topic in the best possible manner with this Method To Introduce New Product Offerings In The Industry Dashboard To Measure Business Performance Pictures PDF. Use them to share invaluable insights on Revenue, Cash Flow, Development Cost and impress your audience. This template can be altered and modified as per your expectations. So, grab it now.
-
Developing Significant Business Staff Training Effectiveness Tracking Dashboard Elements PDF
This slide provides information regarding workforce training effectiveness monitoring dashboard. The dashboard includes details such as training cost, cost per participant, number of participants, hours of training, etc. Deliver an awe inspiring pitch with this creative Developing Significant Business Staff Training Effectiveness Tracking Dashboard Elements PDF bundle. Topics like Training Cost, Cost Per Participant, Cost Per Hour can be discussed with this completely editable template. It is available for immediate download depending on the needs and requirements of the user.
-
ISO 9001 Standard For Quality Control Business Quality Management And Audit Schedule Dashboard Icons PDF
This template covers quality management system dashboard including kpis such as outstanding actions, scheduled audits, item to attend to, and immediate actions required Deliver an awe inspiring pitch with this creative ISO 9001 Standard For Quality Control Business Quality Management And Audit Schedule Dashboard Icons PDF bundle. Topics like Customer Satisfaction, Management Review Meeting Due, Business Continuity can be discussed with this completely editable template. It is available for immediate download depending on the needs and requirements of the user.
-
KPI Dashboard To Measure Tactical Business Planning Progress In Project Management Ppt PowerPoint Presentation File Example File PDF
This slide shows the strategic project plan dashboard. It includes KPIs such as project tasks status, task owner etc. Showcasing this set of slides titled KPI Dashboard To Measure Tactical Business Planning Progress In Project Management Ppt PowerPoint Presentation File Example File PDF. The topics addressed in these templates are Discontinued, Some Disruption, Completed. All the content presented in this PPT design is completely editable. Download it and make adjustments in color, background, font etc. as per your unique business setting.
-
Dashboard To Business Success Measurement Of Customer Service Initiatives Microsoft PDF
This slide showcases customer service initiatives success measurement dashboard. It provides information about net promoter score NPS, customer satisfaction CSAT, first response time, close time, etc. Showcasing this set of slides titled Dashboard To Business Success Measurement Of Customer Service Initiatives Microsoft PDF. The topics addressed in these templates are Initial Response Time, Close Time, First Response Time. All the content presented in this PPT design is completely editable. Download it and make adjustments in color, background, font etc. as per your unique business setting.
-
Dashboard To Business Success Measurement Of Email Marketing Campaign Professional PDF
This slide showcases dashboard to track effectiveness of email marketing campaign. It provides information about sent, direct, organic, paid, referral, analytics, sessions, etc. Pitch your topic with ease and precision using this Dashboard To Business Success Measurement Of Email Marketing Campaign Professional PDF. This layout presents information on Email Marketing, Analytics, Sessions. It is also available for immediate download and adjustment. So, changes can be made in the color, design, graphics or any other component to create a unique layout.
-
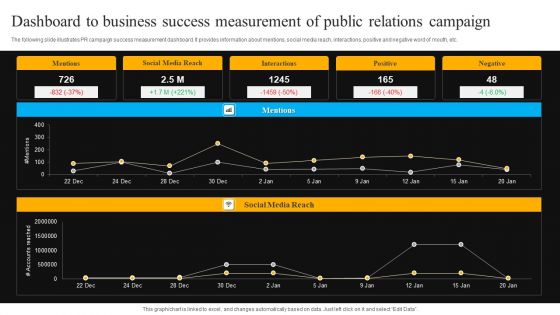
Dashboard To Business Success Measurement Of Public Relations Campaign Download PDF
The following slide illustrates PR campaign success measurement dashboard. It provides information about mentions, social media reach, interactions, positive and negative word of mouth, etc. Showcasing this set of slides titled Dashboard To Business Success Measurement Of Public Relations Campaign Download PDF. The topics addressed in these templates are Mentions, Social Media Reach, Interactions, Positive. All the content presented in this PPT design is completely editable. Download it and make adjustments in color, background, font etc. as per your unique business setting.
-
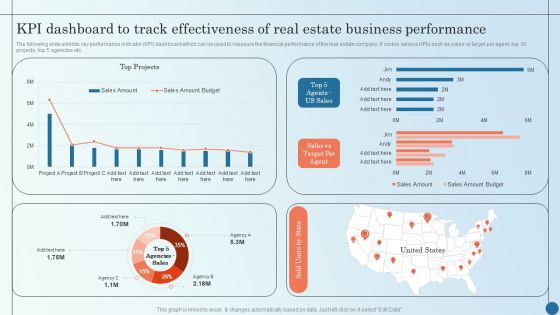
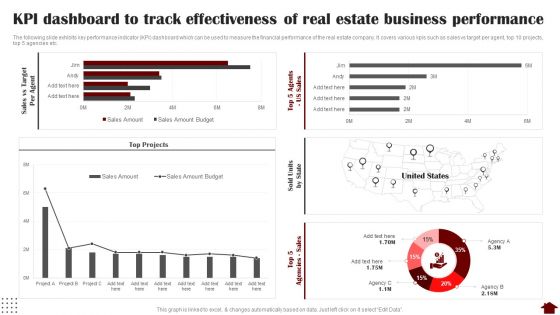
KPI Dashboard To Track Effectiveness Of Real Estate Business Managing Commercial Property Risks Demonstration PDF
The following slide exhibits key performance indicator KPI dashboard which can be used to measure the financial performance of the real estate company. It covers various KPIs such as sales vs target per agent, top 10 projects, top 5 agencies etc.Deliver an awe inspiring pitch with this creative KPI Dashboard To Track Effectiveness Of Real Estate Business Managing Commercial Property Risks Demonstration PDF bundle. Topics like Kpi Dashboard, Track Effectiveness, Estate Business can be discussed with this completely editable template. It is available for immediate download depending on the needs and requirements of the user.
-
Business Threats Landscape Dashboard For Cyber Security Program Management Ppt Gallery Images PDF
This slide shows risk landscape dashboard for cyber security program management which contains threat level by month, current threat posture, threats by source, threats by owner, risks by threat and threat register. This can help businesses in effective management of risks and counter measures. Showcasing this set of slides titled Business Threats Landscape Dashboard For Cyber Security Program Management Ppt Gallery Images PDF. The topics addressed in these templates are Current Threat Posture, Threat Register, Source. All the content presented in this PPT design is completely editable. Download it and make adjustments in color, background, font etc. as per your unique business setting.
-
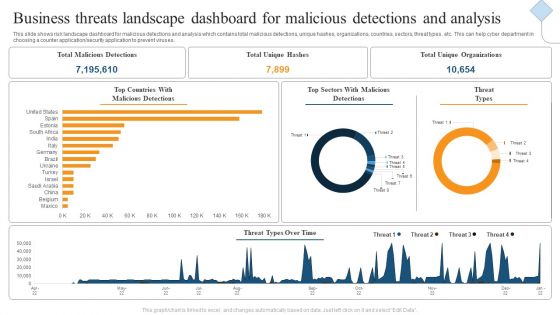
Business Threats Landscape Dashboard For Malicious Detections And Analysis Ppt Gallery Show PDF
This slide shows risk landscape dashboard for malicious detections and analysis which contains total malicious detections, unique hashes, organizations, countries, sectors, threat types, etc. This can help cyber department in choosing a counter application or security application to prevent viruses. Showcasing this set of slides titled Business Threats Landscape Dashboard For Malicious Detections And Analysis Ppt Gallery Show PDF. The topics addressed in these templates are Total Malicious Detections, Total Unique Hashes, Total Unique Organizations. All the content presented in this PPT design is completely editable. Download it and make adjustments in color, background, font etc. as per your unique business setting.
-
Business Threats Landscape Dashboard With Cyber Attacks Analysis Ppt Summary Brochure PDF
This slide illustrates risk landscape dashboard with cyber attacks analysis which contains malware attack frequency, country wise attacks, top 10 attacks, etc. It can assist IT managers in analyzing top threats so that they can be dealt with proper efficiency. Pitch your topic with ease and precision using this Business Threats Landscape Dashboard With Cyber Attacks Analysis Ppt Summary Brochure PDF. This layout presents information on Malware Attack Frequency, Every Minute, Every Second. It is also available for immediate download and adjustment. So, changes can be made in the color, design, graphics or any other component to create a unique layout.
-
Business Analytics Application HR Talent Management Key Metrics Dashboard Rules PDF
This slide represents the KPI dashboard to track and monitor management of talent by the HR department. It includes details related to talent satisfaction, talent turnover rate, fired talents etc. This Business Analytics Application HR Talent Management Key Metrics Dashboard Rules PDF is perfect for any presentation, be it in front of clients or colleagues. It is a versatile and stylish solution for organizing your meetings. The Business Analytics Application HR Talent Management Key Metrics Dashboard Rules PDF features a modern design for your presentation meetings. The adjustable and customizable slides provide unlimited possibilities for acing up your presentation. Slidegeeks has done all the homework before launching the product for you. So, dont wait, grab the presentation templates today.
-
Business Analytics Application Workforce Performance Analysis KPI Dashboard Template PDF
This slide represents the dashboard representing key metrics to analyze the performance of overall workforce. It includes details related to absence rate, benefits satisfaction, engagement index etc. Take your projects to the next level with our ultimate collection of Business Analytics Application Workforce Performance Analysis KPI Dashboard Template PDF. Slidegeeks has designed a range of layouts that are perfect for representing task or activity duration, keeping track of all your deadlines at a glance. Tailor these designs to your exact needs and give them a truly corporate look with your own brand colors theyll make your projects stand out from the rest.
-
Dashboard To Measure Business Performance Creating And Offering Multiple Product Ranges In New Business Introduction PDF
This slide illustrates a dashboard that can be used by a product manager to measure the business performance. Metrics covered in the dashboard are revenue, launches, cash flow, EPS, average revenue by product and average cost by phase.There are so many reasons you need a Dashboard To Measure Business Performance Creating And Offering Multiple Product Ranges In New Business Introduction PDF. The first reason is you can notspend time making everything from scratch, Thus, Slidegeeks has made presentation templates for you too. You can easily download these templates from our website easily.
-
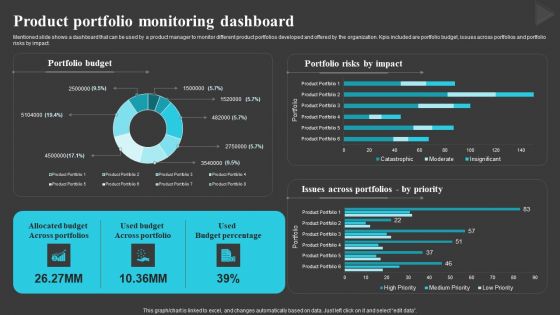
Product Portfolio Monitoring Dashboard Creating And Offering Multiple Product Ranges In New Business Diagrams PDF
Mentioned slide shows a dashboard that can be used by a product manager to monitor different product portfolios developed and offered by the organization. Kpis included are portfolio budget, issues across portfolios and portfolio risks by impact.Crafting an eye-catching presentation has never been more straightforward. Let your presentation shine with this tasteful yet straightforward Product Portfolio Monitoring Dashboard Creating And Offering Multiple Product Ranges In New Business Diagrams PDF template. It offers a minimalistic and classy look that is great for making a statement. The colors have been employed intelligently to add a bit of playfulness while still remaining professional. Construct the ideal Product Portfolio Monitoring Dashboard Creating And Offering Multiple Product Ranges In New Business Diagrams PDF that effortlessly grabs the attention of your audience Begin now and be certain to wow your customers.
-
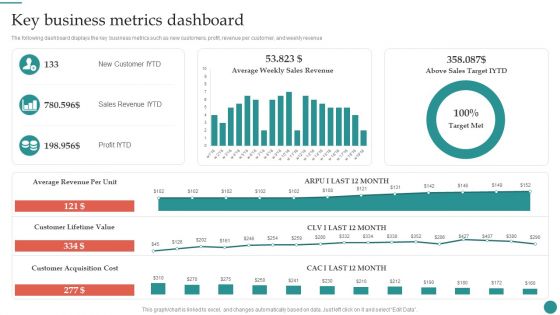
Key Business Metrics Dashboard Company Process Administration And Optimization Playbook Infographics PDF
The following dashboard displays the key business metrics such as new customers, profit, revenue per customer, and weekly revenue. Slidegeeks is here to make your presentations a breeze with Key Business Metrics Dashboard Company Process Administration And Optimization Playbook Infographics PDF With our easy-to-use and customizable templates, you can focus on delivering your ideas rather than worrying about formatting. With a variety of designs to choose from, you are sure to find one that suits your needs. And with animations and unique photos, illustrations, and fonts, you can make your presentation pop. So whether you are giving a sales pitch or presenting to the board, make sure to check out Slidegeeks first.
-
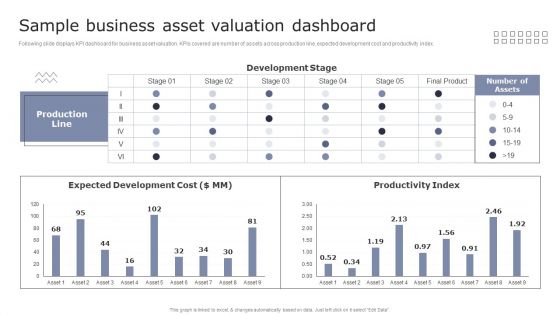
Sample Business Asset Valuation Dashboard Guide To Asset Cost Estimation Professional PDF
Following slide displays KPI dashboard for business asset valuation. KPIs covered are number of assets across production line, expected development cost and productivity index.Are you in need of a template that can accommodate all of your creative concepts This one is crafted professionally and can be altered to fit any style. Use it with Google Slides or PowerPoint. Include striking photographs, symbols, depictions, and other visuals. Fill, move around, or remove text boxes as desired. Test out color palettes and font mixtures. Edit and save your work, or work with colleagues. Download Sample Business Asset Valuation Dashboard Guide To Asset Cost Estimation Professional PDF and observe how to make your presentation outstanding. Give an impeccable presentation to your group and make your presentation unforgettable.
-
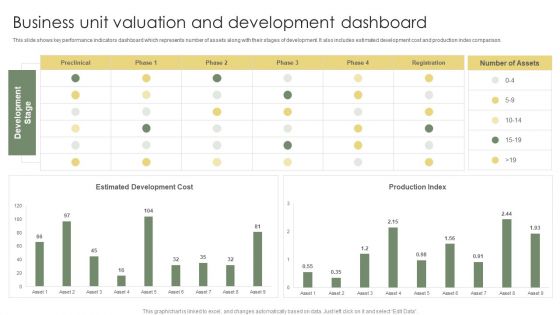
Business Unit Valuation And Development Dashboard Ppt Professional Graphic Tips PDF
This slide shows key performance indicators dashboard which represents number of assets along with their stages of development. It also includes estimated development cost and production index comparison. Pitch your topic with ease and precision using this Business Unit Valuation And Development Dashboard Ppt Professional Graphic Tips PDF. This layout presents information on Estimated Development Cost, Production Index, Development Stage. It is also available for immediate download and adjustment. So, changes can be made in the color, design, graphics or any other component to create a unique layout.
-
SQL Server Data Profiling Solutions Dashboard Indicating Business Intelligence Analytics Structure PDF
This slide showcase structured query language SQL server data profiling dashboard indicating business intelligence analytics which can be referred by IT managers to manage and allocate data sets. It includes information about tables, columns, elements, etc. Showcasing this set of slides titled SQL Server Data Profiling Solutions Dashboard Indicating Business Intelligence Analytics Structure PDF. The topics addressed in these templates are Number Columns, Slightly Change Figures, SQL Server. All the content presented in this PPT design is completely editable. Download it and make adjustments in color, background, font etc. as per your unique business setting.
-
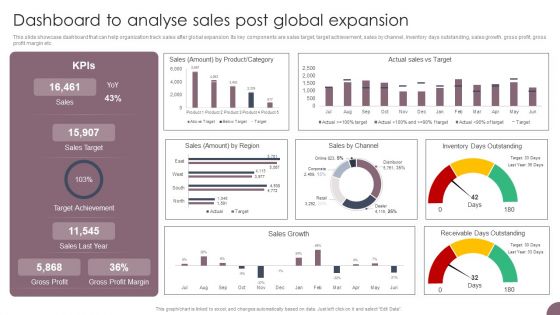
International Business Extension Dashboard To Analyse Sales Post Global Expansion Guidelines PDF
This slide showcase dashboard that can help organization track sales after global expansion. Its key components are sales target, target achievement, sales by channel, inventory days outstanding, sales growth, gross profit, gross profit margin etc. Are you in need of a template that can accommodate all of your creative concepts This one is crafted professionally and can be altered to fit any style. Use it with Google Slides or PowerPoint. Include striking photographs, symbols, depictions, and other visuals. Fill, move around, or remove text boxes as desired. Test out color palettes and font mixtures. Edit and save your work, or work with colleagues. Download International Business Extension Dashboard To Analyse Sales Post Global Expansion Guidelines PDF and observe how to make your presentation outstanding. Give an impeccable presentation to your group and make your presentation unforgettable.
-
International Business Extension Dashboard To Track Revenue After Global Expansion Introduction PDF
This slide showcase dashboard that can help organization track revenue after global expansion. Its key components are average revenue per customer, customer acquisition cost, customer lifetime value and new customers acquired. Crafting an eye-catching presentation has never been more straightforward. Let your presentation shine with this tasteful yet straightforward International Business Extension Dashboard To Track Revenue After Global Expansion Introduction PDF template. It offers a minimalistic and classy look that is great for making a statement. The colors have been employed intelligently to add a bit of playfulness while still remaining professional. Construct the ideal International Business Extension Dashboard To Track Revenue After Global Expansion Introduction PDF that effortlessly grabs the attention of your audience Begin now and be certain to wow your customers.
-
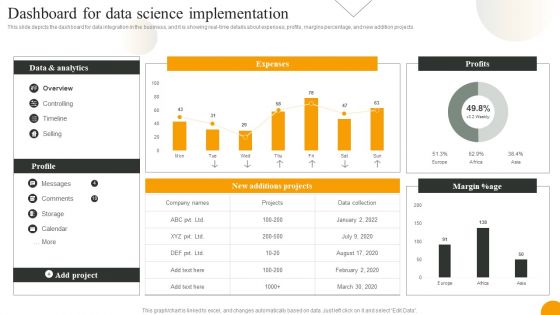
Using Data Science Technologies For Business Transformation Dashboard For Data Science Implementation Portrait PDF
This slide depicts the dashboard for data integration in the business, and it is showing real-time details about expenses, profits, margins percentage, and new addition projects. Take your projects to the next level with our ultimate collection of Using Data Science Technologies For Business Transformation Dashboard For Data Science Implementation Portrait PDF. Slidegeeks has designed a range of layouts that are perfect for representing task or activity duration, keeping track of all your deadlines at a glance. Tailor these designs to your exact needs and give them a truly corporate look with your own brand colors they will make your projects stand out from the rest.
-
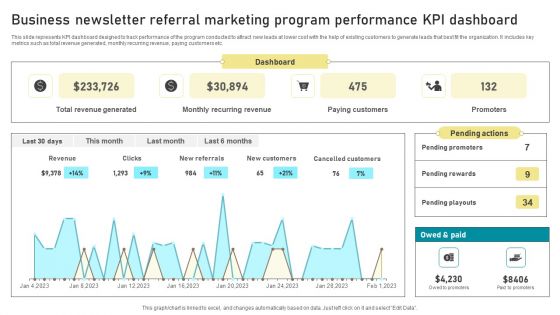
Business Newsletter Referral Marketing Program Performance KPI Dashboard Formats PDF
This slide represents KPI dashboard designed to track performance of the program conducted to attract new leads at lower cost with the help of existing customers to generate leads that best fit the organization. It includes key metrics such as total revenue generated, monthly recurring revenue, paying customers etc. Showcasing this set of slides titled Business Newsletter Referral Marketing Program Performance KPI Dashboard Formats PDF. The topics addressed in these templates are Dashboard, Paying Customers, Monthly Recurring Revenue, Total Revenue Generated. All the content presented in this PPT design is completely editable. Download it and make adjustments in color, background, font etc. as per your unique business setting.
-
Business Referral Marketing Program Performance Metrics Dashboard Introduction PDF
This slide shows KPI dashboard to effectively track performance of business referral program in order to attract more leads and potential customers to the busines. It includes details related to key metrics such as referral participation rate, referred customers, referral conversion rate and total revenue generated. Showcasing this set of slides titled Business Referral Marketing Program Performance Metrics Dashboard Introduction PDF. The topics addressed in these templates are Referral Participation Rate, Referred Customers, Referral Conversion Rate, Total Revenue Generated. All the content presented in this PPT design is completely editable. Download it and make adjustments in color, background, font etc. as per your unique business setting.
-
Paid Advertising Techniques To Enhance Business Sales KPI Dashboard To Track Paid Social Media Microsoft PDF
This slide covers a dashboard that organizations can use to track the paid social media plan results. The template provides information about key metrics such as social media status, engaged users, page impressions, page likes, etc. Here you can discover an assortment of the finest PowerPoint and Google Slides templates. With these templates, you can create presentations for a variety of purposes while simultaneously providing your audience with an eye catching visual experience. Download Paid Advertising Techniques To Enhance Business Sales KPI Dashboard To Track Paid Social Media Microsoft PDF to deliver an impeccable presentation. These templates will make your job of preparing presentations much quicker, yet still, maintain a high level of quality. Slidegeeks has experienced researchers who prepare these templates and write high quality content for you. Later on, you can personalize the content by editing the Paid Advertising Techniques To Enhance Business Sales KPI Dashboard To Track Paid Social Media Microsoft PDF.
-
Dashboard To Measure Performance Of E Commerce Retail Business Growth Marketing Techniques Icons PDF
This following slide displays the key metrics that can help an organization to measure effectiveness of e-commerce strategies. These can be revenue generated using e-commerce platform, conversion rates etc. If your project calls for a presentation, then Slidegeeks is your go to partner because we have professionally designed, easy to edit templates that are perfect for any presentation. After downloading, you can easily edit Dashboard To Measure Performance Of E Commerce Retail Business Growth Marketing Techniques Icons PDF and make the changes accordingly. You can rearrange slides or fill them with different images. Check out all the handy templates
-
Dashboard To Measure Performance Of Social Media Retail Business Growth Marketing Techniques Ideas PDF
This following slide displays the key metrics that can help an organization to measure effectiveness of social media strategies. These can be leads generated, leads by region, web traffic targets etc If you are looking for a format to display your unique thoughts, then the professionally designed Dashboard To Measure Performance Of Social Media Retail Business Growth Marketing Techniques Ideas PDF is the one for you. You can use it as a Google Slides template or a PowerPoint template. Incorporate impressive visuals, symbols, images, and other charts. Modify or reorganize the text boxes as you desire. Experiment with shade schemes and font pairings. Alter, share or cooperate with other people on your work. Download Dashboard To Measure Performance Of Social Media Retail Business Growth Marketing Techniques Ideas PDF and find out how to give a successful presentation. Present a perfect display to your team and make your presentation unforgettable.
-
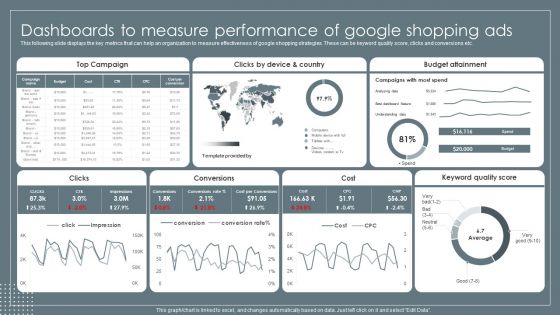
Dashboards To Measure Performance Of Google Retail Business Growth Marketing Techniques Background PDF
This following slide displays the key metrics that can help an organization to measure effectiveness of google shopping strategies. These can be keyword quality score, clicks and conversions etc. Are you in need of a template that can accommodate all of your creative concepts This one is crafted professionally and can be altered to fit any style. Use it with Google Slides or PowerPoint. Include striking photographs, symbols, depictions, and other visuals. Fill, move around, or remove text boxes as desired. Test out color palettes and font mixtures. Edit and save your work, or work with colleagues. Download Dashboards To Measure Performance Of Google Retail Business Growth Marketing Techniques Background PDF and observe how to make your presentation outstanding. Give an impeccable presentation to your group and make your presentation unforgettable.
-
Dashboards To Measure Performance Of Mobile Retail Business Growth Marketing Techniques Professional PDF
This following slide displays the key metrics that can help an organization to measure effectiveness of mobile marketing strategies. These can be top performing campaigns, devises used for transactions etc. Crafting an eye catching presentation has never been more straightforward. Let your presentation shine with this tasteful yet straightforward Dashboards To Measure Performance Of Mobile Retail Business Growth Marketing Techniques Professional PDF template. It offers a minimalistic and classy look that is great for making a statement. The colors have been employed intelligently to add a bit of playfulness while still remaining professional. Construct the ideal Dashboards To Measure Performance Of Mobile Retail Business Growth Marketing Techniques Professional PDF that effortlessly grabs the attention of your audience. Begin now and be certain to wow your customers.
-
Product Portfolios And Strategic Dashboard To Measure Business Performance Portrait PDF
This slide illustrates a dashboard that can be used by a product manager to measure the business performance. Metrics covered in the dashboard are revenue, launches, cash flow, EPS, average revenue by product and average cost by phase. Do you have an important presentation coming up Are you looking for something that will make your presentation stand out from the rest Look no further than Product Portfolios And Strategic Dashboard To Measure Business Performance Portrait PDF. With our professional designs, you can trust that your presentation will pop and make delivering it a smooth process. And with Slidegeeks, you can trust that your presentation will be unique and memorable. So why wait Grab Product Portfolios And Strategic Dashboard To Measure Business Performance Portrait PDF today and make your presentation stand out from the rest.
-
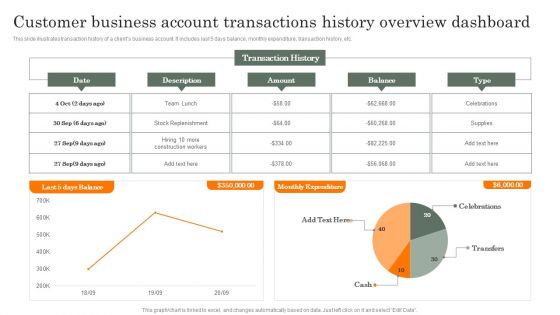
Customer Business Account Transactions History Overview Dashboard Guidelines PDF
This slide illustrates transaction history of a clients business account. It includes last 5 days balance, monthly expenditure, transaction history, etc. Showcasing this set of slides titled Customer Business Account Transactions History Overview Dashboard Guidelines PDF. The topics addressed in these templates are Customer Business, Account Transactions, History Overview. All the content presented in this PPT design is completely editable. Download it and make adjustments in color, background, font etc. as per your unique business setting.
-
Transforming Business With AI Digital Media Tracking Dashboard Summary PDF
This slide covers the digital marketing dashboard along with the lead breakdown, google analytics traffic, and social media channels. Do you have to make sure that everyone on your team knows about any specific topic I yes, then you should give Transforming Business With AI Digital Media Tracking Dashboard Summary PDF a try. Our experts have put a lot of knowledge and effort into creating this impeccable Transforming Business With AI Digital Media Tracking Dashboard Summary PDF. You can use this template for your upcoming presentations, as the slides are perfect to represent even the tiniest detail. You can download these templates from the Slidegeeks website and these are easy to edit. So grab these today.
-
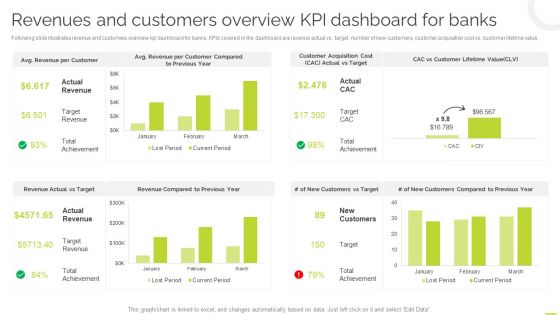
Effective BPM Tool For Business Process Management Revenues And Customers Overview KPI Dashboard For Banks Elements PDF
Following slide illustrates revenue and customers overview kpi dashboard for banks. KPIs covered in the dashboard are revenue actual vs target, number of new customers, customer acquisition cost vs. customer lifetime value. This Effective BPM Tool For Business Process Management Revenues And Customers Overview KPI Dashboard For Banks Elements PDF is perfect for any presentation, be it in front of clients or colleagues. It is a versatile and stylish solution for organizing your meetings. The Effective BPM Tool For Business Process Management Revenues And Customers Overview KPI Dashboard For Banks Elements PDF features a modern design for your presentation meetings. The adjustable and customizable slides provide unlimited possibilities for acing up your presentation. Slidegeeks has done all the homework before launching the product for you. So, do not wait, grab the presentation templates today.
-
Managing E Commerce Business Accounting Dashboard Indicating Online Store Accounts Overview Inspiration PDF
The following slide showcases ecommerce accounts management dashboard. It provides information about income, expenses, cash collected, cash spent, tax collected, tax claim, stock sold, invoice, etc. There are so many reasons you need a Managing E Commerce Business Accounting Dashboard Indicating Online Store Accounts Overview Inspiration PDF. The first reason is you can not spend time making everything from scratch, Thus, Slidegeeks has made presentation templates for you too. You can easily download these templates from our website easily.
-
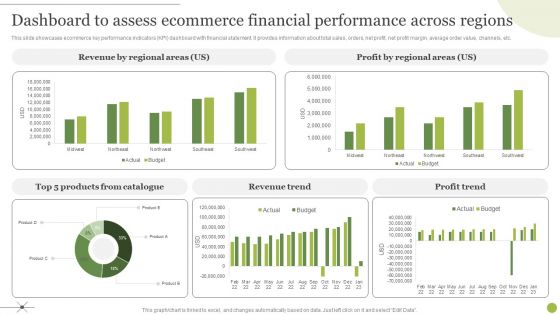
Managing E Commerce Business Accounting Dashboard To Assess Ecommerce Financial Performance Across Regions Graphics PDF
This slide showcases ecommerce key performance indicators KPI dashboard with financial statement. It provides information about total sales, orders, net profit, net profit margin, average order value, channels, etc. Do you have to make sure that everyone on your team knows about any specific topic I yes, then you should give Managing E Commerce Business Accounting Dashboard To Assess Ecommerce Financial Performance Across Regions Graphics PDF a try. Our experts have put a lot of knowledge and effort into creating this impeccable Managing E Commerce Business Accounting Dashboard To Assess Ecommerce Financial Performance Across Regions Graphics PDF. You can use this template for your upcoming presentations, as the slides are perfect to represent even the tiniest detail. You can download these templates from the Slidegeeks website and these are easy to edit. So grab these today.
-
Managing E Commerce Business Accounting Ecommerce KPI Dashboard With P And L Statement Diagrams PDF
This slide showcases ecommerce key performance indicators KPI dashboard with financial statement. It provides information about total sales, orders, net profit, net profit margin, average order value, channels, etc. Present like a pro with Managing E Commerce Business Accounting Ecommerce KPI Dashboard With P And L Statement Diagrams PDF Create beautiful presentations together with your team, using our easy to use presentation slides. Share your ideas in real time and make changes on the fly by downloading our templates. So whether you are in the office, on the go, or in a remote location, you can stay in sync with your team and present your ideas with confidence. With Slidegeeks presentation got a whole lot easier. Grab these presentations today.
-
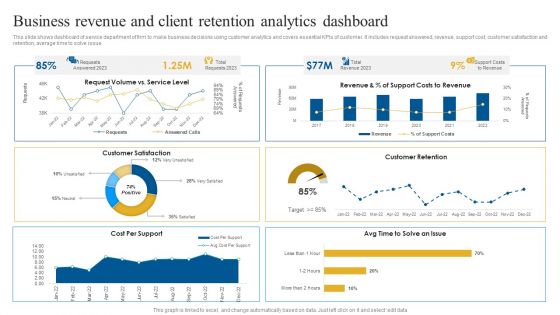
Business Revenue And Client Retention Analytics Dashboard Brochure PDF
This slide shows dashboard of service department of firm to make business decisions using customer analytics and covers essential KPIs of customer. It includes request answered, revenue, support cost, customer satisfaction and retention, average time to solve issue. Showcasing this set of slides titled Business Revenue And Client Retention Analytics Dashboard Brochure PDF. The topics addressed in these templates are Customer Satisfaction, Customer Retention, Revenue. All the content presented in this PPT design is completely editable. Download it and make adjustments in color, background, font etc. as per your unique business setting.
-
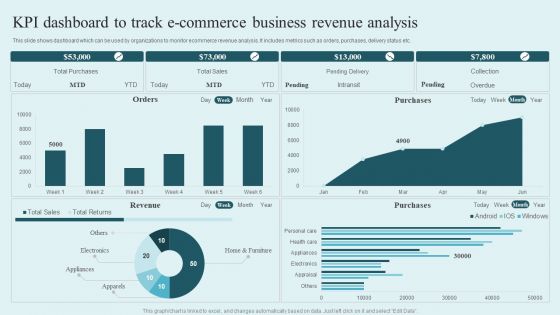
KPI Dashboard To Track E Commerce Business Revenue Analysis Rules PDF
This slide shows dashboard which can be used by organizations to monitor ecommerce revenue analysis. It includes metrics such as orders, purchases, delivery status etc. Pitch your topic with ease and precision using this KPI Dashboard To Track E Commerce Business Revenue Analysis Rules PDF. This layout presents information on Total Purchases, Total Sales, Pending Delivery, Collection. It is also available for immediate download and adjustment. So, changes can be made in the color, design, graphics or any other component to create a unique layout.
-
Boutique Financing Hotel Property Business Analysis Dashboard Demonstration PDF
This slide shows dashboard with various indicators used to analyse hotel investment and development. It includes property information, acquisition details and KPIS such as EBITDA , interest, interest coverage ratio, REVPAR and yield. Showcasing this set of slides titled Boutique Financing Hotel Property Business Analysis Dashboard Demonstration PDF. The topics addressed in these templates are Property information, Acquisition information. All the content presented in this PPT design is completely editable. Download it and make adjustments in color, background, font etc. as per your unique business setting.
-
Annual Business Financial Summary Dashboard Themes PDF
This slide shows annual financial report dashboard of company to monitor yearly business performance. It includes various indicators such as revenue, net profits, costs and breakdown of cost. Showcasing this set of slides titled Annual Business Financial Summary Dashboard Themes PDF. The topics addressed in these templates are Revenue, Costs, Net Profit. All the content presented in this PPT design is completely editable. Download it and make adjustments in color, background, font etc. as per your unique business setting.
-
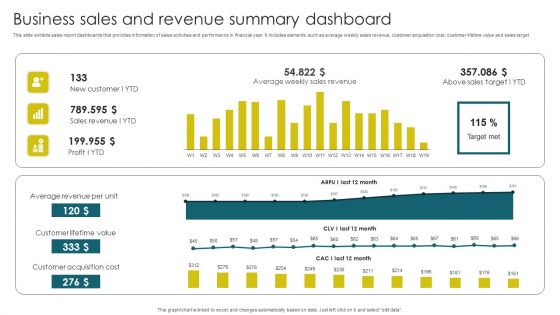
Business Sales And Revenue Summary Dashboard Brochure PDF
This slide exhibits sales report dashboards that provides information of sales activities and performance in financial year. It includes elements such as average weekly sales revenue, customer acquisition cost, customer lifetime value and sales target. Pitch your topic with ease and precision using this Business Sales And Revenue Summary Dashboard Brochure PDF. This layout presents information on Average Revenue, Customer Lifetime, Customer Acquisition. It is also available for immediate download and adjustment. So, changes can be made in the color, design, graphics or any other component to create a unique layout.
-
IT Business Alignment Framework Dashboard For Tracking Business And IT Alignment Diagrams PDF
This slide depicts the dashboard for business and IT alignment by covering details of total sales, customer support service, percentage of business operations aligned IT, usage of communication channels, and top performer associates.This IT Business Alignment Framework Dashboard For Tracking Business And IT Alignment Diagrams PDF from Slidegeeks makes it easy to present information on your topic with precision. It provides customization options, so you can make changes to the colors, design, graphics, or any other component to create a unique layout. It is also available for immediate download, so you can begin using it right away. Slidegeeks has done good research to ensure that you have everything you need to make your presentation stand out. Make a name out there for a brilliant performance.
-
Product Marketing Management To Enforce Business Performance Dashboard Showing Digital Professional PDF
Do you know about Slidesgeeks Product Marketing Management To Enforce Business Performance Dashboard Showing Digital Professional PDF These are perfect for delivering any kind od presentation. Using it, create PowerPoint presentations that communicate your ideas and engage audiences. Save time and effort by using our pre designed presentation templates that are perfect for a wide range of topic. Our vast selection of designs covers a range of styles, from creative to business, and are all highly customizable and easy to edit. Download as a PowerPoint template or use them as Google Slides themes.
-
Business Performance Monitoring Kpi Dashboard Guide For Successful Merger And Acquisition Mockup PDF
Coming up with a presentation necessitates that the majority of the effort goes into the content and the message you intend to convey. The visuals of a PowerPoint presentation can only be effective if it supplements and supports the story that is being told. Keeping this in mind our experts created Business Performance Monitoring Kpi Dashboard Guide For Successful Merger And Acquisition Mockup PDF to reduce the time that goes into designing the presentation. This way, you can concentrate on the message while our designers take care of providing you with the right template for the situation.
-
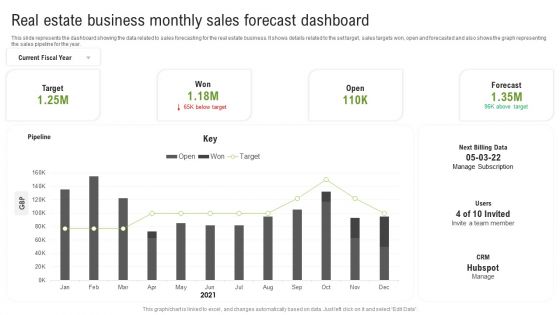
Real Estate Business Monthly Sales Forecast Dashboard Ppt Layouts Grid PDF
This slide represents the dashboard showing the data related to sales forecasting for the real estate business. It shows details related to the set target, sales targets won, open and forecasted and also shows the graph representing the sales pipeline for the year. Showcasing this set of slides titled Real Estate Business Monthly Sales Forecast Dashboard Ppt Layouts Grid PDF. The topics addressed in these templates are Next Billing Data, Pipeline, Current Fiscal Year. All the content presented in this PPT design is completely editable. Download it and make adjustments in color, background, font etc. as per your unique business setting.
-
KPI Dashboard To Track Effectiveness Of Real Estate Business Performance Slides PDF
The following slide exhibits key performance indicator KPI dashboard which can be used to measure the financial performance of the real estate company. It covers various kpis such as sales vs target per agent, top 10 projects, top 5 agencies etc. Deliver an awe inspiring pitch with this creative KPI Dashboard To Track Effectiveness Of Real Estate Business Performance Slides PDF bundle. Topics like KPI Dashboard, Track Effectiveness, Real Estate Business Performance can be discussed with this completely editable template. It is available for immediate download depending on the needs and requirements of the user.
-
Annual Business Performance Assessment And Evaluation Dashboard Brochure PDF
This slide represents a dashboard highlighting performance of a business concern in various segments. It includes average revenue per unit, customer lifetime value, customer acquisition cost, etc. Showcasing this set of slides titled Annual Business Performance Assessment And Evaluation Dashboard Brochure PDF. The topics addressed in these templates are Profit, Sales Revenue, New Customer. All the content presented in this PPT design is completely editable. Download it and make adjustments in color, background, font etc. as per your unique business setting.
-
Yearly Business Performance Assessment And Evaluation Dashboard Structure PDF
This slide contains annual business review of a company. It includes revenue comparison, sales assessment and profitability representation. Showcasing this set of slides titled Yearly Business Performance Assessment And Evaluation Dashboard Structure PDF. The topics addressed in these templates are Revenue Comparison, Sales, Profitability. All the content presented in this PPT design is completely editable. Download it and make adjustments in color, background, font etc. as per your unique business setting.
-
Profit And Loss Dashboard Indicating Business Operational Expenditure And EBIT Formats PDF
This slide shows profit and loss dashboard indicating opex operating expenses and ebit earning before interest and taxes which can be referred by companies in management of cash inflows and outflows of operations. It contains gross profit margin, net profit margin, ratio, income statement, etc. Showcasing this set of slides titled Profit And Loss Dashboard Indicating Business Operational Expenditure And EBIT Formats PDF. The topics addressed in these templates are Revenue, Gross Profit, Sales. All the content presented in this PPT design is completely editable. Download it and make adjustments in color, background, font etc. as per your unique business setting.
-
Business Operational Expenditure Dashboard Indicating Revenue And Costs Metrics Pictures PDF
This slide shows operating expenses OPEX dashboard indicating revenue and costs metrics which can be referred by companies to manage various operating expenses of various departments. It contains information about cost center, revenue per company, company code, etc. Pitch your topic with ease and precision using this Business Operational Expenditure Dashboard Indicating Revenue And Costs Metrics Pictures PDF. This layout presents information on Business Operational, Costs Metrics, Revenue. It is also available for immediate download and adjustment. So, changes can be made in the color, design, graphics or any other component to create a unique layout.
-
Business Operational Expenditure Monitoring Dashboard With Budget Analysis Icons PDF
This slide shows operating expenses OPEX monitoring dashboard with budget analysis assisting companies in evaluating funds useful until end of the year. It visually present the organizations operating expenses by time period and sector. Showcasing this set of slides titled Business Operational Expenditure Monitoring Dashboard With Budget Analysis Icons PDF. The topics addressed in these templates are Business Operational, Budget Analysis, Monitoring Dashboard. All the content presented in this PPT design is completely editable. Download it and make adjustments in color, background, font etc. as per your unique business setting.
-
Digital Marketing Dashboard For Organic Growth Playbook Year Over Year Business Success Playbook Themes PDF
This Digital Marketing Dashboard For Organic Growth Playbook Year Over Year Business Success Playbook Themes PDF from Slidegeeks makes it easy to present information on your topic with precision. It provides customization options, so you can make changes to the colors, design, graphics, or any other component to create a unique layout. It is also available for immediate download, so you can begin using it right away. Slidegeeks has done good research to ensure that you have everything you need to make your presentation stand out. Make a name out there for a brilliant performance.


