Two Phases
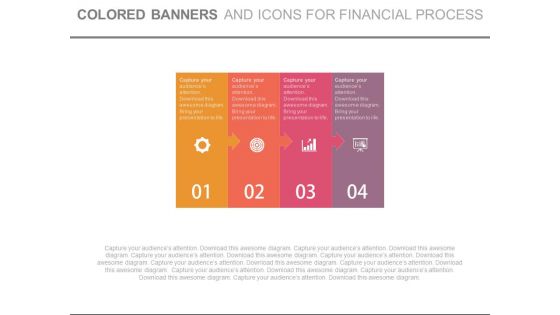
Banners Infographics For Financial Process Powerpoint Slides
This PowerPoint template contains diagram of banners infographic. You may download this slide to display strategy steps for financial process. You can easily customize this template to make it more unique as per your need.

Competitive Financial Strategy For Success Powerpoint Template
Our above diagram contains graphics of steps of money with trophy on top. Download this PowerPoint template to display competitive financial strategy and success. Present your opinions in impressive manner using this professional template.
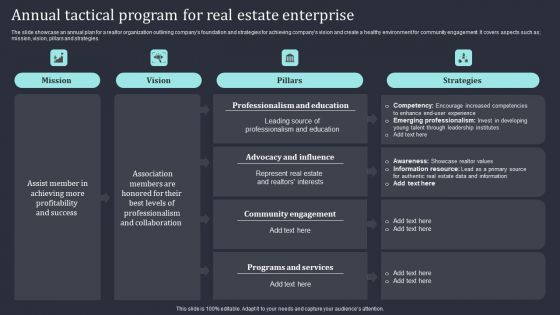
Annual Tactical Program For Real Estate Enterprise Themes PDF
The slide showcase an annual plan for a realtor organization outlining companys foundation and strategies for achieving companys vision and create a healthy environment for community engagement. It covers aspects such as mission, vision, pillars and strategies. Showcasing this set of slides titled Annual Tactical Program For Real Estate Enterprise Themes PDF. The topics addressed in these templates are Programs And Services, Community Engagement, Advocacy And Influence. All the content presented in this PPT design is completely editable. Download it and make adjustments in color, background, font etc. as per your unique business setting.
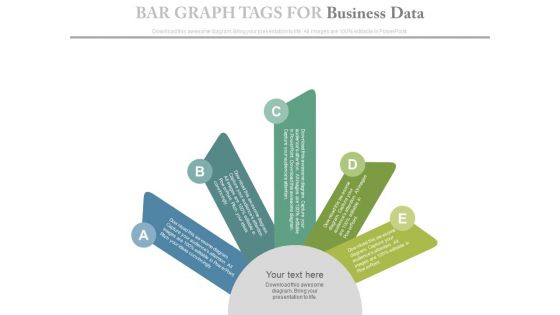
Tags For Visual Display Of Information Powerpoint Slides
This PowerPoint template is one of our most downloaded slides. It has been creatively designed and depicts a graph in a very modern style. The slide can alternatively be used to depict tags or bookmarks. This slide can serve the purpose of comparing different products or different variants of the same product. The slide can also be used to represent different departments of the same organization. The changing shades of the same color can be used to represent steps of a process or occurring of changes. The slide is 100% customizable and you have the choice to add colors and icons of your choice.

Trend Of Quarterly Funding For Start Up Project Performance Chart Graphics PDF
This slide depicts investment made in different start up projects for 2 years. It also includes the investment amount, funding quarters in graphical form with a trend line and insights. Pitch your topic with ease and precision using this Trend Of Quarterly Funding For Start Up Project Performance Chart Graphics PDF. This layout presents information on Good Management, Efficient Team, Investment Decreased. It is also available for immediate download and adjustment. So, changes can be made in the color, design, graphics or any other component to create a unique layout.

Balloons Diagram For Financial Goal Planning Powerpoint Slides
This PowerPoint template has been designed with graphics of balloons diagram. You may download this diagram slide to depict balance between demand and supply. Add this slide to your presentation and impress your superiors.
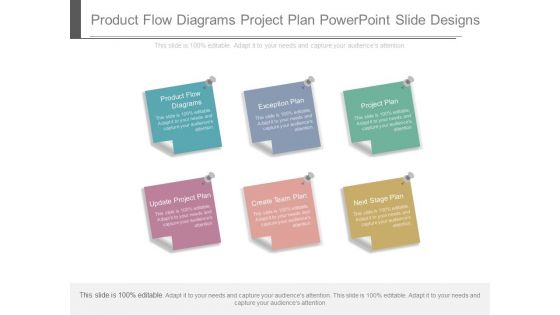
Product Flow Diagrams Project Plan Powerpoint Slide Designs
This is a product flow diagrams project plan powerpoint slide designs. This is a six stage process. The stages in this process are product flow diagrams, exception plan, project plan, update project plan, create team plan, next stage plan.

Dollar Key With House Model For Real Estate Powerpoint Template
Our above business slide contains diagram of house with dollar key tags. This infographic slide helps to exhibit real estate market. Use this diagram to impart more clarity to subject and to create more sound impact on viewers.

Businessman Under Law Gavel Powerpoint Templates
This slide has been designed with graphics of business man under law gavel. This business diagram helps to exhibit concept of legal notice. Use this diagram to build an exclusive presentation.

Leader With Different Working Approach Powerpoint Templates
This diagram slide can be used to display leadership activities. This professional diagram contains graphics team with unique leader. Use this slide to build unique presentations for your viewers.
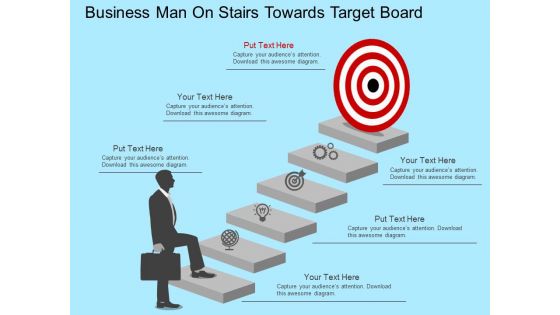
Business Man On Stairs Towards Target Board Powerpoint Template
This PowerPoint template has been designed with man on stairs towards target board. This business diagram helps to exhibit steps of target achievement. Use this PPT diagram slide to visually support your content.
Convertible Debenture Funding Operational Overview Of The Company Ppt File Icons PDF
The slide provides a brief overview of the companys operations along with its mission, vision and key Facts. Presenting convertible debenture funding operational overview of the company ppt file icons pdf to provide visual cues and insights. Share and navigate important information on one stages that need your due attention. This template can be used to pitch topics like key facts, employs, mission, vision, social media followers, locations. In addition, this PPT design contains high-resolution images, graphics, etc, that are easily editable and available for immediate download.
Building Design Firm Details Why To Choose Us Ppt Professional Icons PDF
This slide highlights the architecture company approach which includes optimize building inputs, design energy-efficient buildings, optimal and economical efficient space. Presenting Building Design Firm Details Why To Choose Us Ppt Professional Icons PDF to provide visual cues and insights. Share and navigate important information on six stages that need your due attention. This template can be used to pitch topics like Optimize Building Inputs, Per Budget, Design Energy, Efficient Buildings, Consume Less Fuels. In addtion, this PPT design contains high resolution images, graphics, etc, that are easily editable and available for immediate download.
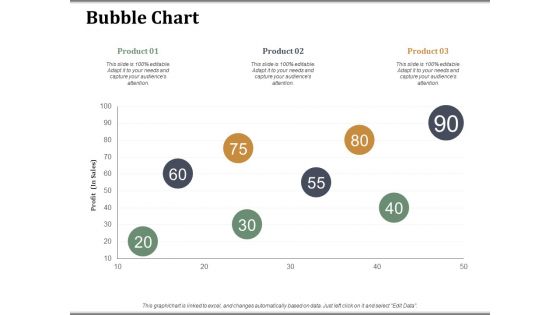
Bubble Chart Companys Business Model Canvas Ppt PowerPoint Presentation Professional Slide Portrait
This is a bubble chart companys business model canvas ppt powerpoint presentation professional slide portrait. This is a three stage process. The stages in this process are.
Information Technology Service Proposal Format Ppt Powerpoint Presentation Icon Files
This is a information technology service proposal format ppt powerpoint presentation icon files. This is a four stage process. The stages in this process are it solution proposal, it solution approach, it solution plan.
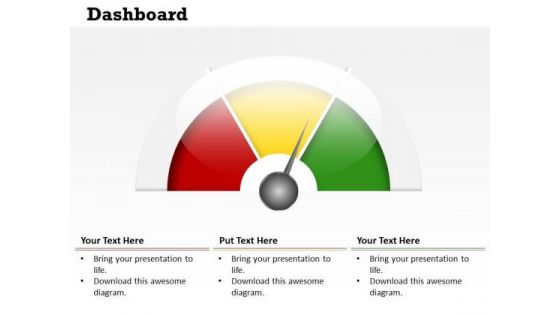
Business Framework Model Dashboard Business Meter Design Sales Diagram
Our Business Framework Model Dashboard Business Meter Design Sales Diagram Powerpoint Templates Team Are A Dogged Lot. They Keep At It Till They Get It Right.
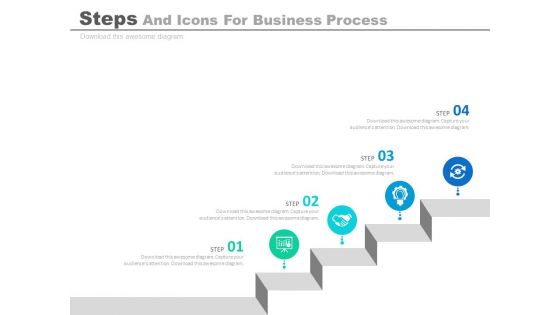
Infographic Diagram For Business Process Analysis Powerpoint Slides
This PowerPoint slide contains business infographic diagram. This professional slide may be used to display business process analysis. Use this business template to make impressive presentations.

Semicircle Infographic Diagram For Business Process Powerpoint Slides
This PowerPoint template has been designed with semicircle infographic diagram. This PPT slide may be used to display business process flow. Download this slide to build unique presentation.
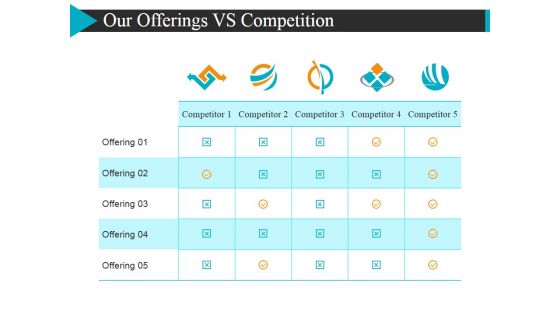
Our Offerings Vs Competition Ppt PowerPoint Presentation Diagram Templates
This is a our offerings vs competition ppt powerpoint presentation diagram templates. This is a five stage process. The stages in this process are offering, competitor, business, table.

Thank You Communication Matrix Ppt PowerPoint Presentation Layouts Diagrams
This is a thank you communication matrix ppt powerpoint presentation layouts diagrams. This is a one stage process. The stages in this process are thank you.

Thank You Talent Development Ppt PowerPoint Presentation Diagram Lists
This is a thank you talent development ppt powerpoint presentation diagram lists. This is a one stage process. The stages in this process are thank you.
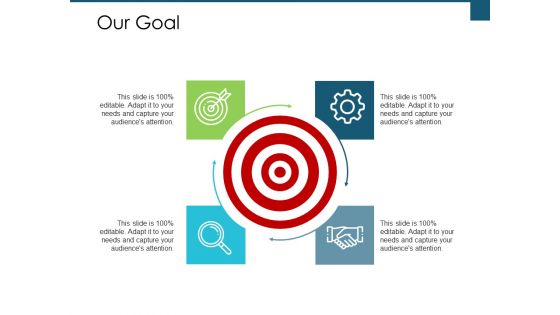
Our Goal Arrow Ppt PowerPoint Presentation Styles Diagrams
This is a our goal arrow ppt powerpoint presentation styles diagrams. This is a four stage process. The stages in this process are arrow, marketing, strategy, competition, success.

Welcome New Year 2019 Ppt Powerpoint Presentation Diagram Templates
This is a welcome new year 2019 ppt powerpoint presentation diagram templates. This is a one stage process. The stages in this process are 2018 welcome.

User Manual With Magnifying Glass Ppt Powerpoint Presentation Diagram Ppt
This is a user manual with magnifying glass ppt powerpoint presentation diagram ppt. This is a three stage process. The stages in this process are advice, guidance, counsel.
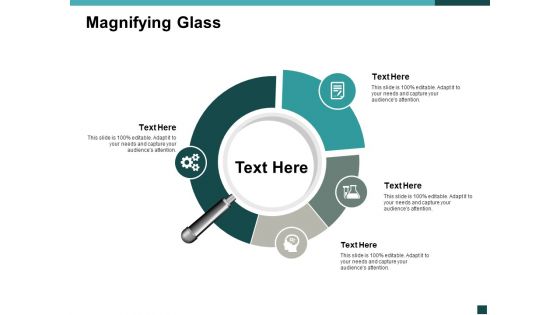
Magnifying Glass Technology Ppt Powerpoint Presentation Gallery Diagrams
This is a magnifying glass technology ppt powerpoint presentation gallery diagrams. This is a four stage process. The stages in this process are finance, marketing, management, investment, analysis.
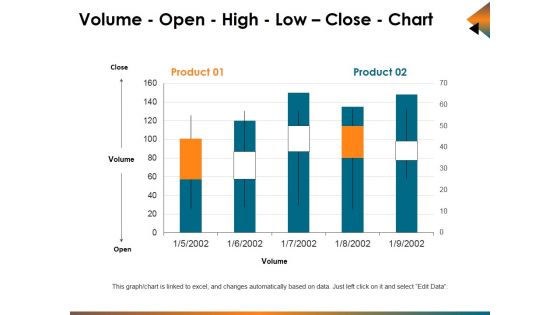
Volume Open High Low Close Chart Ppt PowerPoint Presentation Ideas Graphics Example
This is a volume open high low close chart ppt powerpoint presentation ideas graphics example. This is a five stage process. The stages in this process are business, bar graph, stock, cost, market.
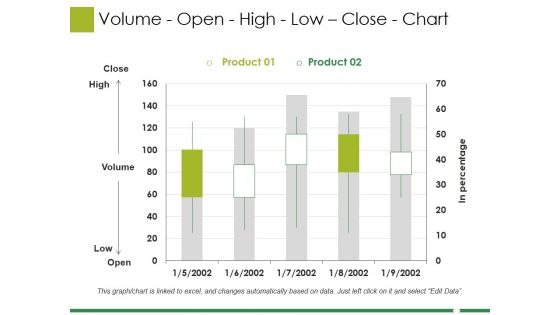
Volume Open High Low Close Chart Ppt PowerPoint Presentation Professional Format
This is a volume open high low close chart ppt powerpoint presentation professional format. This is a five stage process. The stages in this process are business, marketing, strategy, finance, planning.

Project Management Gantt Chart Template Ppt PowerPoint Presentation Summary Master Slide
This is a project management gantt chart template ppt powerpoint presentation summary master slide. This is a seven stage process. The stages in this process are lists, table, data, management, marketing.

Data Collection And Analysis Control Chart Ppt PowerPoint Presentation Summary Templates
This is a data collection and analysis control chart ppt powerpoint presentation summary templates. This is a one stage process. The stages in this process are business, marketing, point label, upper limit, lower limit.

Volume Open High Low Close Chart Ppt PowerPoint Presentation Model Ideas
This is a volume open high low close chart ppt powerpoint presentation model ideas. This is a five stage process. The stages in this process are finance, marketing, analysis, business, investment.

Volume Open High Low Close Chart Ppt PowerPoint Presentation Pictures Tips
This is a volume open high low close chart ppt powerpoint presentation pictures tips. This is a three stage process. The stages in this process are high, volume, low, open, business.
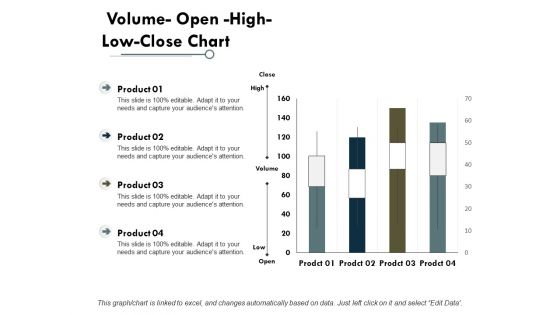
Volume Open High Low Close Chart Finance Ppt PowerPoint Presentation Professional Background Image
This is a volume open high low close chart finance ppt powerpoint presentation professional background image. This is a four stage process. The stages in this process are finance, analysis, business, investment, marketing.
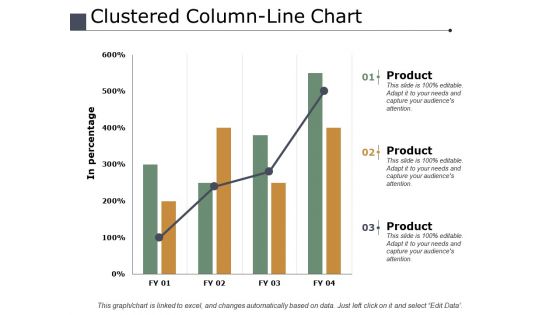
Clustered Column Line Chart Finance Ppt PowerPoint Presentation Inspiration Design Templates
This is a clustered column line chart finance ppt powerpoint presentation inspiration design templates. This is a three stage process. The stages in this process are finance, analysis, business, investment, marketing.

Volume Open High Low Close Chart Finance Ppt PowerPoint Presentation Model Graphic Images
This is a volume open high low close chart finance ppt powerpoint presentation model graphic images. This is a three stage process. The stages in this process are finance, analysis, business, investment, marketing.

Data Analysis Chart For Funds Management Ppt PowerPoint Presentation Infographic Template Files
This is a data analysis chart for funds management ppt powerpoint presentation infographic template files. This is a five stage process. The stages in this process are financial analysis, quantitative, statistical modelling.
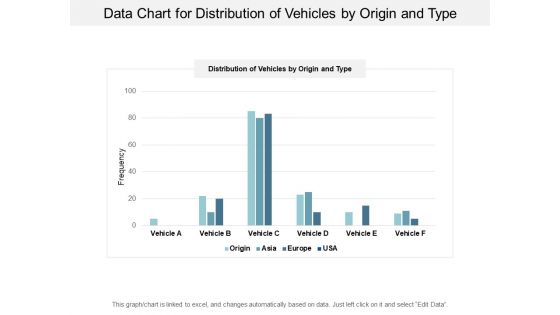
Data Chart For Distribution Of Vehicles By Origin And Type Ppt PowerPoint Presentation Infographics Topics
This is a data chart for distribution of vehicles by origin and type ppt powerpoint presentation infographics topics. This is a four stage process. The stages in this process are financial analysis, quantitative, statistical modelling.

Data Chart For Individual Income Analysis Ppt PowerPoint Presentation Layouts Visual Aids
This is a data chart for individual income analysis ppt powerpoint presentation layouts visual aids. This is a five stage process. The stages in this process are financial analysis, quantitative, statistical modelling.

Yearly Business Performance Chart For Customer Profitability Analysis Ppt PowerPoint Presentation Ideas Picture
This is a yearly business performance chart for customer profitability analysis ppt powerpoint presentation ideas picture. This is a five stage process. The stages in this process are financial analysis, quantitative, statistical modelling.
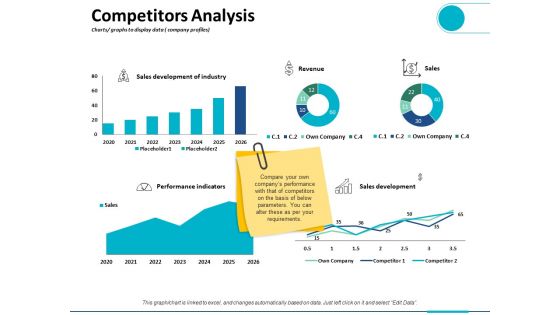
Competitors Analysis Charts Graphs To Display Data Company Profiles Ppt PowerPoint Presentation Outline Visual Aids
This is a competitors analysis charts graphs to display data company profiles ppt powerpoint presentation outline visual aids. This is a five stage process. The stages in this process are finance, analysis, business, investment, marketing.
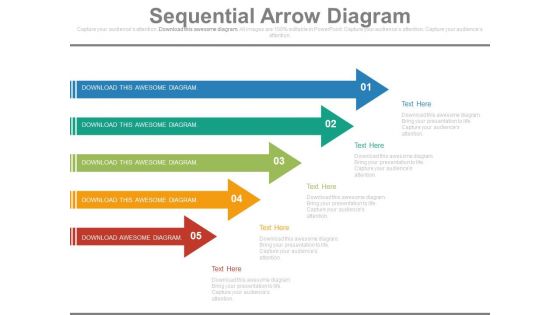
Five Arrows Diagram For Process Flow Powerpoint Slides
This PowerPoint template has been designed with five arrows diagram. The PowerPoint template has a high quality design. You can download this PowerPoint slide for corporate presentations or annual meeting and business plans.

Money Plant Diagram For Dollar Growth Powerpoint Slides
This PowerPoint template has been designed with money plan diagram. This PowerPoint template may be used to display dollar growth and investment. Prove the viability of your ideas using this impressive slide.
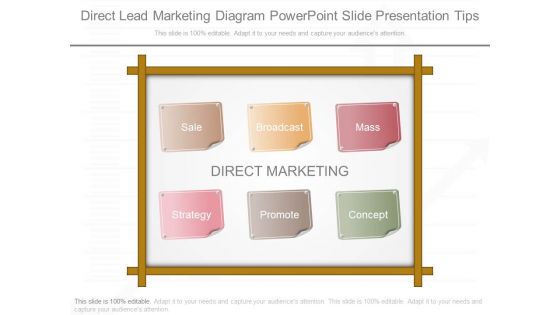
Direct Lead Marketing Diagram Powerpoint Slide Presentation Tips
This is a direct lead marketing diagram powerpoint slide presentation tips. This is a six stage process. The stages in this process are sale, broadcast, mass, direct marketing, strategy, promote, concept.\n\n

Key Performance Indicator Dashboard Diagram Example Of Ppt
This is a key performance indicator dashboard diagram example of ppt. This is a five stage process. The stages in this process are relationships, account plans, account strategy, setting tools, reporting.
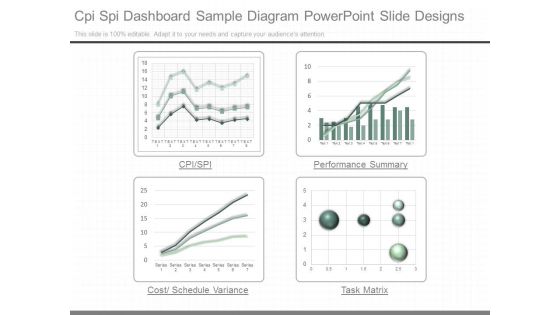
Cpi Spi Dashboard Sample Diagram Powerpoint Slide Designs
This is a cpi spi dashboard sample diagram powerpoint slide designs. This is a four stage process. The stages in this process are cpi spi, performance summary, cost schedule variance, task matrix.
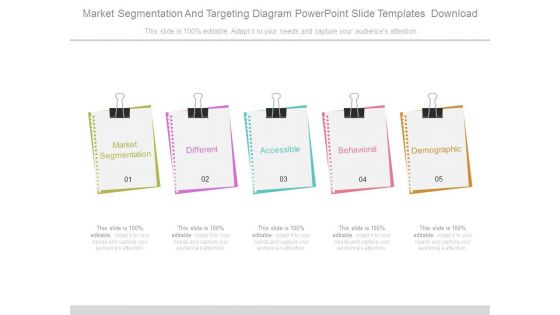
Market Segmentation And Targeting Diagram Powerpoint Slide Templates Download
This is a market segmentation and targeting diagram powerpoint slide templates download. This is a five stage process. The stages in this process are market segmentation, different, accessible, behavioral, demographic.

Cash Conversion Cycle Diagram Example Of Ppt Presentation
This is a cash conversion cycle diagram example of ppt presentation. This is a four stage process. The stages in this process are order to cash, forecast to fulfill, purchase to pay, cash conversion cycle.
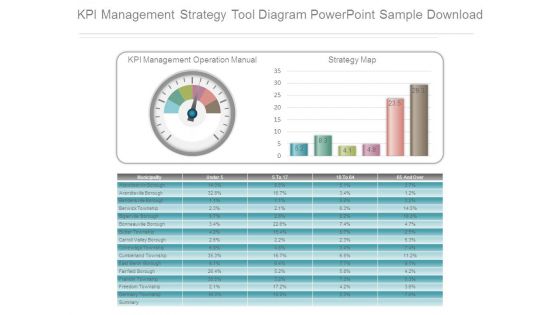
Kpi Management Strategy Tool Diagram Powerpoint Sample Download
This is a kpi management strategy tool diagram powerpoint sample download. This is a one stage process. The stages in this process are kpi management operation manual, strategy map.
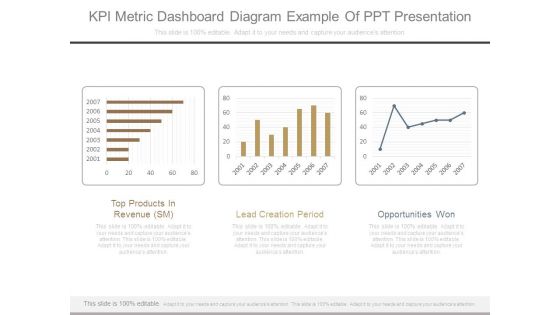
Kpi Metric Dashboard Diagram Example Of Ppt Presentation
This is a kpi metric dashboard diagram example of ppt presentation. This is a three stage process. The stages in this process are top products in revenue sm, lead creation period, opportunities won.

Assets And Revenue Financial Summary Ppt PowerPoint Presentation Diagram Lists
This is a assets and revenue financial summary ppt powerpoint presentation diagram lists. This is a six stage process. The stages in this process are total assets, revenue, deposits, loan, net income.
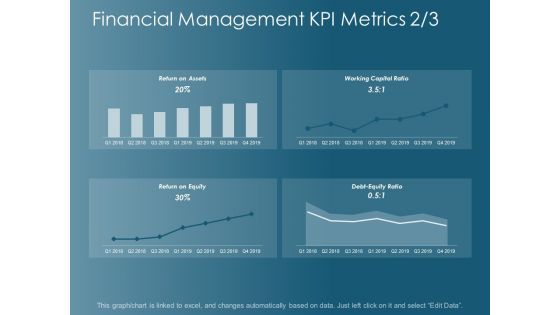
Financial Management Kpi Metrics Business Ppt Powerpoint Presentation Styles Diagrams
This is a financial management kpi metrics business ppt powerpoint presentation styles diagrams. This is a four stage process. The stages in this process are finance, marketing, management, investment, analysis.

Annual Review Work Performance Report Ppt Powerpoint Presentation Styles Diagrams
This is a annual review work performance report ppt powerpoint presentation styles diagrams. This is a eight stage process. The stages in this process are year end review, annual review, yearly review.
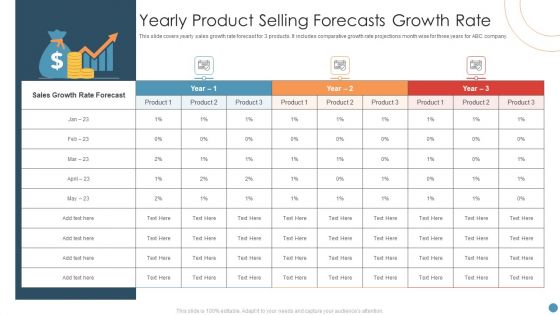
Yearly Product Selling Forecasts Growth Rate Diagrams PDF
This slide covers yearly sales growth rate forecast for 3 products. It includes comparative growth rate projections month wise for three years for ABC company. Presenting Yearly Product Selling Forecasts Growth Rate Diagrams PDF to dispense important information. This template comprises three stages. It also presents valuable insights into the topics including Product Selling Forecasts, Growth Rate. This is a completely customizable PowerPoint theme that can be put to use immediately. So, download it and address the topic impactfully.

CSR Performance Report Insights And Stats Diagrams PDF
This slide illustrates facts and figures related to CSR performance of a corporation. It includes community investment, water recycling, recruiting local employees etc. Presenting CSR Performance Report Insights And Stats Diagrams PDF to dispense important information. This template comprises six stages. It also presents valuable insights into the topics including Evaluation, Employees, Renewable Resources. This is a completely customizable PowerPoint theme that can be put to use immediately. So, download it and address the topic impactfully.
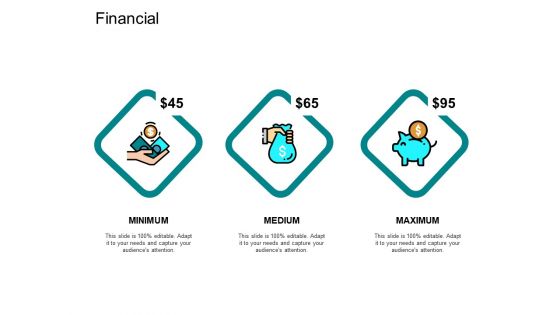
Financial Minimum Maximum Medium Ppt PowerPoint Presentation Portfolio Diagrams
Presenting this set of slides with name financial minimum maximum medium ppt powerpoint presentation portfolio diagrams. This is a three stage process. The stages in this process are financial, minimum, maximum, marketing, strategy. This is a completely editable PowerPoint presentation and is available for immediate download. Download now and impress your audience.
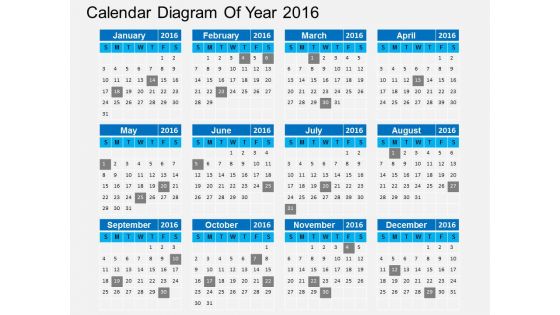
Calendar Diagram Of Year 2016 Powerpoint Templates
This business slide has been designed with calendar diagram of year 2016. This calendar diagram may be used to present concepts of planning events and agenda. Build a quality presentation for your viewers with this unique diagram.

Our Product Vs Competition Analysis Powerpoint Slide Themes
This is a our product vs competition analysis powerpoint slide themes. This is a four stage process. The stages in this process are business, marketing, management, table.
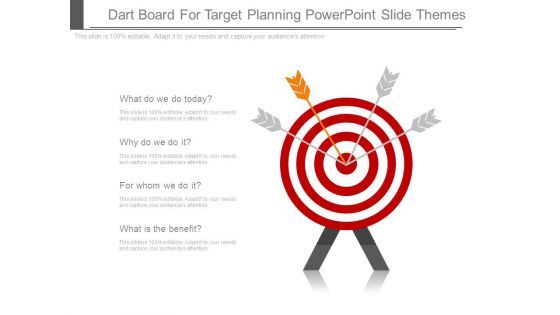
Dart Board For Target Planning Powerpoint Slide Themes
This is a dart board for target planning powerpoint slide themes. This is a four stage process. The stages in this process are business, marketing, goal, target, success.

Smart Action Plan Ppt PowerPoint Presentation Styles Themes
This is a smart action plan ppt powerpoint presentation styles themes. This is a five stage process. The stages in this activity, week, management, strategy, marketing.

Statistical Analysis Slide Ppt PowerPoint Presentation Outline Themes
This is a statistical analysis slide ppt powerpoint presentation outline themes. This is a five stage process. The stages in this process are business, management, marketing.
Promotion Product Ppt PowerPoint Presentation Inspiration Themes Cpb
This is a promotion product ppt powerpoint presentation inspiration themes cpb. This is a three stage process. The stages in this process are promotion product.

 Home
Home