Two Phases

donut pie chart ppt powerpoint presentation file skills
This is a donut pie chart ppt powerpoint presentation file skills. This is a five stage process. The stages in this process are donut pie chart, finance, marketing, strategy, business.
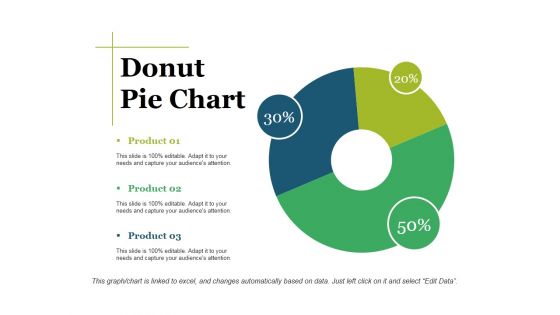
Donut Pie Chart Ppt PowerPoint Presentation Show Graphic Tips
This is a donut pie chart ppt powerpoint presentation show graphic tips. This is a three stage process. The stages in this process are donut pie chart, finance, marketing, strategy, analysis, business.
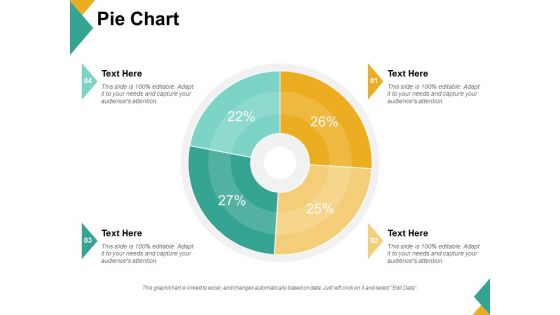
Pie Chart Ppt PowerPoint Presentation Infographic Template Graphics Example
This is a pie chart ppt powerpoint presentation infographic template graphics example. This is a four stage process. The stages in this process are pie chart, finance, marketing, strategy, business.
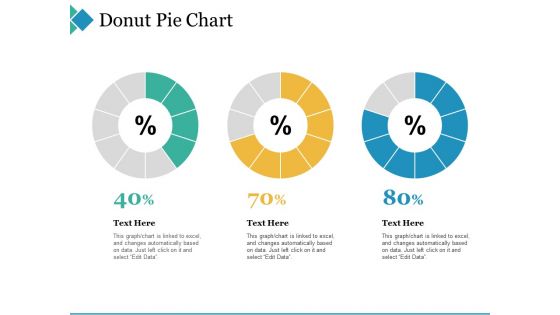
Donut Pie Chart Ppt PowerPoint Presentation Infographic Template Example 2015
This is a donut pie chart ppt powerpoint presentation infographic template example 2015. This is a three stage process. The stages in this process are donut pie chart, finance, marketing, strategy, business.

Donut Pie Chart Ppt PowerPoint Presentation Portfolio Example Topics
This is a donut pie chart ppt powerpoint presentation portfolio example topics. This is a four stage process. The stages in this process are donut pie chart, strategy, business, marketing, finance.

Fixed Assets Classification Diagram Powerpoint Slide Backgrounds
This is a fixed assets classification diagram powerpoint slide backgrounds. This is a four stage process. The stages in this process are current book value by asset type, original cost by asset type, asset count by asset type, current value by department.
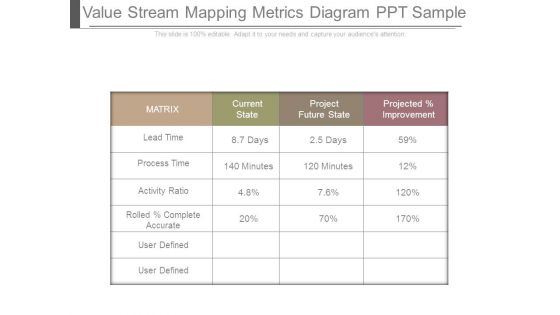
Value Stream Mapping Metrics Diagram Ppt Sample
This is a value stream mapping metrics diagram ppt sample. This is a four stage process. The stages in this process are matrix, current state, project future state, projected improvement, lead time, days, process time, activity ratio, rolled complete accurate, user defined, minutes.

Service Level Objectives Escalation Matrix Ppt PowerPoint Presentation File Diagrams PDF
This slide illustrates service level objectives SLO escalation matrix. It provides information about priority, response SLO, resolution SLO, escalation time, mitigation, tier 1, tier 2 and tier 3. Slidegeeks is here to make your presentations a breeze with Service Level Objectives Escalation Matrix Ppt PowerPoint Presentation File Diagrams PDF With our easy to use and customizable templates, you can focus on delivering your ideas rather than worrying about formatting. With a variety of designs to choose from, you are sure to find one that suits your needs. And with animations and unique photos, illustrations, and fonts, you can make your presentation pop. So whether you are giving a sales pitch or presenting to the board, make sure to check out Slidegeeks first.
Icon Depicting Business Model Of Drops Hipping Order Fulfilment Model Diagrams PDF
Persuade your audience using this Icon Depicting Business Model Of Drops Hipping Order Fulfilment Model Diagrams PDF. This PPT design covers Three stages, thus making it a great tool to use. It also caters to a variety of topics including Depicting Business, Model Of Drops, Hipping Order Fulfilment Model. Download this PPT design now to present a convincing pitch that not only emphasizes the topic but also showcases your presentation skills.
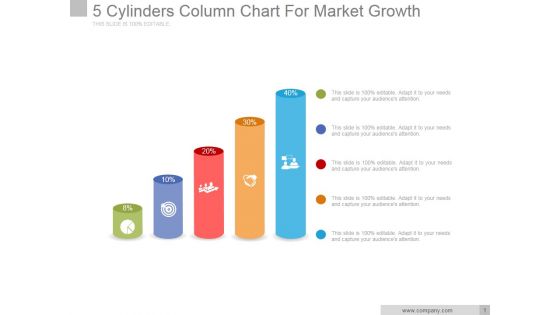
5 Cylinders Column Chart For Market Growth Ppt PowerPoint Presentation Outline
This is a 5 cylinders column chart for market growth ppt powerpoint presentation outline. This is a five stage process. The stages in this process are business, marketing, icons, growth, finance.
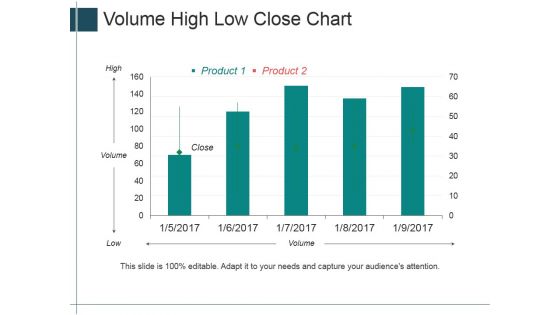
Volume High Low Close Chart Ppt PowerPoint Presentation Summary Layout Ideas
This is a volume high low close chart ppt powerpoint presentation summary layout ideas. This is a five stage process. The stages in this process are high, volume, low, close, product.
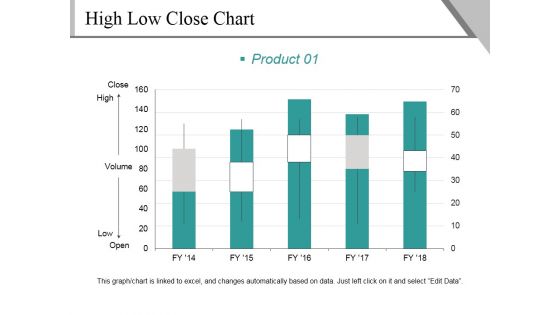
High Low Close Chart Template 1 Ppt PowerPoint Presentation Infographics Graphics Design
This is a high low close chart template 1 ppt powerpoint presentation infographics graphics design. This is a five stage process. The stages in this process are close, high, volume, low, open, product.

Volume Open High Low Close Chart Ppt PowerPoint Presentation Model Inspiration
This is a volume open high low close chart ppt powerpoint presentation model inspiration. This is a three stage process. The stages in this process are business, management, strategy, marketing, sales.

3D Bar Chart For Percentage Values Comparison Ppt PowerPoint Presentation Professional Visual Aids
This is a 3d bar chart for percentage values comparison ppt powerpoint presentation professional visual aids. This is a five stage process. The stages in this process are art, colouring, paint brush.
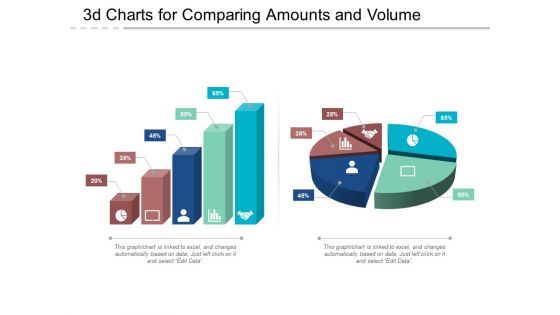
3D Charts For Comparing Amounts And Volume Ppt PowerPoint Presentation Show Deck
This is a 3d charts for comparing amounts and volume ppt powerpoint presentation show deck. This is a five stage process. The stages in this process are art, colouring, paint brush.

Data Comparison And Analysis Chart Ppt Powerpoint Presentation File Background Images
This is a data comparison and analysis chart ppt powerpoint presentation file background images. This is a four stage process. The stages in this process are data presentation, content presentation, information presentation.

Bar Chart With Magnifying Glass For Financial Analysis Ppt Powerpoint Presentation Infographics Designs Download
This is a bar chart with magnifying glass for financial analysis ppt powerpoint presentation infographics designs download. This is a three stage process. The stages in this process are business metrics, business kpi, business dashboard.
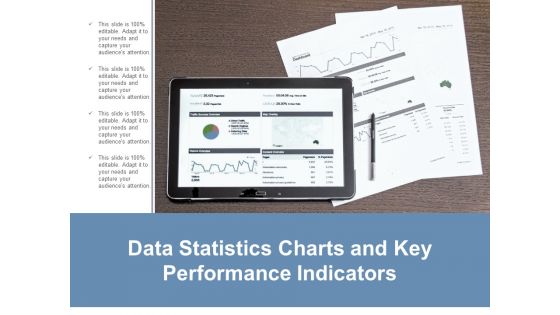
Data Statistics Charts And Key Performance Indicators Ppt Powerpoint Presentation Layouts Guide
This is a data statistics charts and key performance indicators ppt powerpoint presentation layouts guide. This is a four stage process. The stages in this process are business metrics, business kpi, business dashboard.

Financial Charts And Graphs For Statistical Analysis Ppt Powerpoint Presentation Show Layout
This is a financial charts and graphs for statistical analysis ppt powerpoint presentation show layout. This is a four stage process. The stages in this process are business metrics, business kpi, business dashboard.
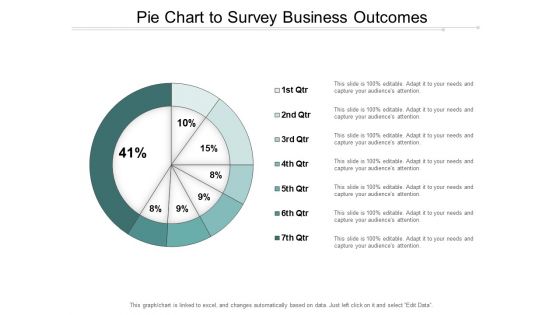
Pie Chart To Survey Business Outcomes Ppt Powerpoint Presentation Infographic Template Gridlines
This is a pie chart to survey business outcomes ppt powerpoint presentation infographic template gridlines. This is a seven stage process. The stages in this process are business outcomes, business results, business output.

Monthly Timeline Gantt Chart With Task Names Ppt PowerPoint Presentation File Ideas
This is a monthly timeline gantt chart with task names ppt powerpoint presentation file ideas. This is a twelve stage process. The stages in this process are agenda, schedule, timetable.
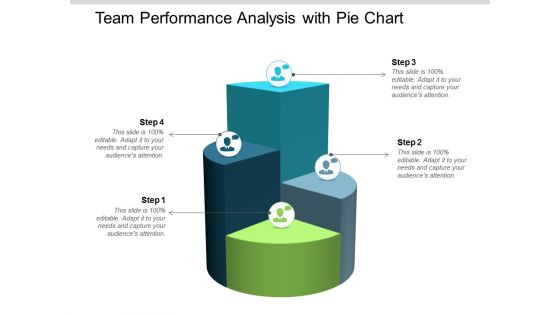
Team Performance Analysis With Pie Chart Ppt Powerpoint Presentation Infographic Template Slideshow
This is a team performance analysis with pie chart ppt powerpoint presentation infographic template slideshow. This is a four stage process. The stages in this process are team performance, member performance, group performance.

Tablet With Bar Graph And Pie Chart Powerpoint Templates
This business slide has been designed with business graphs on computer tablet. You may download this PPT slide to display statistical analysis. This slide will help you to sequence your thoughts.

Combo Chart Bar Ppt PowerPoint Presentation Slides Portfolio
This is a company growth strategy ppt powerpoint presentation professional slides. This is a three stage process. The stages in this process are finance, marketing, analysis, investment, million.
Four Circles With Social Communication Icons Powerpoint Slides
Concept of social communication can be well explained with this power point template. This PPT slide contains the four circles with communication icons. Use this diagram slide to make impressive presentations.
Text Tags And Icons With Percentage Values Powerpoint Slides
This PowerPoint template has been designed with graphics of text tags, icons and percentage values. Download this business diagram to outline business plan. Present your views and ideas with this impressive design.
Four Tags About Us Slide With Icons Powerpoint Slides
Concept of global business strategy can be well explained with this power point template. This PPT slide contains the four tags with business icons. Use this PowerPoint diagram slide to make impressive presentations.

Process Flow Of Configuration Services Management Chart Ppt PowerPoint Presentation Portfolio Information PDF
Presenting process flow of configuration services management chart ppt powerpoint presentation portfolio information pdf. to dispense important information. This template comprises five stages. It also presents valuable insights into the topics including configuration management and planning, configuration identification, configuration control configuration status accounting and reporting, configuration verification and audit. This is a completely customizable PowerPoint theme that can be put to use immediately. So, download it and address the topic impactfully.
Services Marketing Sales What Business Challenges Are Faced By Prospect Ppt Icon Diagrams PDF
This slide caters details about key business challenges are faced by prospects in context to services such as high IT cost, poor business agility, regulatory compliances, etc. This is a services marketing sales what business challenges are faced by prospect ppt icon diagrams pdf template with various stages. Focus and dispense information on five stages using this creative set, that comes with editable features. It contains large content boxes to add your information on topics like humongous it cost, infrastructure silos, security threats, regulatory compliances, poor business agility. You can also showcase facts, figures, and other relevant content using this PPT layout. Grab it now.

Volume High Low Close Chart Ppt PowerPoint Presentation Show
This is a volume high low close chart ppt powerpoint presentation show. This is a five stage process. The stages in this process are high, volume, low.

Stock Chart Ppt PowerPoint Presentation Inspiration Graphics Design
This is a stock chart ppt powerpoint presentation inspiration graphics design. This is a five stage process. The stages in this process are high, volume, low.
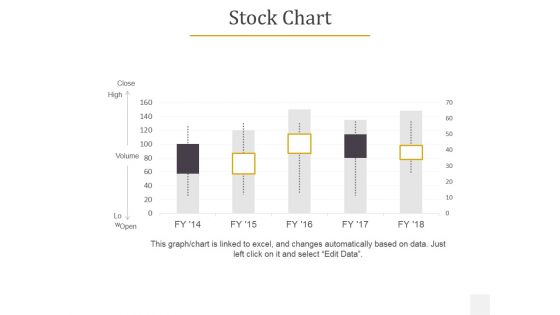
Stock Chart Ppt PowerPoint Presentation Visual Aids Summary
This is a stock chart ppt powerpoint presentation visual aids summary. This is a five stage process. The stages in this process are close, high, volume, open.
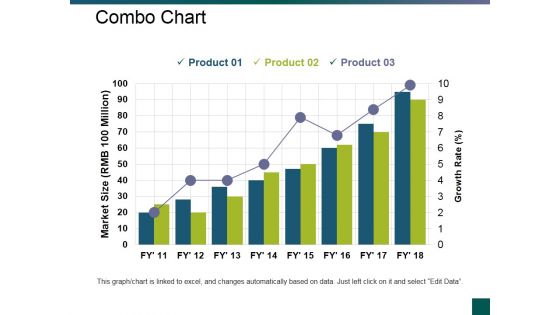
Combo Chart Ppt PowerPoint Presentation Styles Example File
This is a combo chart ppt powerpoint presentation styles example file. This is a three stage process. The stages in this process are finance, growth, business, analysis, marketing.
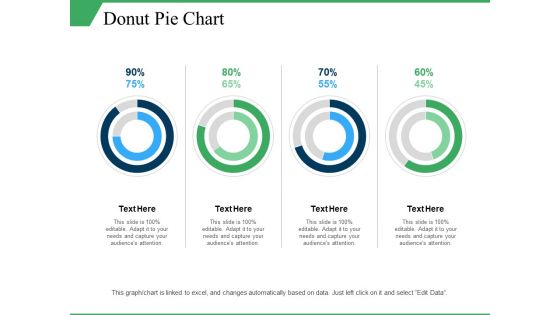
Donut Pie Chart Ppt PowerPoint Presentation Layouts Information
This is a donut pie chart ppt powerpoint presentation layouts information. This is a four stage process. The stages in this process are percentage, finance, donut, business, marketing.
Job Profile In Curriculum Vitae Icon Ppt PowerPoint Presentation Professional Microsoft
Presenting this set of slides with name job profile in curriculum vitae icon ppt powerpoint presentation professional microsoft. This is a one stage process. The stages in this process are role description icon, role description steps, corporate relationship. This is a completely editable PowerPoint presentation and is available for immediate download. Download now and impress your audience.
Dollar Icon Illustrating Product Pricing Vector Icon Ppt PowerPoint Presentation Gallery Graphics Design PDF
Presenting dollar icon illustrating product pricing vector icon ppt powerpoint presentation gallery graphics design pdf to dispense important information. This template comprises three stages. It also presents valuable insights into the topics including dollar icon illustrating product pricing vector icon. This is a completely customizable PowerPoint theme that can be put to use immediately. So, download it and address the topic impactfully.
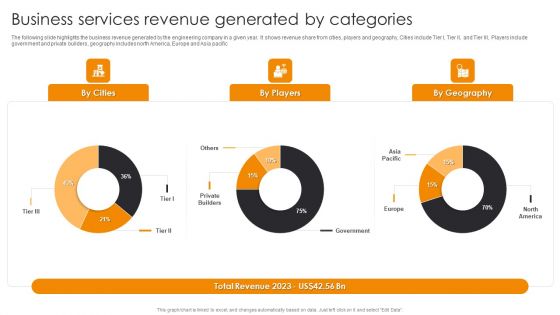
Business Services Revenue Generated By Categories Engineering Company Financial Analysis Report Graphics PDF
The following slide highlights the business revenue generated by the engineering company in a given year. It shows revenue share from cities, players and geography, Cities include Tier I, Tier II, and Tier III, Players include government and private builders, geography includes north America, Europe and Asia pacific.If you are looking for a format to display your unique thoughts, then the professionally designed Business Services Revenue Generated By Categories Engineering Company Financial Analysis Report Graphics PDF is the one for you. You can use it as a Google Slides template or a PowerPoint template. Incorporate impressive visuals, symbols, images, and other charts. Modify or reorganize the text boxes as you desire. Experiment with shade schemes and font pairings. Alter, share or cooperate with other people on your work. Download Business Services Revenue Generated By Categories Engineering Company Financial Analysis Report Graphics PDF and find out how to give a successful presentation. Present a perfect display to your team and make your presentation unforgettable.
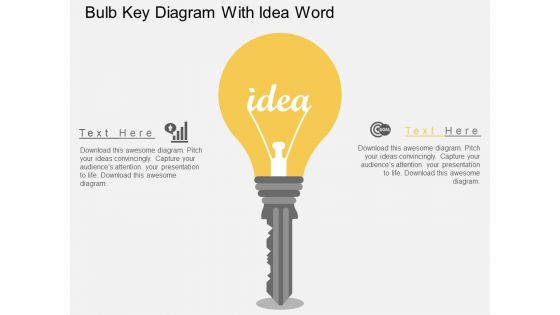
Bulb Key Diagram With Idea Word Powerpoint Templates
Our above business slide has been designed with bulb key diagram with idea word. This slide is suitable to present key concept of business. Use this business diagram to present your work in a more smart and precise manner.
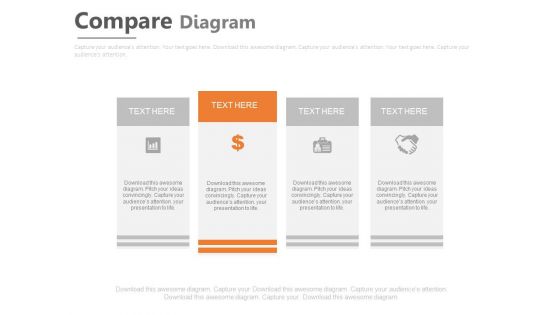
Compare Diagram For Dollar Growth And Analysis Powerpoint Slides
Another appropriate slide to show the comparison. Here is the PowerPoint slide in the form of the four bookmarks where you can easily show the contrast between four products, four market share, and much more. One thing which needs to be noticed is that it has highlighted book mark also to show that it is the leading one among all. It is superior to all. So this slide is the perfect blend to show the comparison, analysis and growth. Icon here too are editable. You can choose the color of your choice. Use this slide and make your point more understandable graphically.
Inculcating Supplier Operation Improvement Plan Classification Of Supplier Based On Performance Icons PDF
This slide explains suppliers classification into defined groups based on their score. It indicates that vendor 1 will get placed into group A and vendor 2 into group B. Deliver and pitch your topic in the best possible manner with this inculcating supplier operation improvement plan classification of supplier based on performance icons pdf. Use them to share invaluable insights on outstanding performance, average performance, re qualification required, satisfactory performance and impress your audience. This template can be altered and modified as per your expectations. So, grab it now.
Payback With Dollar Symbol Vector Icon Ppt PowerPoint Presentation Inspiration Icon PDF
Presenting payback with dollar symbol vector icon ppt powerpoint presentation inspiration icon pdf to dispense important information. This template comprises three stages. It also presents valuable insights into the topics including payback with dollar symbol vector icon. This is a completely customizable PowerPoint theme that can be put to use immediately. So, download it and address the topic impactfully.
Vendor Assessment To Reduce Purchasing Risk Vector Icon Ppt Icon Template PDF
Presenting vendor assessment to reduce purchasing risk vector icon ppt icon template pdf. to dispense important information. This template comprises three stages. It also presents valuable insights into the topics including vendor assessment to reduce purchasing risk vector icon. This is a completely customizable PowerPoint theme that can be put to use immediately. So, download it and address the topic impactfully.
Targeted Audience For Niche Advertising Icon Ppt PowerPoint Presentation Icon Summary PDF
Presenting Targeted Audience For Niche Advertising Icon Ppt PowerPoint Presentation Icon Summary PDF to dispense important information. This template comprises three stages. It also presents valuable insights into the topics including Targeted Audience For Niche, Advertising Icon. This is a completely customizable PowerPoint theme that can be put to use immediately. So, download it and address the topic impactfully.

Competitive Analysis Template 6 Scatter Chart Ppt PowerPoint Presentation Slides
This is a competitive analysis template 6 scatter chart ppt powerpoint presentation slides. This is a eight stage process. The stages in this process are users interface, data import, example, pricing, support, update, tutorials, easy to use, table.
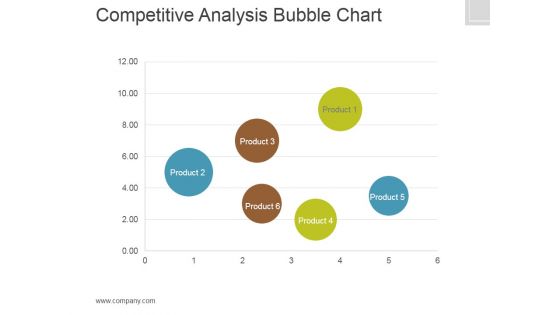
Competitive Analysis Template 7 Bubble Chart Ppt PowerPoint Presentation Deck
This is a competitive analysis template 7 bubble chart ppt powerpoint presentation deck. This is a six stage process. The stages in this process are users interface, data import, example, pricing, support, update, tutorials, easy to use, table.

Volume Open High Low Close Chart Ppt PowerPoint Presentation Sample
This is a volume open high low close chart ppt powerpoint presentation sample. This is a five stage process. The stages in this process are close, volume, high, low, open.

Open High Low Close Chart Ppt PowerPoint Presentation Information
This is a open high low close chart ppt powerpoint presentation information. This is a five stage process. The stages in this process are product, in percentage, close, low, high.

Clustered Column Line Chart Ppt PowerPoint Presentation File Pictures
This is a clustered column line chart ppt powerpoint presentation file pictures. This is a four stage process. The stages in this process are clustered bar, product, planning, business, sales in percentage.
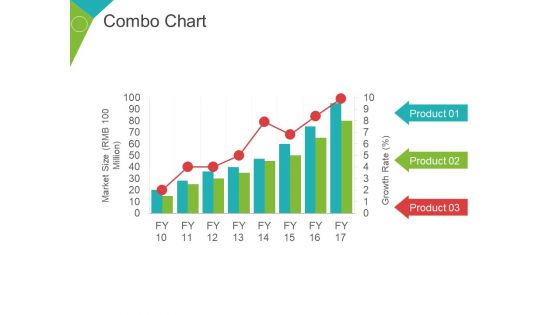
Combo Chart Ppt PowerPoint Presentation Infographic Template Graphic Images
This is a combo chart ppt powerpoint presentation infographic template graphic images. This is a three stage process. The stages in this process are market size, growth rate, percentage, business, marketing.

Scatter Chart Template 3 Ppt PowerPoint Presentation Styles Demonstration
This is a scatter chart template 3 ppt powerpoint presentation styles demonstration. This is a one stage process. The stages in this process are sales in percentage, finance, business, marketing, growth.

Integrating Data Privacy System Training Schedule For Data Privacy Ppt Diagram Images PDF
This slide represents the data privacy training program by covering the details of topics such as benefits and laws and duration for each topic to be covered. Retrieve professionally designed Integrating Data Privacy System Track Record Of Our Company Ppt Gallery Images PDF to effectively convey your message and captivate your listeners. Save time by selecting pre-made slideshows that are appropriate for various topics, from business to educational purposes. These themes come in many different styles, from creative to corporate, and all of them are easily adjustable and can be edited quickly. Access them as PowerPoint templates or as Google Slides themes. You dont have to go on a hunt for the perfect presentation because Slidegeeks got you covered from everywhere.
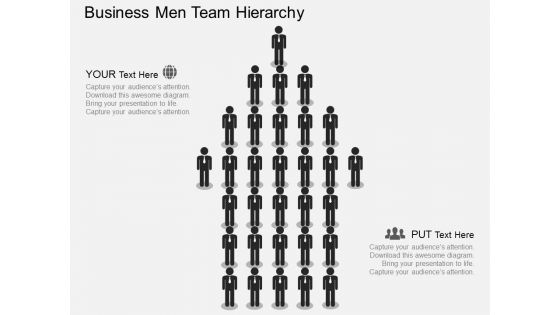
Business Men Team Hierarchy Powerpoint Template
This PowerPoint template contains icons of business men. Download this diagram slide to display team hierarchy. This diagram is editable you can edit text, color, shade and style as per you need.
Four Goal Setting Techniques With Icons Ppt PowerPoint Presentation Model Graphics
Presenting this set of slides with name four goal setting techniques with icons ppt powerpoint presentation model graphics. This is a four stage process. The stages in this process are steps target, financial goals, effective goal. This is a completely editable PowerPoint presentation and is available for immediate download. Download now and impress your audience.
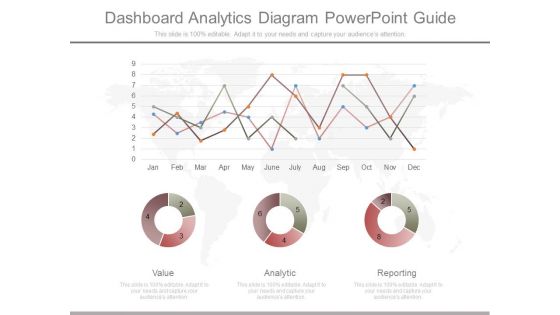
Dashboard Analytics Diagram Powerpoint Guide
This is a dashboard analytics diagram powerpoint guide. This is a three stage process. The stages in this process are value, analytic, reporting.
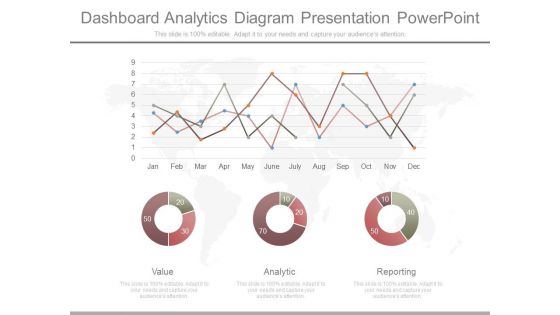
Dashboard Analytics Diagram Presentation Powerpoint
This is a dashboard analytics diagram presentation powerpoint. This is a three stage process. The stages in this process are value, analytic, reporting.
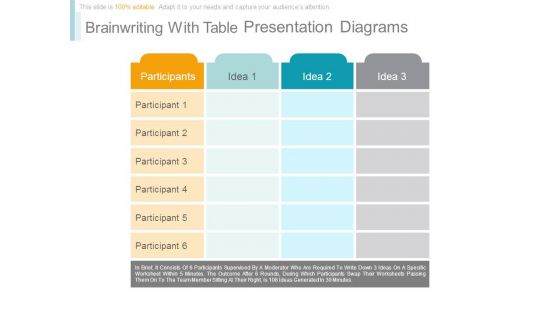
Brainwriting With Table Presentation Diagrams
This is a brainwriting with table presentation diagrams. This is a four stage process. The stages in this process are participants, idea.
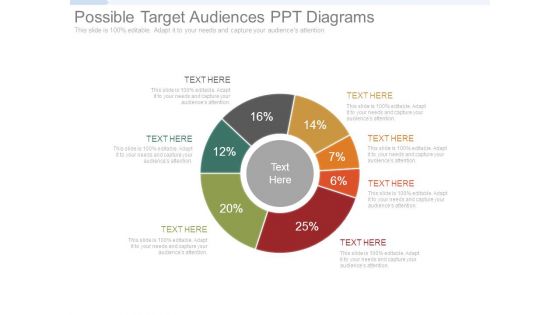
Possible Target Audiences Ppt Diagrams
This is a possible target audiences ppt diagrams. This is a seven stage process. The stages in this process are growth, business, marketing, percentage.
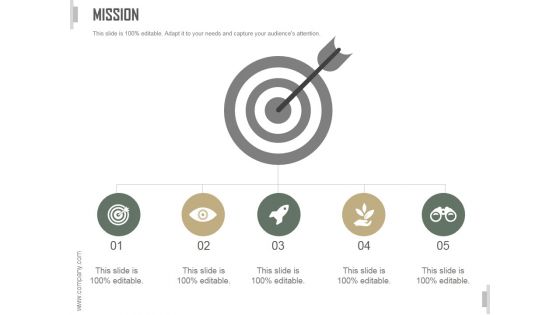
Mission Ppt PowerPoint Presentation Diagrams
This is a mission ppt powerpoint presentation diagrams. This is a five stage process. The stages in this process are business, strategy, marketing, analysis, target, our vision, mission.

Dashboard Ppt PowerPoint Presentation Diagrams
This is a dashboard ppt powerpoint presentation diagrams. This is a four stage process. The stages in this process are performance, energy, speed.

Financial Ppt PowerPoint Presentation Diagrams
This is a financial ppt powerpoint presentation diagrams. This is a four stage process. The stages in this process are finance, business, marketing, business.

 Home
Home