Two Phases
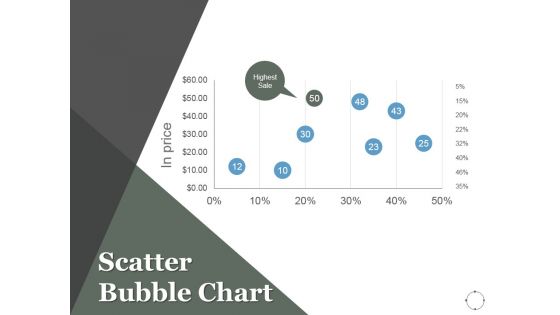
Scatter Bubble Chart Ppt PowerPoint Presentation Background Designs
This is a scatter bubble chart ppt powerpoint presentation background designs. This is a eight stage process. The stages in this process are projects, marketing, scatter chart, finance, management.

Stock Chart Ppt PowerPoint Presentation Slides Example File
This is a stock chart ppt powerpoint presentation slides example file. This is a five stage process. The stages in this process are business, finance, stock chart, management, planning.
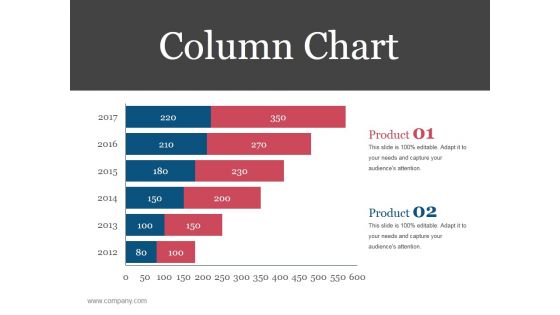
Column Chart Ppt PowerPoint Presentation Ideas Designs Download
This is a column chart ppt powerpoint presentation ideas designs download. This is a six stage process. The stages in this process are business, strategy, analysis, planning, column chart, financial.

Line Chart Ppt PowerPoint Presentation Visual Aids Pictures
This is a line chart ppt powerpoint presentation visual aids pictures. This is a three stage process. The stages in this process are business, marketing, line chart, analysis, growth.

Bar Chart Ppt PowerPoint Presentation Slides Design Ideas
This is a bar chart ppt powerpoint presentation slides design ideas. This is a six stage process. The stages in this process are product, bar chart, sales in percentage.

Column Chart Ppt PowerPoint Presentation Infographic Template Graphics Tutorials
This is a column chart ppt powerpoint presentation infographic template graphics tutorials. This is a twelve stage process. The stages in this process are column chart, finance, marketing, strategy, investment, business.

Scatter Bubble Chart Ppt PowerPoint Presentation Outline Rules
This is a scatter bubble chart ppt powerpoint presentation outline rules. This is a three stage process. The stages in this process are scatter bubble chart, product, finance, marketing, business.

Bar Chart Ppt PowerPoint Presentation Professional Graphics Download
This is a bar chart ppt powerpoint presentation professional graphics download. This is a seven stage process. The stages in this process are sales in percentage, financial years, chart, business.
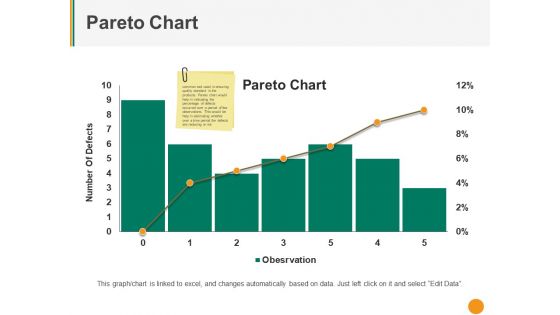
Pareto Chart Ppt PowerPoint Presentation Inspiration Master Slide
This is a pareto chart ppt powerpoint presentation inspiration master slide. This is a six stage process. The stages in this process are number of defects, pareto chart, finance, business, graph.

Scatter Bubble Chart Ppt PowerPoint Presentation Ideas Design Templates
This is a scatter bubble chart ppt powerpoint presentation ideas design templates. This is a three stage process. The stages in this process are product, scatter, bubble chart, business, marketing.

Stock Chart Ppt PowerPoint Presentation Slides Designs Download
This is a stock chart ppt powerpoint presentation slides designs download. This is a five stage process. The stages in this process are high, volume, low, close, stock chart.

Combo Chart Ppt PowerPoint Presentation Slides Background Image
This is a combo chart ppt powerpoint presentation slides background image. This is a three stage process. The stages in this process are business, finance, planning, combo chart, investment.
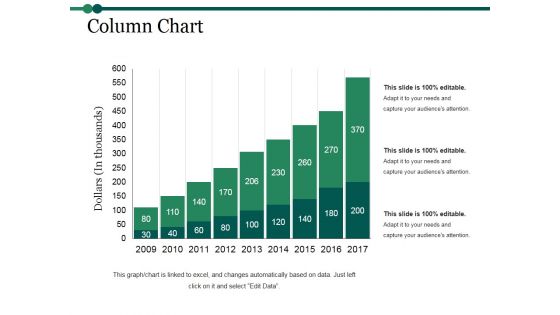
Column Chart Ppt PowerPoint Presentation Inspiration Graphics Example
This is a column chart ppt powerpoint presentation inspiration graphics example. This is a nine stage process. The stages in this process are column chart, finance, marketing, strategy, analysis, business.
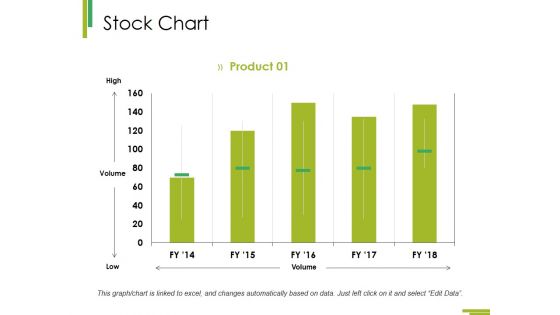
Stock Chart Ppt PowerPoint Presentation Summary Format Ideas
This is a stock chart ppt powerpoint presentation summary format ideas. This is a one stage process. The stages in this process are stock chart, finance, business, analysis, marketing.
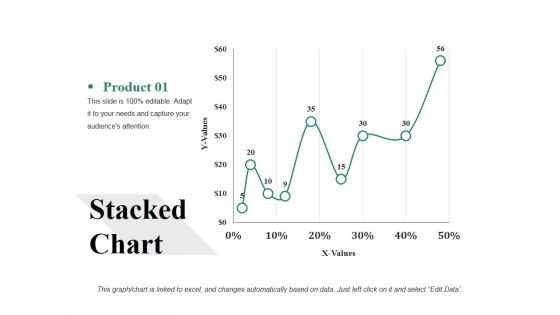
Stacked Chart Ppt PowerPoint Presentation Gallery Infographic Template
This is a stacked chart ppt powerpoint presentation gallery infographic template. This is a one stage process. The stages in this process are stacked chart, finance, analysis, marketing, business.

Combo Chart Ppt PowerPoint Presentation Infographic Template Visuals
This is a combo chart ppt powerpoint presentation infographic template visuals. This is a three stage process. The stages in this process are business, finance, strategy, analysis, combo chart.
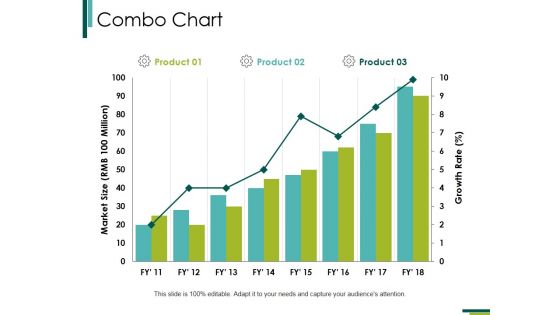
Combo Chart Ppt PowerPoint Presentation Infographic Template Slide Portrait
This is a combo chart ppt powerpoint presentation infographic template slide portrait. This is a three stage process. The stages in this process are combo chart, finance, marketing, strategy, business, growth.

Combo Chart Ppt PowerPoint Presentation Gallery Graphics Tutorials
This is a Combo Chart Ppt PowerPoint Presentation Gallery Graphics Tutorials. This is a three stage process. The stages in this process are combo chart, finance, marketing, strategy, analysis.
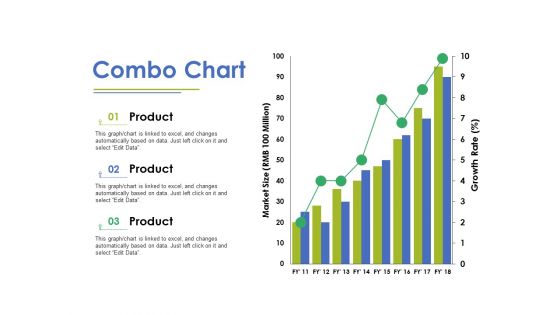
Combo Chart Ppt PowerPoint Presentation Layouts Background Image
This is a combo chart ppt powerpoint presentation layouts background image. This is a three stage process. The stages in this process are bar chart, marketing, strategy, finance, planning.
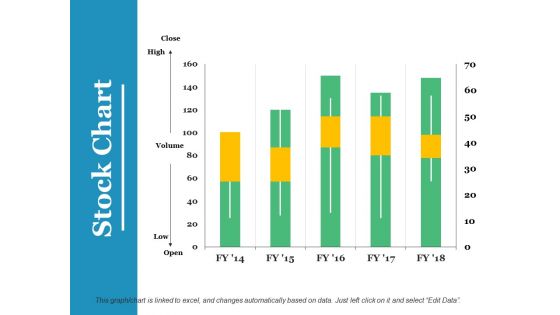
Stock Chart Ppt PowerPoint Presentation Infographics Graphics Example
This is a stock chart ppt powerpoint presentation infographics graphics example. This is a five stage process. The stages in this process are stock chart, finance, business, planning, marketing.

Column Chart Business Analysis Ppt PowerPoint Presentation Outline Example Introduction
This is a column chart business analysis ppt powerpoint presentation outline example introduction. This is a three stage process. The stages in this process are column chart, finance, marketing, management, investment.
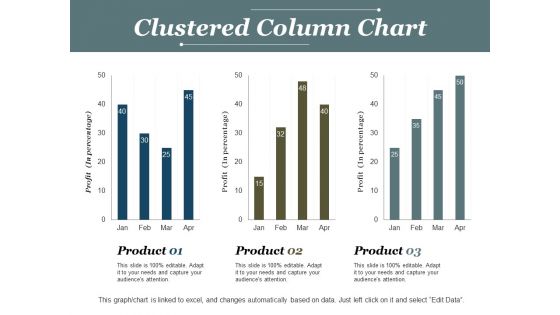
Clustered Column Chart Ppt PowerPoint Presentation Model Deck
This is a clustered column chart ppt powerpoint presentation model deck. This is a three stage process. The stages in this process are clustered column chart, product, finance, profit, business.

Bank Offerings Analysis Chart Ppt PowerPoint Presentation Slides Show
This is a bank offerings analysis chart ppt powerpoint presentation slides show. This is a five stage process. The stages in this process are comparison chart, comparison table, comparison matrix.

Customer Analysis Percentage Chart Ppt PowerPoint Presentation Infographics Master Slide
This is a customer analysis percentage chart ppt powerpoint presentation infographics master slide. This is a four stage process. The stages in this process are comparison chart, comparison table, comparison matrix.
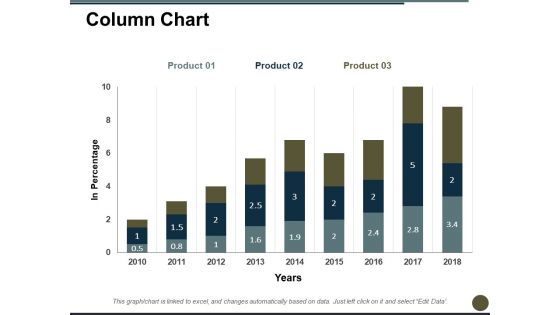
Column Chart Ppt PowerPoint Presentation Layouts File Formats
This is a column chart ppt powerpoint presentation layouts file formats. This is a three stage process. The stages in this process are column chart, product, in percentage, year, finance.
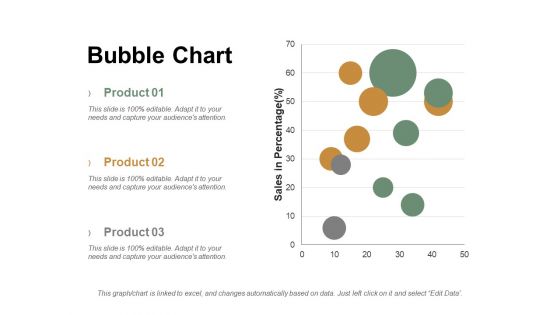
Bubble Chart Ppt PowerPoint Presentation Summary Graphics Tutorials
This is a bubble chart ppt powerpoint presentation summary graphics tutorials. This is a three stage process. The stages in this process are product, sales in percentage, bubble chart.
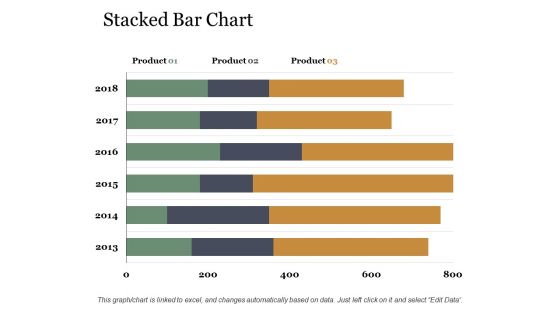
Stacked Bar Chart Ppt PowerPoint Presentation Portfolio Templates
This is a stacked bar chart ppt powerpoint presentation portfolio templates. This is a three stage process. The stages in this process are stacked bar chart, product, year, business, finance.
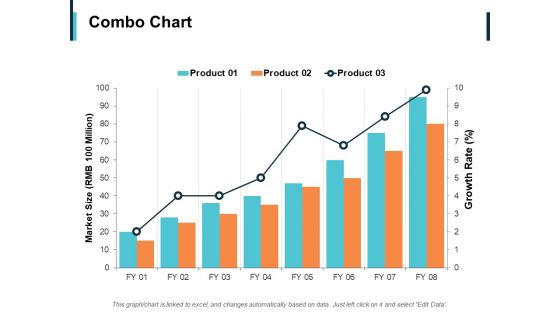
Combo Chart Finance Ppt PowerPoint Presentation Infographic Template Outline
This is a combo chart finance ppt powerpoint presentation infographic template outline. This is a three stage process. The stages in this process are combo chart, finance, analysis, business, investment.

Combo Chart Finance Ppt PowerPoint Presentation Ideas Microsoft
This is a combo chart finance ppt powerpoint presentation ideas microsoft. This is a three stage process. The stages in this process are combo chart, Finance, Analysis, Business, Investment.
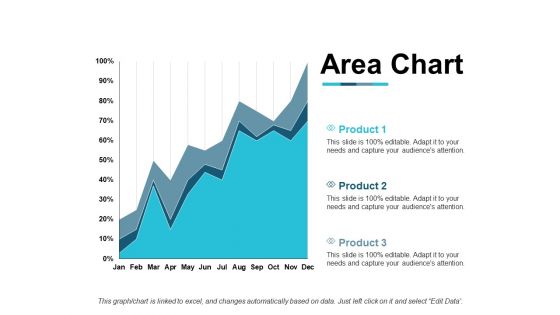
Area Chart Investment Ppt PowerPoint Presentation Styles Topics
This is a area chart investment ppt powerpoint presentation styles topics. This is a three stage process. The stages in this process are area chart, finance, marketing, analysis, investment.

Clustered Bar Financial Chart Ppt PowerPoint Presentation File Design Ideas
This is a clustered bar financial chart ppt powerpoint presentation file design ideas. This is a three stage process. The stages in this process are column chart, financial, business, marketing, planning, strategy.

Pie Chart Finance Ppt Powerpoint Presentation Infographic Template Clipart
This is a pie chart finance ppt powerpoint presentation infographic template clipart. This is a three stage process. The stages in this process are pie chart, finance, marketing, business, analysis.

Area Chart Finance Ppt PowerPoint Presentation Outline Brochure
This is a area chart finance ppt powerpoint presentation outline brochure. This is a four stage process. The stages in this process are area chart, finance, marketing, analysis, investment.
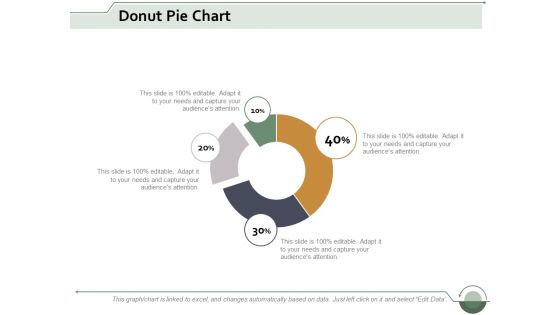
donut pie chart investment ppt powerpoint presentation show guide
This is a donut pie chart investment ppt powerpoint presentation show guide. This is a four stage process. The stages in this process are donut pie chart, finance, marketing, business, analysis.

Area Chart Finance Ppt Powerpoint Presentation Slides Picture
This is a area chart finance ppt powerpoint presentation slides picture. This is a three stage process. The stages in this process are area chart, finance, marketing, management, investment.
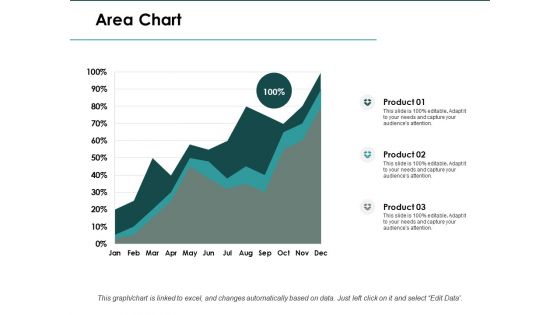
Area Chart Finance Ppt PowerPoint Presentation Infographics Slide
This is a area chart finance ppt powerpoint presentation infographics slide. This is a three stage process. The stages in this process are area chart, finance, marketing, analysis, investment.
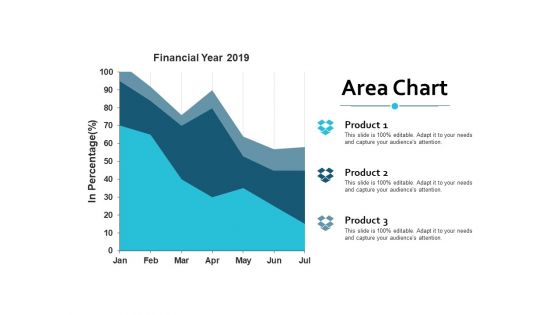
Area Chart Finance Ppt Powerpoint Presentation Inspiration Example
This is a area chart finance ppt powerpoint presentation inspiration example. This is a three stage process. The stages in this process are area chart, finance, marketing, management, investment.

Combo Chart Finance Marketing Ppt Powerpoint Presentation Layouts Inspiration
This is a combo chart finance marketing ppt powerpoint presentation layouts inspiration. This is a three stage process. The stages in this process are combo chart, finance, marketing, management, analysis.

Area Chart Investment Ppt PowerPoint Presentation Gallery Example Introduction
This is a area chart investment ppt powerpoint presentation gallery example introduction. This is a three stage process. The stages in this process are area chart, finance, marketing, management, investment.
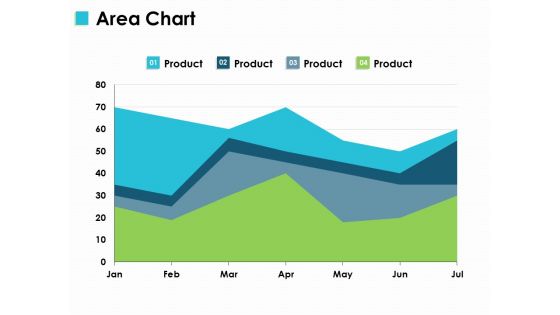
Area Chart Product Percentage Ppt PowerPoint Presentation Infographic Template Slide
This is a area chart product percentage ppt powerpoint presentation infographic template slide. This is a four stage process. The stages in this process are area chart, finance, marketing, management, investment.

Area Chart Percentage Ppt PowerPoint Presentation Portfolio Pictures
This is a area chart percentage ppt powerpoint presentation portfolio pictures. This is a three stage process. The stages in this process are area chart, finance, marketing, management, investment.

Waterfall Chart Indicating Sales Performance Ppt PowerPoint Presentation Outline Templates
This is a waterfall chart indicating sales performance ppt powerpoint presentation outline templates. This is a seven stage process. The stages in this process are sales waterfall, waterfall chart, business.
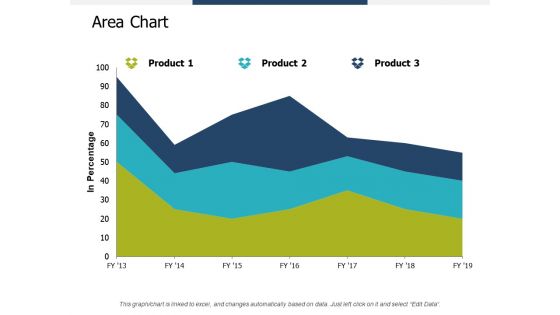
Area Chart Finance Marketing Ppt PowerPoint Presentation Gallery Styles
This is a area chart finance marketing ppt powerpoint presentation gallery styles. This is a three stage process. The stages in this process are area chart, finance, marketing, analysis, investment.

Combo Chart Marketing Ppt Powerpoint Presentation Layouts Designs Download
This is a combo chart marketing ppt powerpoint presentation layouts designs download. This is a three stage process. The stages in this process are combo chart, marketing, growth, product, finance.
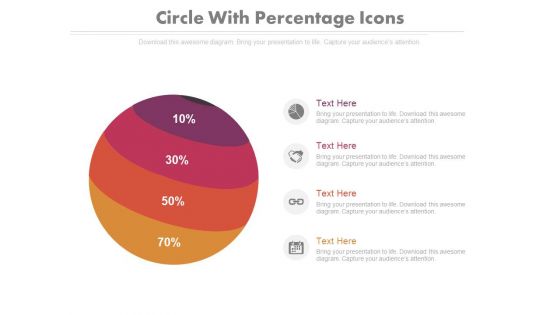
Four Parts Circle Chart With Percentage Ratio Powerpoint Slides
This PowerPoint template contains four parts circle chart with percentage ratio. You may download this PPT slide design to display your ideas in visual manner. You can easily customize this template to make it more unique as per your need.

Team Profile Tags Introduction Diagram Powerpoint Slides
This PPT slide contains graphics of team profile tags. You may use this PowerPoint template for introduction of your team. Download this team introduction slide design to deliver amazing presentations.
Facility Asset Hierarchy Structure Ppt PowerPoint Presentation Icon Infographics PDF
This slide covers asset hierarchy chart of a facility management. It includes division of facility 1 under asset A and B along with subdivisions such as subassembly 1, 2,3 with further divisions into several parts. Persuade your audience using this Facility Asset Hierarchy Structure Ppt PowerPoint Presentation Icon Infographics PDF. This PPT design covers three stages, thus making it a great tool to use. It also caters to a variety of topics including Asset, Facility, Subassembly. Download this PPT design now to present a convincing pitch that not only emphasizes the topic but also showcases your presentation skills.
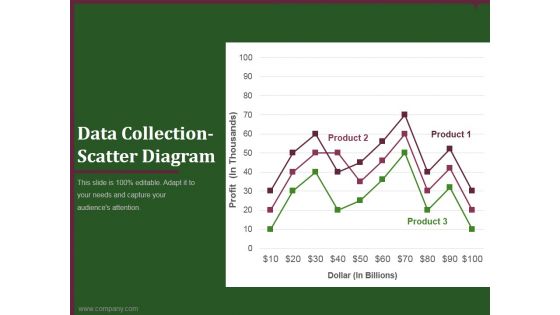
data collection scatter diagram ppt powerpoint presentation inspiration
This is a data collection scatter diagram ppt powerpoint presentation inspiration. This is a three stage process. The stages in this process are business, planning, marketing, scatter diagram, finance.

Scatter Diagram Ppt PowerPoint Presentation Infographic Template Design Ideas
This is a scatter diagram ppt powerpoint presentation infographic template design ideas. This is a one stage process. The stages in this process are scatter diagram, finance, in percentage, business, bar graph.
Rebranding Brand Fresh Face Development Case Study Brand Overhaul For Revamped Rebranding Icons PDF
This slide provides information regarding case study showcasing logo rebranding for brand performance management. It includes details about rebranding goal, rebranding initiatives taken, etc. Retrieve professionally designed Rebranding Brand Fresh Face Development Case Study Brand Overhaul For Revamped Rebranding Icons PDF to effectively convey your message and captivate your listeners. Save time by selecting pre-made slideshows that are appropriate for various topics, from business to educational purposes. These themes come in many different styles, from creative to corporate, and all of them are easily adjustable and can be edited quickly. Access them as PowerPoint templates or as Google Slides themes. You dont have to go on a hunt for the perfect presentation because Slidegeeks got you covered from everywhere.
IOS Application Development Pros And Cons For Native Mobile App Development Icons PDF
This slide highlights the pros and cons for native apps based on UX, overall performance, access, cost effectiveness, etc. Retrieve professionally designed IOS Application Development Pros And Cons For Native Mobile App Development Icons PDF to effectively convey your message and captivate your listeners. Save time by selecting pre made slideshows that are appropriate for various topics, from business to educational purposes. These themes come in many different styles, from creative to corporate, and all of them are easily adjustable and can be edited quickly. Access them as PowerPoint templates or as Google Slides themes. You do not have to go on a hunt for the perfect presentation because Slidegeeks got you covered from everywhere.
Smart Wireless Sensor Networks Spectrum Database Technique For Cognitive Radio Icons PDF
This slide depicts the overview of the spectrum database technique for cognitive radio to simplify the spectrum sensing techniques and better utilize TV white space. It also comprises limitations of spectrum database technique, including significant formed proportion for a short time, and so on. Are you searching for a Smart Wireless Sensor Networks Spectrum Database Technique For Cognitive Radio Icons PDF that is uncluttered, straightforward, and original Its easy to edit, and you can change the colors to suit your personal or business branding. For a presentation that expresses how much effort you have put in, this template is ideal With all of its features, including tables, diagrams, statistics, and lists, its perfect for a business plan presentation. Make your ideas more appealing with these professional slides. Download Smart Wireless Sensor Networks Spectrum Database Technique For Cognitive Radio Icons PDF from Slidegeeks today.
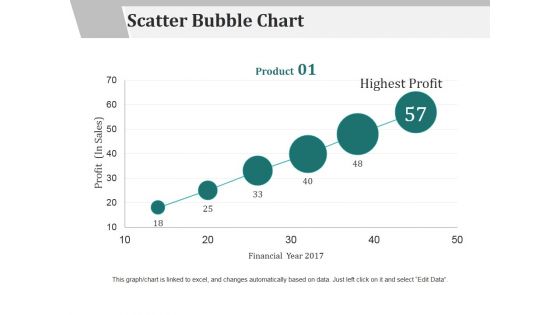
Scatter Bubble Chart Ppt PowerPoint Presentation Professional Skills
This is a scatter bubble chart ppt powerpoint presentation professional skills. This is a six stage process. The stages in this process are financial, marketing, management, strategy, planning.
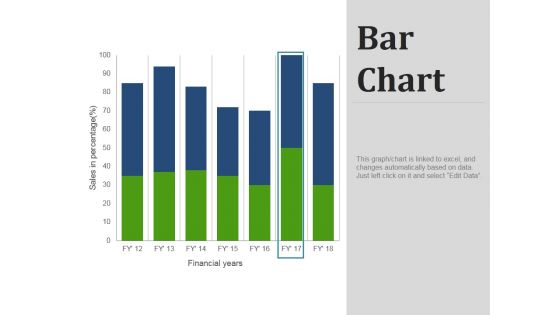
Bar Chart Ppt PowerPoint Presentation Visual Aids Files
This is a bar chart ppt powerpoint presentation visual aids files. This is a seven stage process. The stages in this process are bar, graph, finance, business, marketing.
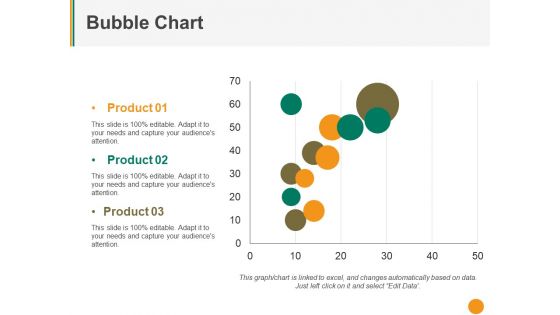
Bubble Chart Ppt PowerPoint Presentation Pictures Slide Download
This is a bubble chart ppt powerpoint presentation pictures slide download. This is a three stage process. The stages in this process are product, business, graph, finance.

Volume High Low Close Chart Ppt Powerpoint Presentation Outline Show
This is a volume high low close chart ppt powerpoint presentation outline show. This is a one stage process. The stages in this process are high, volume, low.

Clustered Bar Chart Ppt PowerPoint Presentation Layouts Infographics
This is a clustered bar chart ppt powerpoint presentation layouts infographics. This is a three stage process. The stages in this process are finance, marketing, management, investment, analysis.
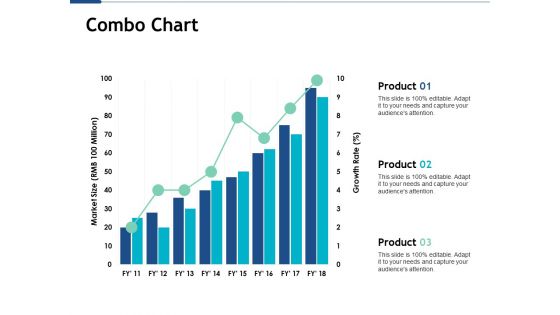
Combo Chart Ppt PowerPoint Presentation Visual Aids Pictures
This is a combo chart ppt powerpoint presentation visual aids pictures. This is a three stage process. The stages in this process are finance, marketing, management, investment, analysis.
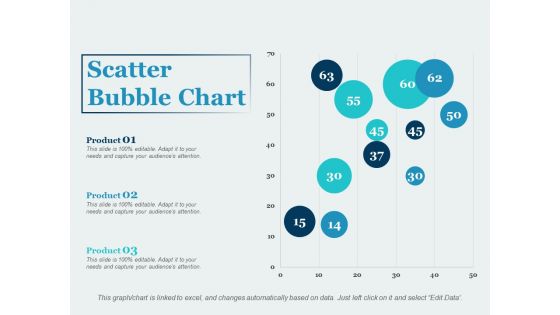
Scatter Bubble Chart Ppt PowerPoint Presentation Outline Demonstration
This is a scatter bubble chart ppt powerpoint presentation outline demonstration. This is a three stage process. The stages in this process are percentage, product, management, marketing, business.
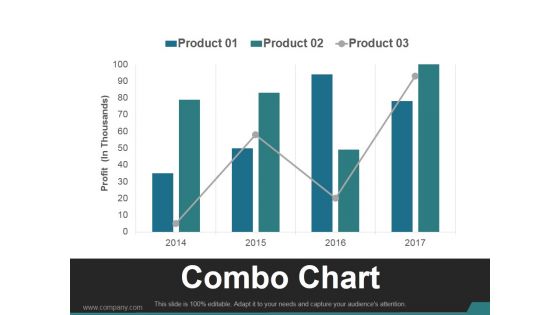
Combo Chart Template 1 Ppt PowerPoint Presentation Inspiration
This is a combo chart template 1 ppt powerpoint presentation inspiration. This is a four stage process. The stages in this process are business, marketing, growth, product, finance.

 Home
Home