Two Phases
Higher Education Fees Expense Budget Plan For Student Icon Diagrams PDF
Presenting Higher Education Fees Expense Budget Plan For Student Icon Diagrams PDF to dispense important information. This template comprises one stage. It also presents valuable insights into the topics including Higher Education, Fees Expense Budget, Plan Student Icon This is a completely customizable PowerPoint theme that can be put to use immediately. So, download it and address the topic impactfully.
Customer Satisfaction Index Strategy Icon To Increase Business Sustainability Initiatives Diagrams PDF
Presenting Customer Satisfaction Index Strategy Icon To Increase Business Sustainability Initiatives Diagrams PDF to dispense important information. This template comprises Three stages. It also presents valuable insights into the topics including Customer Satisfaction, Index Strategy Icon, Increase Business, Sustainability Initiatives. This is a completely customizable PowerPoint theme that can be put to use immediately. So, download it and address the topic impactfully.
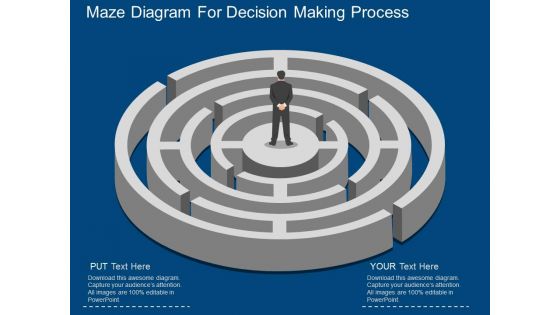
Maze Diagram For Decision Making Process Powerpoint Template
This PowerPoint template has been designed with maze diagram. This maze diagram may be used to display decision making process. Download this slide to build unique and impressive business presentation.
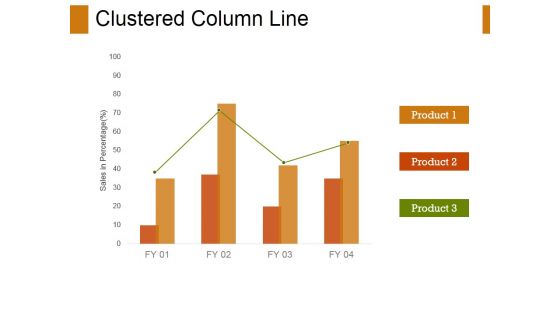
Clustered Column-Line Ppt PowerPoint Presentation Ideas Diagrams
This is a clustered column-line ppt powerpoint presentation ideas diagrams. This is a three stage process. The stages in this process are clustered column line, business, finance, marketing, strategy.

Stock Chart Ppt PowerPoint Presentation Guidelines
This is a stock chart ppt powerpoint presentation guidelines. This is a five stage process. The stages in this process are high, volume, low, close.
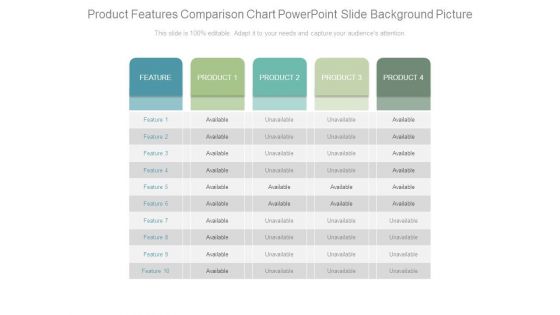
Product Features Comparison Chart Powerpoint Slide Background Picture
This is a product features comparison chart powerpoint slide background picture. This is a four stage process. The stages in this process are feature, product, available, unavailable.

Work Plan Activities Chart Sample Of Ppt Presentation
This is a work plan activities chart sample of ppt presentation. This is a ten stage process. The stages in this process are table, management, business, strategy, presentation.
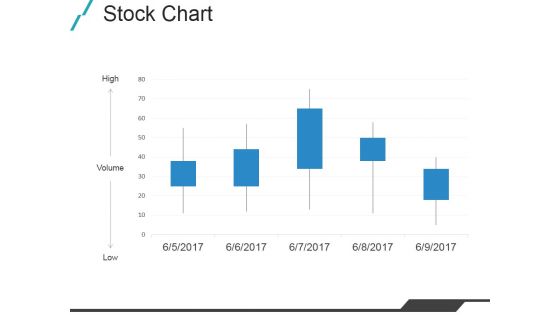
Stock Chart Ppt PowerPoint Presentation Outline Slide Portrait
This is a stock chart ppt powerpoint presentation outline slide portrait. This is a five stage process. The stages in this process are high, volume, low, business.
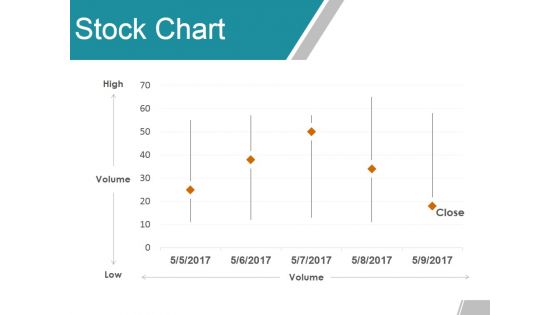
Stock Chart Ppt PowerPoint Presentation Summary Graphics Pictures
This is a stock chart ppt powerpoint presentation summary graphics pictures. This is a five stage process. The stages in this process are high, volume, low, close, finance.

Stock Chart Ppt PowerPoint Presentation Gallery Graphic Images
This is a stock chart ppt powerpoint presentation gallery graphic images. This is a five stage process. The stages in this process are close, high, volume, low, open.
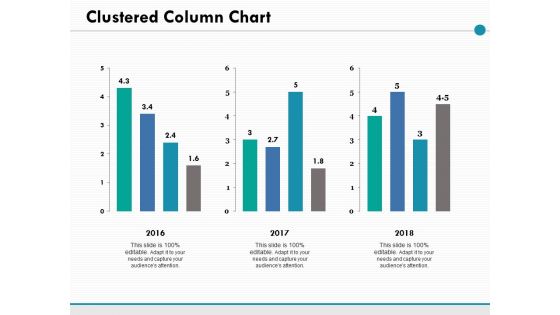
Clustered Column Chart Ppt PowerPoint Presentation Ideas Picture
This is a clustered column chart ppt powerpoint presentation ideas picture. This is a three stage process. The stages in this process are percentage, product, management, marketing.
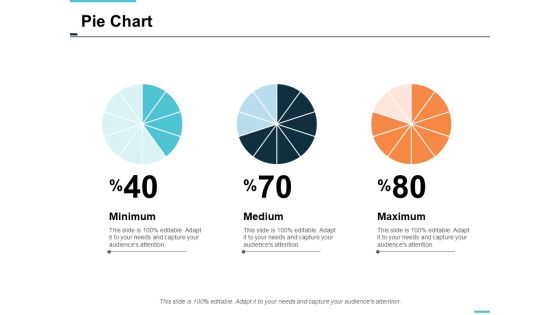
pie chart finance ppt powerpoint presentation styles skills
This is a pie chart finance ppt powerpoint presentation styles skills. This is a three stage process. The stages in this process are finance, marketing, management, investment, analysis.
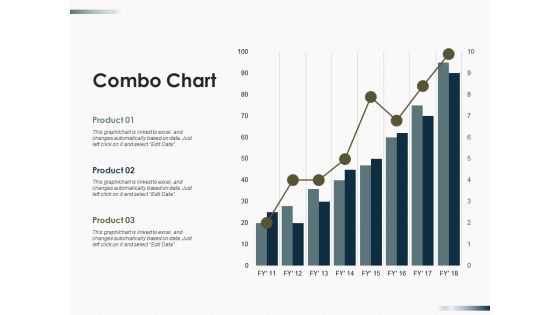
Combo Chart Finance Ppt PowerPoint Presentation Portfolio Guidelines
This is a combo chart finance ppt powerpoint presentation portfolio guidelines. This is a three stage process. The stages in this process are finance, marketing, management, investment, analysis.
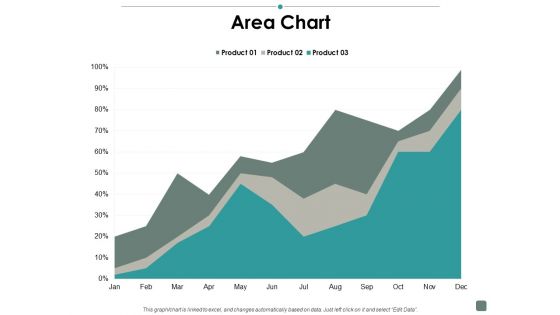
Area Chart Contribution Ppt PowerPoint Presentation Gallery Structure
This is a area chart contribution ppt powerpoint presentation gallery structure. This is a three stage process. The stages in this process are business, management, strategy, analysis, marketing.
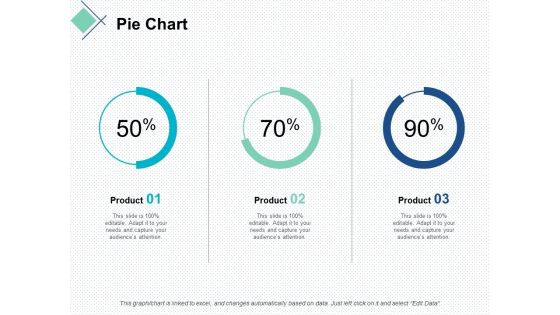
pie chart finance marketing ppt powerpoint presentation slides demonstration
This is a pie chart finance marketing ppt powerpoint presentation slides demonstration. This is a stage process. The stages in this process are finance, marketing, management, investment, analysis.

Stock Chart Graph Ppt PowerPoint Presentation Ideas Demonstration
This is a stock chart graph ppt powerpoint presentation ideas demonstration. This is a three stage process. The stages in this process are finance, marketing, management, investment, analysis.
Business Competitors Analysis Table Ppt Powerpoint Presentation Icon Brochure
This is a business competitors analysis table ppt powerpoint presentation icon brochure. This is a six stage process. The stages in this process are comparison chart, comparison table, comparison matrix.

Percentage Data Circle Chart Powerpoint Slides
This PowerPoint template has been designed with circle chart. Download this PPT chart to depict financial ratio analysis. This PowerPoint slide is of great help in the business sector to make realistic presentations and provides effective way of presenting your newer thoughts.
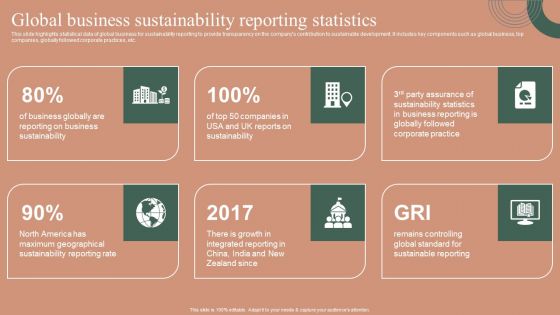
Global Business Sustainability Reporting Statistics Themes PDF
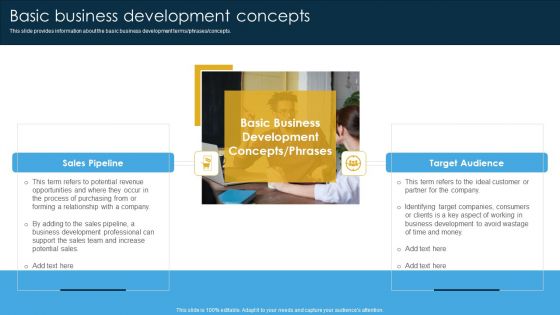
Basic Business Development Concepts Ppt PowerPoint Presentation Diagram Images PDF
This slide provides information about the basic business development terms phrases concepts. There are so many reasons you need a Basic Business Development Concepts Ppt PowerPoint Presentation Diagram Images PDF. The first reason is you cannot spend time making everything from scratch, Thus, Slidegeeks has made presentation templates for you too. You can easily download these templates from our website easily.

Activity Planning Chart Ppt PowerPoint Presentation Backgrounds
This is a activity planning chart ppt powerpoint presentation backgrounds. This is a five stage process. The stages in this process are business, strategy, analysis, marketing, chart and graph, compare.
Person Making Fund Transfer With Dollar Symbol Ppt PowerPoint Presentation Icon Diagrams PDF
Presenting person making fund transfer with dollar symbol ppt powerpoint presentation icon diagrams pdf to dispense important information. This template comprises three stages. It also presents valuable insights into the topics including person making fund transfer with dollar symbol. This is a completely customizable PowerPoint theme that can be put to use immediately. So, download it and address the topic impactfully.
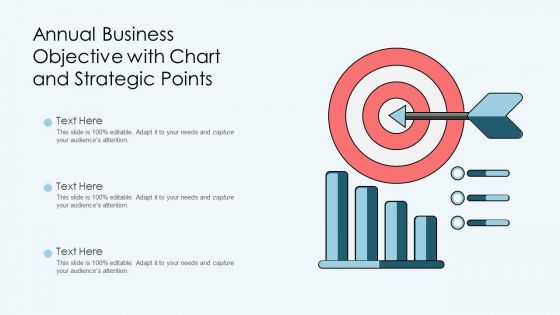
Annual Business Objective With Chart And Strategic Points Ppt Styles Maker PDF
Presenting annual business objective with chart and strategic points ppt styles maker pdf to dispense important information. This template comprises three stages. It also presents valuable insights into the topics including annual business objective with chart and strategic points. This is a completely customizable PowerPoint theme that can be put to use immediately. So, download it and address the topic impactfully.

Our Expert Team For Land Administration Business Proposal Diagrams PDF
Stand out from the crowd with our dynamic Our Expert Team For Land Administration Business Proposal Diagrams PDF template. Designed to help you make a statement, this single-slide PPT template is fully customizable to suit your unique needs. With eye-catching visuals and seamless editing options, you can create impactful presentations in minutes. Say goodbye to boring slides and unlock your presentation potential with our top-notch template.
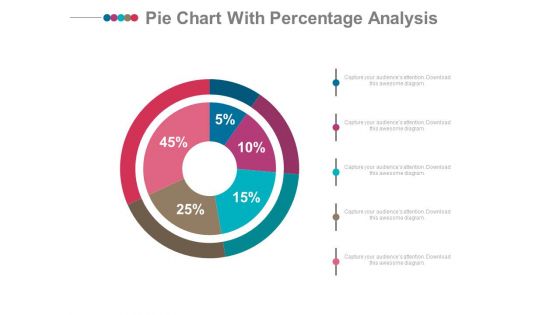
Pie Chart With Financial Data Comparison Powerpoint Slides
Emphatically define your message with our above template which contains graphics of pie chart. This PowerPoint template may be used to display financial data comparison. Grab the attention of your listeners with this slide.
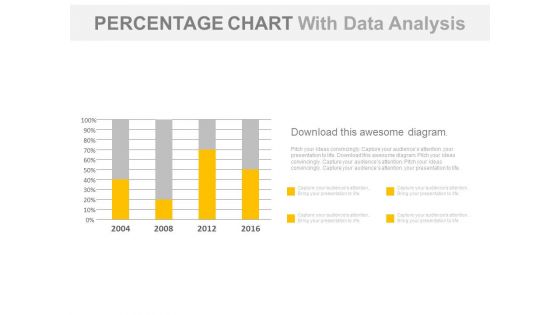
Year Based Chart With Percentage Data Analysis Powerpoint Slides
Our above business slide contains year based statistical chart. This PowerPoint template can be used to display percentage data analysis. Capture the attention of your audience with this slide.
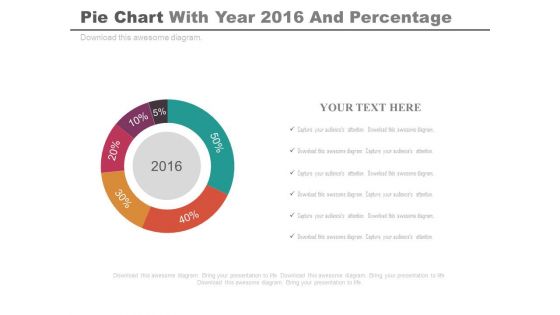
Pie Chart For Projected Profit Of 2016 Powerpoint Slides
Our above PPT slide displays graphics of Pie chart. This PowerPoint template may be used to display projected profit report of 2016. Download this template to leave permanent impression on your audience.
Project Work Plan Project Execution Gantt Chart Powerpoint Slide Template
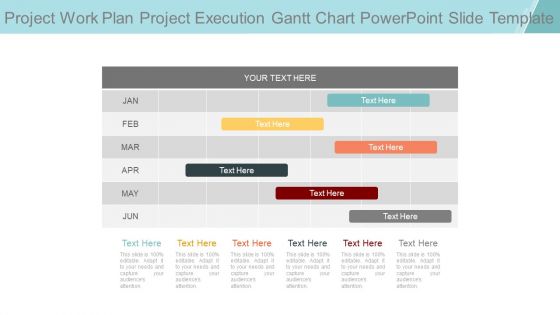
This is a project work plan project execution gantt chart powerpoint slide template. This is a six stage process. The stages in this process are jan, feb, mar, apr, may, jun.
Break Point Chart For Quality Analysis Powerpoint Slide Show
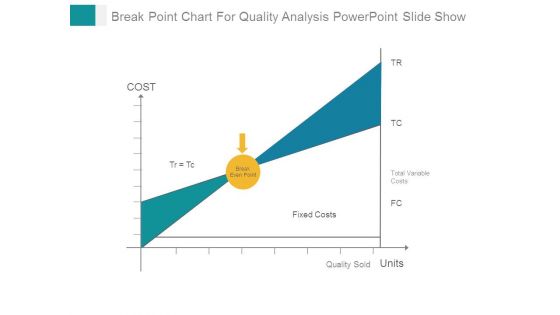
This is a break point chart for quality analysis powerpoint slide show. This is a one stage process. The stages in this process are total variable costs, fixed costs, quality sold.

Our Market Research Plan Gantt Chart Powerpoint Slide Backgrounds
This is a our market research plan gantt chart powerpoint slide backgrounds. This is a nine stage process. The stages in this process are jan, feb, mar, apr, may.

Our Offers Vs The Competition Comparison Chart Ppt Example File
This is a our offers vs the competition comparison chart ppt example file. This is a five stage process. The stages in this process are compare, table, management, business, strategy.
Projects And Assignments Bar Chart Powerpoint Slide Background Image
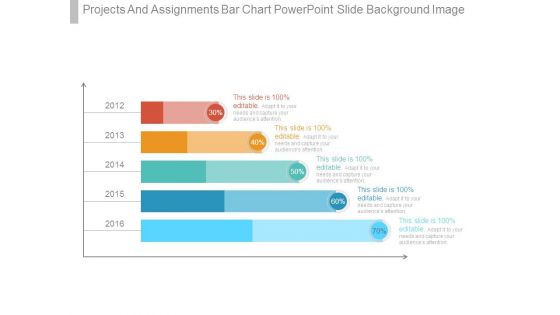
This is a projects and assignments bar chart powerpoint slide background image. This is a five stage process. The stages in this process are finance, presentation, business, strategy, marketing.

Brand Trade Show Calendar Gantt Chart Example Ppt Presentation
This is a brand trade show calendar gantt chart example ppt presentation. This is a one stage process. The stages in this process are jan, feb, mar, apr, may, jun, jul, aug, sep, oct, nov, dec.

Research Work Plan Table Chart 111 Powerpoint Ideas
This is a research work plan table chart 111 powerpoint ideas. This is a twelve stage process. The stages in this process are business, marketing, table, arrow, success, strategy.
Scatter Bubble Chart Ppt PowerPoint Presentation Infographics Backgrounds
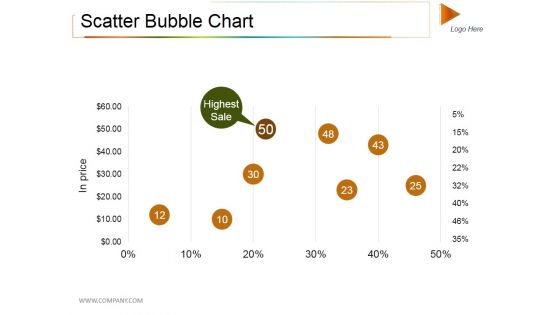
This is a scatter bubble chart ppt powerpoint presentation infographics backgrounds. This is a five stage process. The stages in this process are highest sale, in price, growth, success, business.
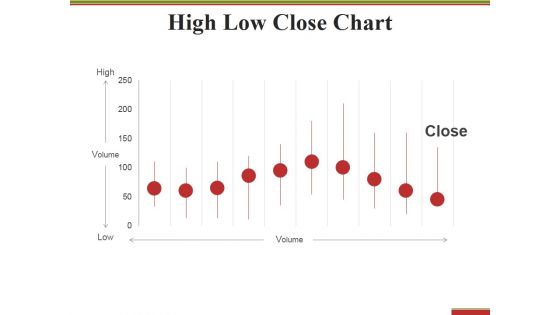
High Low Close Chart Ppt PowerPoint Presentation Styles Display
This is a high low close chart ppt powerpoint presentation styles display. This is a ten stage process. The stages in this process are high, volume, low, close, finance.

Stock Chart Ppt PowerPoint Presentation Outline Graphics Example
This is a stock chart ppt powerpoint presentation outline graphics example. This is a five stage process. The stages in this process are close, volume, low, high, open, product.
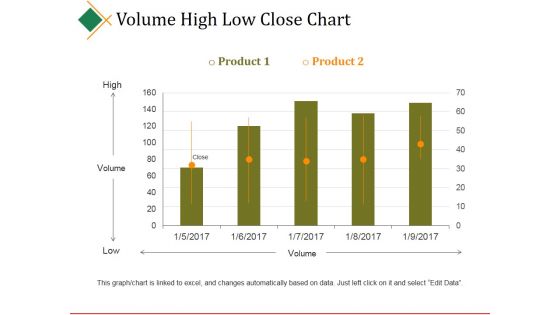
Volume High Low Close Chart Ppt PowerPoint Presentation Gallery Shapes
This is a volume high low close chart ppt powerpoint presentation gallery shapes. This is a five stage process. The stages in this process are high, volume, low, close, finance.
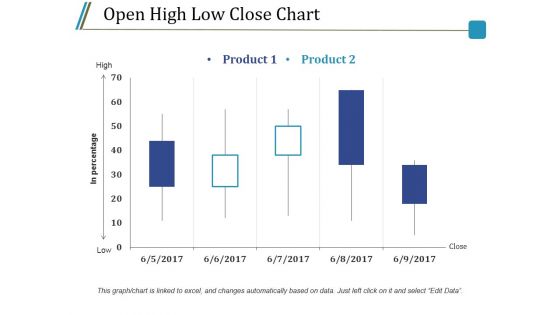
Open High Low Close Chart Ppt PowerPoint Presentation Styles Model
This is a open high low close chart ppt powerpoint presentation styles model. This is a five stage process. The stages in this process are product, high, low, in percentage, close.
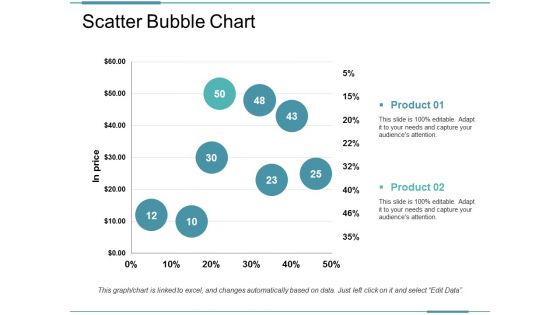
Scatter Bubble Chart Template Ppt PowerPoint Presentation Professional Background
This is a scatter bubble chart template ppt powerpoint presentation professional background. This is a six stage process. The stages in this process are business, marketing, strategy, planning, finance.
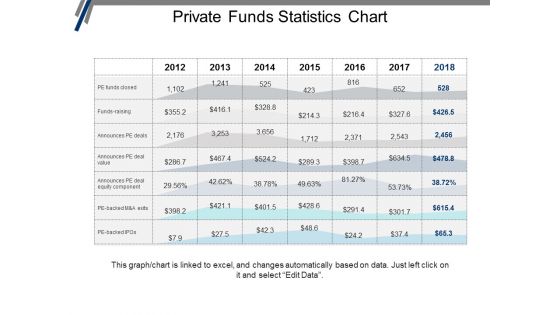
Private Funds Statistics Chart Ppt PowerPoint Presentation Portfolio Graphics Design
This is a private funds statistics chart ppt powerpoint presentation portfolio graphics design. This is a seven stage process. The stages in this process are investment, funding, private equity, venture capital.
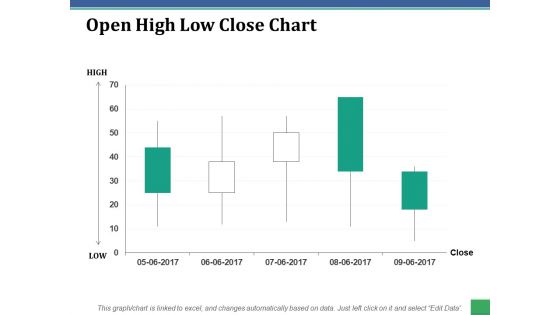
Open High Low Close Chart Ppt PowerPoint Presentation Professional Inspiration
This is a open high low close chart ppt powerpoint presentation professional inspiration. This is a five stage process. The stages in this process are high, low, close, business, finance.
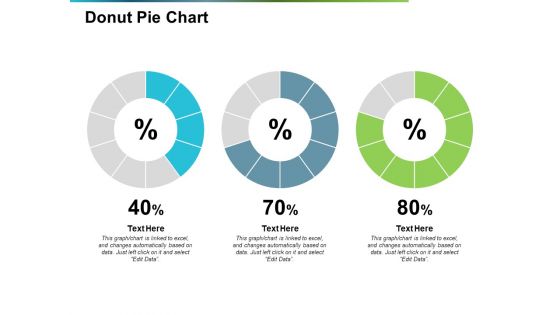
Donut Pie Chart Ppt PowerPoint Presentation Show Graphics Download
This is a donut pie chart ppt powerpoint presentation show graphics download. This is a three stage process. The stages in this process are percentage, finance, donut, business, marketing.

Monthly Task Planning Gantt Chart Ppt PowerPoint Presentation Portfolio Images
This is a monthly task planning gantt chart ppt powerpoint presentation portfolio images. This is a six stage process. The stages in this process are strategy plan, strategy objectives, strategy action.

Bar Chart Ppt PowerPoint Presentation Infographic Template Graphics Design
This is a bar chart ppt powerpoint presentation infographic template graphics design. This is a five stage process. The stages in this process are management, marketing, business, percentage, product.

Pie Chart Finance Ppt PowerPoint Presentation Styles Graphics Template
This is a pie chart finance ppt powerpoint presentation styles graphics template. This is a three stage process. The stages in this process are financial, minimum, medium, maximum, marketing.

Project Status Bar Chart Ppt PowerPoint Presentation Ideas Objects
This is a project status bar chart ppt powerpoint presentation ideas objects. This is a four stage process. The stages in this process are project management, project progress, project growth.
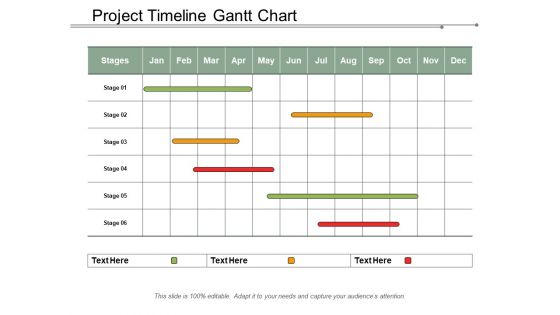
Project Timeline Gantt Chart Ppt PowerPoint Presentation Gallery
This is a project timeline gantt chart ppt powerpoint presentation gallery. This is a three stage process. The stages in this process are project management, project progress, project growth.

Share Market Technical Analysis Chart Ppt Powerpoint Presentation Professional Rules
This is a share market technical analysis chart ppt powerpoint presentation professional rules. This is a three stage process. The stages in this process are stock market, financial market, bull market.
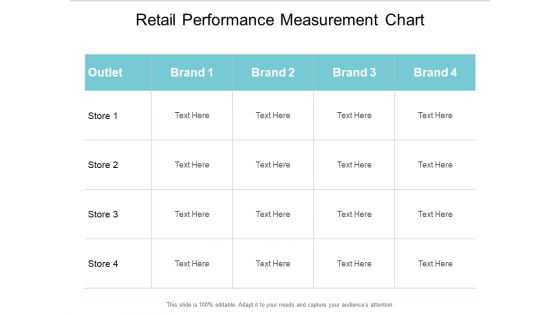
Retail Performance Measurement Chart Ppt PowerPoint Presentation Ideas Structure
This is a retail performance measurement chart ppt powerpoint presentation ideas structure. This is a four stage process. The stages in this process are product distribution, distribution system, numeric distribution.

Donut Pie Chart Finance Ppt PowerPoint Presentation Portfolio Model
This is a donut pie chart finance ppt powerpoint presentation portfolio model. This is a three stage process. The stages in this process are finance, management, strategy, analysis, marketing.

Stock Chart Finance Analysis Ppt Powerpoint Presentation Ideas Portrait
This is a stock chart finance analysis ppt powerpoint presentation ideas portrait. This is a three stage process. The stages in this process are finance, marketing, management, investment, strategy.

Column Chart And Graph Ppt PowerPoint Presentation File Introduction
This is a column chart and graph ppt powerpoint presentation file introduction. This is a three stage process. The stages in this process are finance, marketing, management, investment, analysis.
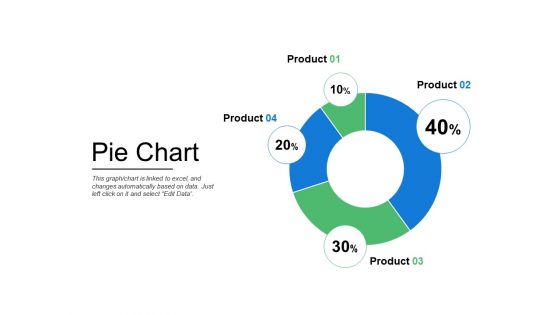
Pie Chart Finance Ppt PowerPoint Presentation Infographics Mockup
This is a pie chart finance ppt powerpoint presentation infographics mockup . This is a four stage process. The stages in this process are finance, marketing, management, investment, analysis.
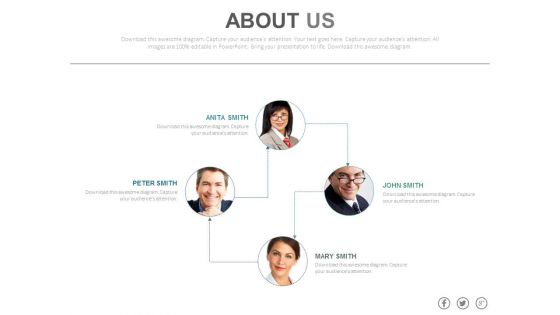
About Us Team Hierarchy Chart Powerpoint Slides
On this template you can see team of four persons. This PowerPoint slide is an excellent tool to display team hierarchy. Give a detailed introduction of your team with complete profile information.
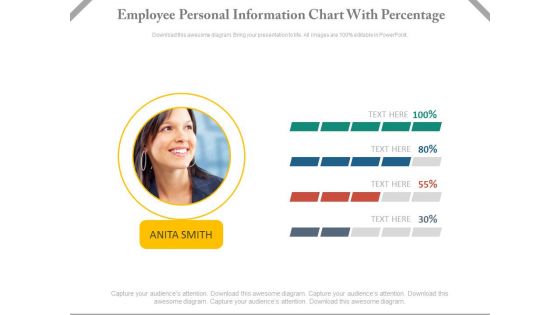
Employee Performance Information Chart Powerpoint Slides
This dashboard template contains employee picture with percentage slides. This dashboard PowerPoint template conveys employees performance in a visual manner. Download this PPT slide for quick decision-making.
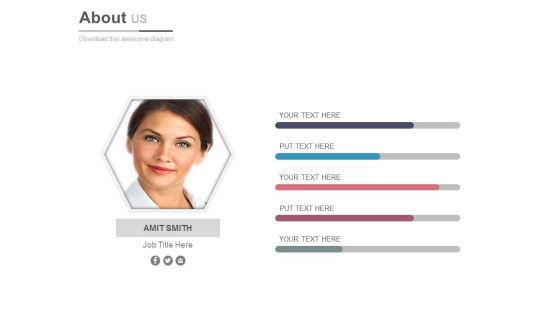
Employee Skill Assessment Chart Powerpoint Slides
You can download this slide to depict employee skill assessment. This Slide may be used to depict unique traits of high performing team member. This about us slide design helps to make professional presentations.

Linear Chart Of Employee Pictures Powerpoint Slides
Download this PowerPoint template to create an attention grabbing introductory slide. It contains linear design with team pictures. Use this professional slide design to exhibit high performance working environment of your company.

Three Text Tags Compare Chart Powerpoint Slides
This PowerPoint template has been designed with text tags and percentage data. You may download this PPT slide to display data comparison and analysis. Add this slide to your presentation and impress your superiors.

Business Finance Strategy Development Post It Notes Style 4 Business Cycle Diagram
Our Business Finance Strategy Development Post It Notes Style 4 Business Cycle Diagram Powerpoint Templates are the essential beat of your lilting melody. Adorn them with your tuneful thoughts and top the charts. Our Business Finance Strategy Development Post It Notes Style 4 Business Cycle Diagram Powerpoint Templates give you a court to play on. Dribble your way along and score a goal.

 Home
Home