Turnover Dashboard
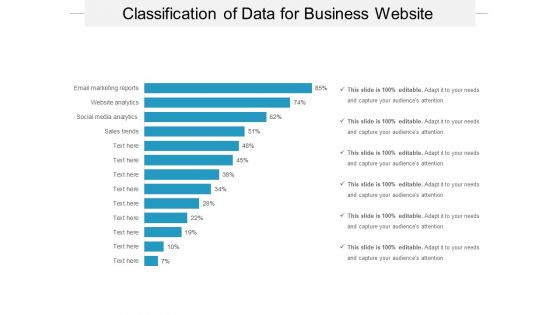
Classification Of Data For Business Website Ppt PowerPoint Presentation Styles Layout PDF
Presenting this set of slides with name classification of data for business website ppt powerpoint presentation styles layout pdf. The topics discussed in these slides are sales trends, social media analytics, website analytics, email marketing reports. This is a completely editable PowerPoint presentation and is available for immediate download. Download now and impress your audience.
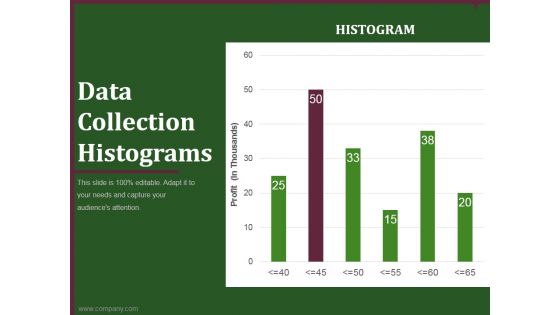
data collection histograms ppt powerpoint presentation example
This is a data collection histograms ppt powerpoint presentation example. This is a six stage process. The stages in this process are business, planning, marketing, histograms, graph.
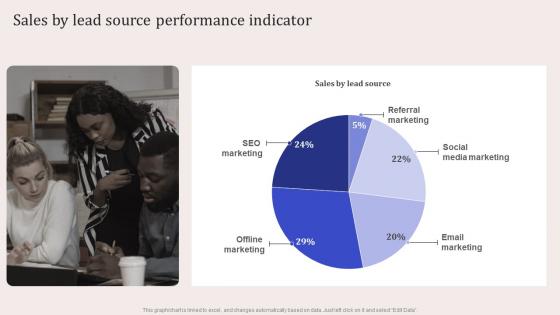
Sales By Lead Source Performance Indicator Virtual Event Promotion To Capture Infographics Pdf
The Sales By Lead Source Performance Indicator Virtual Event Promotion To Capture Infographics Pdf is a compilation of the most recent design trends as a series of slides. It is suitable for any subject or industry presentation, containing attractive visuals and photo spots for businesses to clearly express their messages. This template contains a variety of slides for the user to input data, such as structures to contrast two elements, bullet points, and slides for written information. Slidegeeks is prepared to create an impression.

Engineering Services Company Valuation Ratios Engineering Company Financial Analysis Report Brochure PDF
The following slide highlights the valuation ratio of the engineering company to assess the organizations worth on the basis of share price, sales, and market capitalization, Key ratios included are enterprise value, EV per net sales, price to book value, market cap per sales, retention ratio and earnings yield. The Engineering Services Company Valuation Ratios Engineering Company Financial Analysis Report Brochure PDF is a compilation of the most recent design trends as a series of slides. It is suitable for any subject or industry presentation, containing attractive visuals and photo spots for businesses to clearly express their messages. This template contains a variety of slides for the user to input data, such as structures to contrast two elements, bullet points, and slides for written information. Slidegeeks is prepared to create an impression.

Retail Outlet Opening To Enhance Product Sale Kpis To Measure The Performance Infographics PDF
The following slide showcases multiple key performance indicator which will assist the managers to evaluate the business performance of new retail store. The key metrics are sales per square foot, average transaction value, sales per employee, footfall and customer retention rate. Slidegeeks is here to make your presentations a breeze with Retail Outlet Opening To Enhance Product Sale Kpis To Measure The Performance Infographics PDF With our easy to use and customizable templates, you can focus on delivering your ideas rather than worrying about formatting. With a variety of designs to choose from, you are sure to find one that suits your needs. And with animations and unique photos, illustrations, and fonts, you can make your presentation pop. So whether you are giving a sales pitch or presenting to the board, make sure to check out Slidegeeks first.
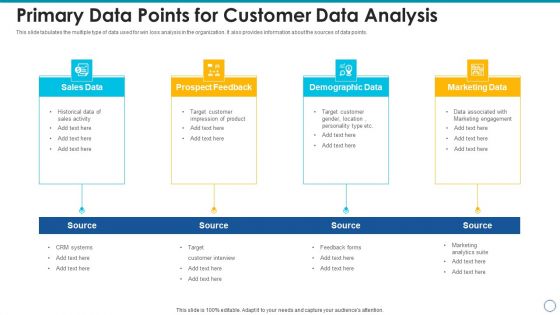
Primary Data Points For Customer Data Analysis Ideas PDF
This slide tabulates the multiple type of data used for win loss analysis in the organization. It also provides information about the sources of data points. Presenting primary data points for customer data analysis ideas pdf to dispense important information. This template comprises four stages. It also presents valuable insights into the topics including sales data, prospect feedback, demographic data, marketing data. This is a completely customizable PowerPoint theme that can be put to use immediately. So, download it and address the topic impactfully.
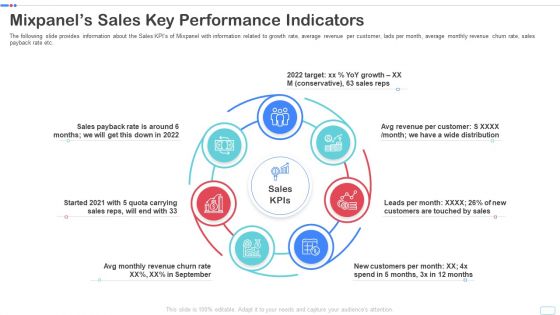
Mixpanel Capital Raising Pitch Deck Mixpanels Sales Key Performance Indicators Clipart PDF
The following slide provides information about the Sales KPIs of Mixpanel with information related to growth rate, average revenue per customer, lads per month, average monthly revenue churn rate, sales payback rate etc. This is a mixpanel capital raising pitch deck mixpanels sales key performance indicators clipart pdf template with various stages. Focus and dispense information on seven stages using this creative set, that comes with editable features. It contains large content boxes to add your information on topics like mixpanels sales key performance indicators. You can also showcase facts, figures, and other relevant content using this PPT layout. Grab it now.

Data And Customer Analysis Company Outline Revenue And Operating Income Diagrams PDF
This slide highlights the Nielsen company revenue and operating income for the last 3 years. It includes the data in million of US dollars with a key takeaways section. Create an editable Data And Customer Analysis Company Outline Revenue And Operating Income Diagrams PDF that communicates your idea and engages your audience. Whether youre presenting a business or an educational presentation, pre designed presentation templates help save time. Data And Customer Analysis Company Outline Revenue And Operating Income Diagrams PDF is highly customizable and very easy to edit, covering many different styles from creative to business presentations. Slidegeeks has creative team members who have crafted amazing templates. So, go and get them without any delay.
Competitive Analysis Financial And Operational Data Ppt Show Icons PDF
The slide provides the Competitive landscape of the company on the basis of financial data sales and profit and operational data employee count, locations, number of branches, year of existence, interest rate etc.Deliver and pitch your topic in the best possible manner with this competitive analysis financial and operational data ppt show icons pdf. Use them to share invaluable insights on revenue, interest income, non performing loans and impress your audience. This template can be altered and modified as per your expectations. So, grab it now.
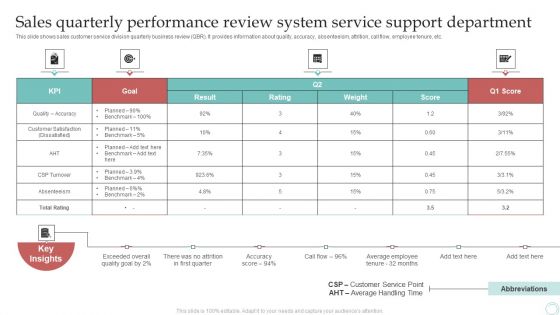
Sales Quarterly Performance Review System Service Support Department Infographics PDF
This slide shows sales customer service division quarterly business review QBR. It provides information about quality, accuracy, absenteeism, attrition, call flow, employee tenure, etc. Pitch your topic with ease and precision using this Sales Quarterly Performance Review System Service Support Department Infographics PDF. This layout presents information on KPI, Goal, Quality Accuracy. It is also available for immediate download and adjustment. So, changes can be made in the color, design, graphics or any other component to create a unique layout.
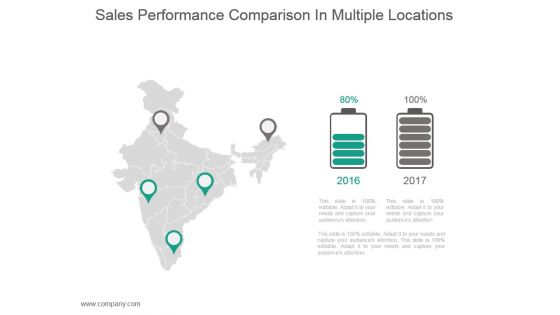
Sales Performance Comparison In Multiple Locations Ppt Slides
This is a sales performance comparison in multiple locations ppt slides. This is a two stage process. The stages in this process are business, marketing, location, finance, strategy, analysis.
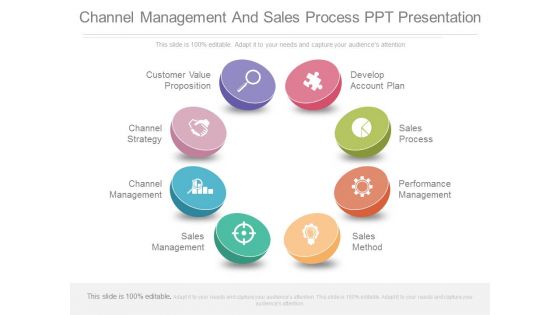
Channel Management And Sales Process Ppt Presentation
This is a channel management and sales process ppt presentation. This is a eight stage process. The stages in this process are marketing, business, process and flows.
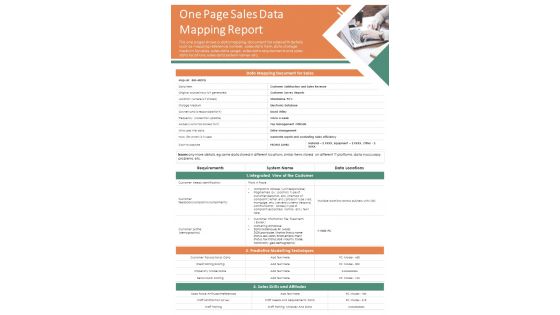
One Page Sales Data Mapping Report PDF Document PPT Template
Here an illustrative One Page Sales Data Mapping Report PDF Document PPT Template. This one-pager template is designed to match your needs. It is 100 percent editable, which allows you to make changes as you seem fit to suit your purpose. Grab this One Page Sales Data Mapping Report PDF Document PPT Template Download now.

Performance Report With Monthly Sales Data Diagrams PDF
The slide displays a report including sales data for different months to evaluate and manage product performance. The slide includes average sales per month graph with key takeaways. Showcasing this set of slides titled Performance Report With Monthly Sales Data Diagrams PDF. The topics addressed in these templates are Business, Sales, Customization. All the content presented in this PPT design is completely editable. Download it and make adjustments in color, background, font etc. as per your unique business setting.

Case Study Trend Analysis For Telecommunications Business Product Analytics Implementation Data Analytics V
This slide provides a case study highlighting use of trend analysis in a telecom company to improve its sales. It covers challenges faced, initiatives undertaken and outcomes on costs and sales Slidegeeks is here to make your presentations a breeze with Case Study Trend Analysis For Telecommunications Business Product Analytics Implementation Data Analytics V With our easy-to-use and customizable templates, you can focus on delivering your ideas rather than worrying about formatting. With a variety of designs to choose from, you are sure to find one that suits your needs. And with animations and unique photos, illustrations, and fonts, you can make your presentation pop. So whether you are giving a sales pitch or presenting to the board, make sure to check out Slidegeeks first
Magnifying Glass Ppt PowerPoint Presentation Icon
This is a magnifying glass ppt powerpoint presentation icon. This is a one stage process. The stages in this process are business, marketing, management, planning, magnifying glass.

Current Analysis Analysing Retail Store Performance Optimizing Retail Operations With Digital DT SS V
This slide help analyse the declining performance of current key performance indicators of retail store. It includes marketing and sales, inventory management, customer relationship, data utilization, employee productivity, and competitive analysis.Whether you have daily or monthly meetings, a brilliant presentation is necessary. Current Analysis Analysing Retail Store Performance Optimizing Retail Operations With Digital DT SS V can be your best option for delivering a presentation. Represent everything in detail using Current Analysis Analysing Retail Store Performance Optimizing Retail Operations With Digital DT SS V and make yourself stand out in meetings. The template is versatile and follows a structure that will cater to your requirements. All the templates prepared by Slidegeeks are easy to download and edit. Our research experts have taken care of the corporate themes as well. So, give it a try and see the results.

Statistical Report For Sales Market Evaluation Clipart Pdf
This slide showcases statistical report for sales market analysis. It covers information about monthly market analysis chart, sales chart, distribution map and line chart. Showcasing this set of slides titled Statistical Report For Sales Market Evaluation Clipart Pdf. The topics addressed in these templates are Monthly Market Analysis Chart, Market Sales Chart, Sales Chart Each Market. All the content presented in this PPT design is completely editable. Download it and make adjustments in color, background, font etc. as per your unique business setting.
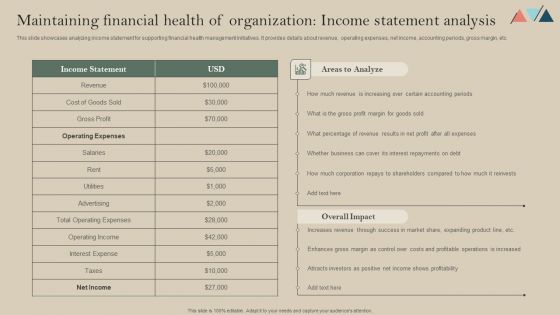
Maintaining Financial Health Of Organization Income Statement Analysis Themes PDF
This slide showcases analyzing income statement for supporting financial health management initiatives. It provides details about revenue, operating expenses, net income, accounting periods, gross margin, etc. The Maintaining Financial Health Of Organization Income Statement Analysis Themes PDF is a compilation of the most recent design trends as a series of slides. It is suitable for any subject or industry presentation, containing attractive visuals and photo spots for businesses to clearly express their messages. This template contains a variety of slides for the user to input data, such as structures to contrast two elements, bullet points, and slides for written information. Slidegeeks is prepared to create an impression.
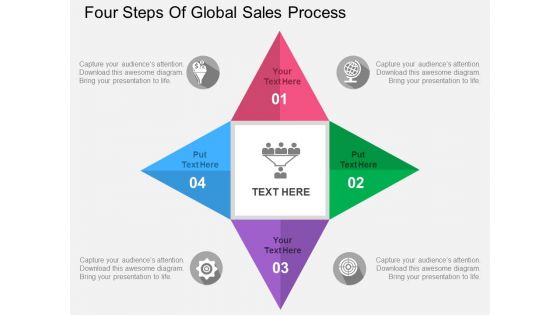
Four Steps Of Global Sales Process Powerpoint Templates
The above PPT slide contains four steps infographic layout. This PPT slide helps to portray steps of global sales process. Download this slide to make professional presentations.

Financial Data Analysis Sample Diagram Presentation Slide
This is a financial data analysis sample diagram presentation slide. This is a four stage process. The stages in this process are finance, sales and marketing, operations, credit and risk.

Percentage Data Growth Chart Powerpoint Slides
This PowerPoint template has been designed with percentage data growth chart. Download this PPT chart to depict financial ratio analysis. This PowerPoint slide is of great help in the business sector to make realistic presentations and provides effective way of presenting your newer thoughts.
Business Diagram Icons And Charts For Business Growth Presentation Template
Our above slide contains graphics of business charts and icons. It helps to display business reports and analysis. Use this diagram to impart more clarity to data and to create more sound impact on viewers.
Icon For Sales Market Evaluation Report Mockup Pdf
Showcasing this set of slides titled Icon For Sales Market Evaluation Report Mockup Pdf. The topics addressed in these templates are Icon Sales Market, Evaluation Report. All the content presented in this PPT design is completely editable. Download it and make adjustments in color, background, font etc. as per your unique business setting.
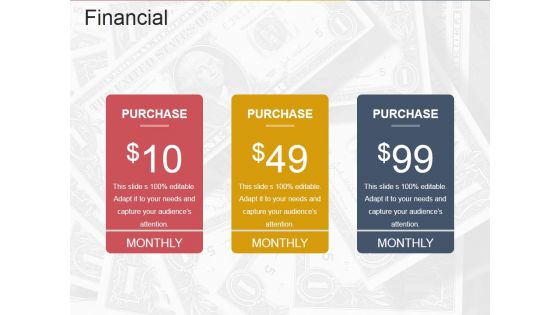
Financial Ppt PowerPoint Presentation Outline Grid
This is a financial ppt powerpoint presentation outline grid. This is a three stage process. The stages in this process are business, strategy, marketing, analysis, finance, purchase, monthly.

Data And Customer Analysis Company Outline Competitor Analysis Topics PDF
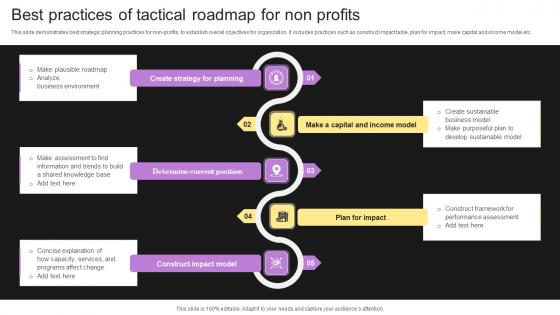
Best Practices Of Tactical Roadmap For Non Profits Infographics Pdf
This slide demonstrates best strategic planning practices for non profits, to establish overall objectives for organization. It includes practices such as construct impact table, plan for impact, make capital and income model etc.Showcasing this set of slides titled Best Practices Of Tactical Roadmap For Non Profits Infographics Pdf The topics addressed in these templates are Determine Current Position, Construct Impact Model, Performance Assessment All the content presented in this PPT design is completely editable. Download it and make adjustments in color, background, font etc. as per your unique business setting.

KPIs To Measure Performance Of Early Phase Startup Professional Pdf
This slide shows initial performance metrics for measuring overall growth of start-ups to plan future strategies. It include metrics such as customer acquisition cost, retention rate and churn rate, etc. Showcasing this set of slides titled KPIs To Measure Performance Of Early Phase Startup Professional Pdf. The topics addressed in these templates are Metrics, Description, Planned. All the content presented in this PPT design is completely editable. Download it and make adjustments in color, background, font etc. as per your unique business setting.

Data Science For Marketing And Sales Ppt PowerPoint Presentation Complete Deck With Slides
Share a great deal of information on the topic by deploying this Data Science For Marketing And Sales Ppt PowerPoint Presentation Complete Deck With Slides. Support your ideas and thought process with this prefabricated set. It includes a set of sixteen slides, all fully modifiable and editable. Each slide can be restructured and induced with the information and content of your choice. You can add or remove large content boxes as well, to make this PPT slideshow more personalized. Its high-quality graphics and visuals help in presenting a well-coordinated pitch. This PPT template is also a resourceful tool to take visual cues from and implement the best ideas to help your business grow and expand. The main attraction of this well-formulated deck is that everything is editable, giving you the freedom to adjust it to your liking and choice. Changes can be made in the background and theme as well to deliver an outstanding pitch. Therefore, click on the download button now to gain full access to this multifunctional set.
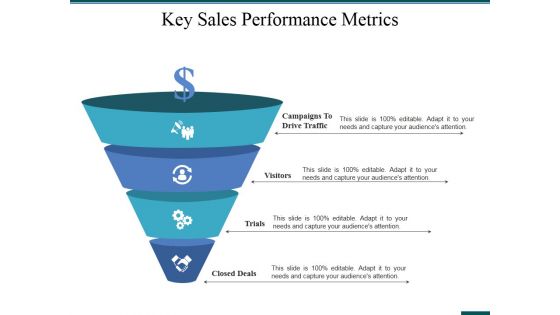
Key Sales Performance Metrics Ppt PowerPoint Presentation Infographic Template Samples
This is a key sales performance metrics ppt powerpoint presentation infographic template samples. This is a four stage process. The stages in this process are campaigns to drive traffic, visitors, trials, closed deals.
Business Sales Key Performance Indicators Report Ppt PowerPoint Presentation Icon Slideshow PDF
Showcasing this set of slides titled business sales key performance indicators report ppt powerpoint presentation icon slideshow pdf. The topics addressed in these templates are business sales key performance indicators report. All the content presented in this PPT design is completely editable. Download it and make adjustments in color, background, font etc. as per your unique business setting.

Cumulative Sales Key Performance Indicators Report Ppt PowerPoint Presentation Model Images PDF
Showcasing this set of slides titled cumulative sales key performance indicators report ppt powerpoint presentation model images pdf. The topics addressed in these templates are cumulative sales key performance indicators report. All the content presented in this PPT design is completely editable. Download it and make adjustments in color, background, font etc. as per your unique business setting.

The Marketing Mix Of Analysis Of Adidas Global Net Sales By Product Category Strategy SS V
This slide provide the statistical data representing the overall sales of Adidas globally during the past four years. It compares the major selling products of Adidas that are footwear, apparel and hardware. The The Marketing Mix Of Analysis Of Adidas Global Net Sales By Product Category Strategy SS V is a compilation of the most recent design trends as a series of slides. It is suitable for any subject or industry presentation, containing attractive visuals and photo spots for businesses to clearly express their messages. This template contains a variety of slides for the user to input data, such as structures to contrast two elements, bullet points, and slides for written information. Slidegeeks is prepared to create an impression.
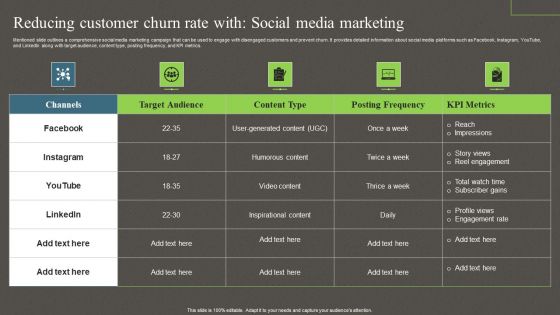
Reducing Customer Churn Rate With Social Media Marketing Ppt PowerPoint Presentation File Infographics PDF
Mentioned slide outlines a comprehensive social media marketing campaign that can be used to engage with disengaged customers and prevent churn. It provides detailed information about social media platforms such as Facebook, Instagram, YouTube, and LinkedIn along with target audience, content type, posting frequency, and KPI metrics. From laying roadmaps to briefing everything in detail, our templates are perfect for you. You can set the stage with your presentation slides. All you have to do is download these easy-to-edit and customizable templates. Reducing Customer Churn Rate With Social Media Marketing Ppt PowerPoint Presentation File Infographics PDF will help you deliver an outstanding performance that everyone would remember and praise you for. Do download this presentation today.
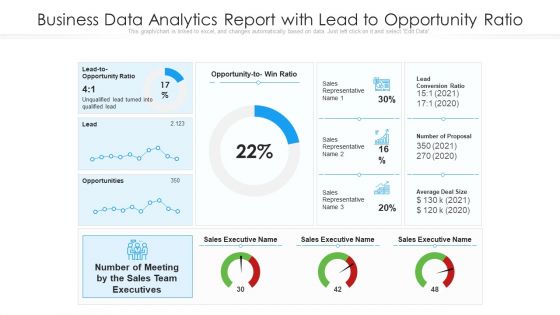
Business Data Analytics Report With Lead To Opportunity Ratio Ppt Styles Show PDF
Deliver an awe-inspiring pitch with this creative business data analytics report with lead to opportunity ratio ppt styles show pdf bundle. Topics like lead conversion ratio, sales team executives, average deal size can be discussed with this completely editable template. It is available for immediate download depending on the needs and requirements of the user.
Transformation Toolkit Competitive Intelligence Information Analysis Vendor Data Profile For Data Analytics Software Icons PDF
This slide represents the list of vendors along with accompanying information including the key features, pros and cons of each vendor software. Slidegeeks is here to make your presentations a breeze with Transformation Toolkit Competitive Intelligence Information Analysis Vendor Data Profile For Data Analytics Software Icons PDF With our easy to use and customizable templates, you can focus on delivering your ideas rather than worrying about formatting. With a variety of designs to choose from, you are sure to find one that suits your needs. And with animations and unique photos, illustrations, and fonts, you can make your presentation pop. So whether you are giving a sales pitch or presenting to the board, make sure to check out Slidegeeks first.

Improving Technology Based HR Recruitment Analytics Process And Kpis Designs PDF
This slide showcases generic process and key performance indicators included in recruitment analytics. It provides information about top source identification, source boosters usage, performance data gathering along with difference between manual and predictive recruitment analytics. Are you in need of a template that can accommodate all of your creative concepts This one is crafted professionally and can be altered to fit any style. Use it with Google Slides or PowerPoint. Include striking photographs, symbols, depictions, and other visuals. Fill, move around, or remove text boxes as desired. Test out color palettes and font mixtures. Edit and save your work, or work with colleagues. Download Improving Technology Based HR Recruitment Analytics Process And Kpis Designs PDF and observe how to make your presentation outstanding. Give an impeccable presentation to your group and make your presentation unforgettable.
Sales Order Processing Performance Tracking Indicators Graphics PDF
The following slide showcases key performance indicators for sales order fulfilment to meet customer expectations, specifications, deliver goods on time, compare order fulfilment against past orders. It includes elements such as category, key performance indicators, expected rate and actual rate. Showcasing this set of slides titled Sales Order Processing Performance Tracking Indicators Graphics PDF. The topics addressed in these templates are Customer Metrics, Inbound Metrics, Financial Metrics. All the content presented in this PPT design is completely editable. Download it and make adjustments in color, background, font etc. as per your unique business setting.

Technology Company Quarterly Revenue Projections And Retention Rate Clipart PDF
This slide covers quarter 4 tech company product revenue estimation. It also includes kpis such as net revenue retention rates, total customers, data marketplace listing, customer satisfaction and net promoter score. Pitch your topic with ease and precision using this Technology Company Quarterly Revenue Projections And Retention Rate Clipart PDF. This layout presents information on Product Revenue, Total Customers, Data Marketplace Listings. It is also available for immediate download and adjustment. So, changes can be made in the color, design, graphics or any other component to create a unique layout.
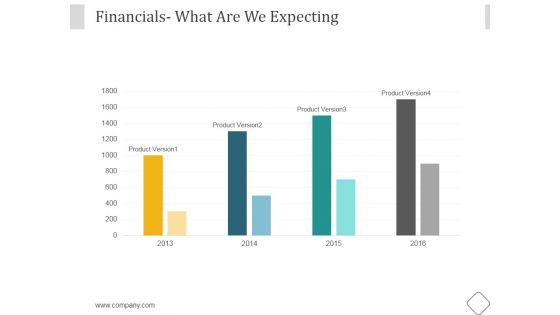
Financials Ppt PowerPoint Presentation Samples
This is a financials ppt powerpoint presentation samples. This is a four stage process. The stages in this process are business, marketing, management, financial, expecting.
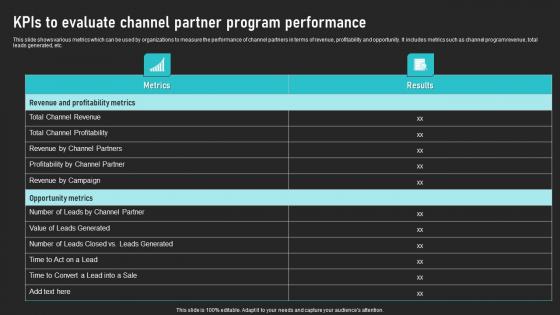
KPIS To Evaluate Channel Partner Program Performance Cooperative Sales Tactics Topics Pdf
This slide shows various metrics which can be used by organizations to measure the performance of channel partners in terms of revenue, profitability and opportunity. It includes metrics such as channel program revenue, total leads generated, etc. From laying roadmaps to briefing everything in detail, our templates are perfect for you. You can set the stage with your presentation slides. All you have to do is download these easy-to-edit and customizable templates. KPIS To Evaluate Channel Partner Program Performance Cooperative Sales Tactics Topics Pdf will help you deliver an outstanding performance that everyone would remember and praise you for. Do download this presentation today.
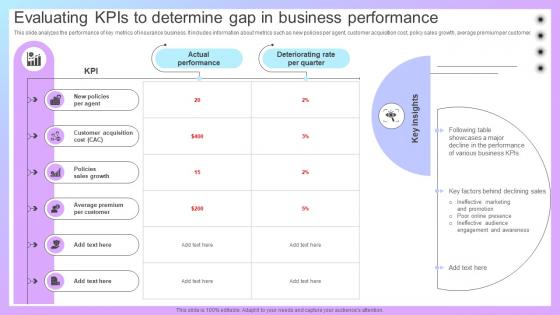
Increasing Business Awareness Evaluating Kpis To Determine Gap In Business Strategy SS V
This slide analyzes the performance of key metrics of insurance business. It includes information about metrics such as new policies per agent, customer acquisition cost, policy sales growth, average premium per customer. Whether you have daily or monthly meetings, a brilliant presentation is necessary. Increasing Business Awareness Evaluating Kpis To Determine Gap In Business Strategy SS V can be your best option for delivering a presentation. Represent everything in detail using Increasing Business Awareness Evaluating Kpis To Determine Gap In Business Strategy SS V and make yourself stand out in meetings. The template is versatile and follows a structure that will cater to your requirements. All the templates prepared by Slidegeeks are easy to download and edit. Our research experts have taken care of the corporate themes as well. So, give it a try and see the results.

Magnifying Glass Analyzing And Managing Risk In Material Acquisition For Supply Chain Administration Introduction PDF
Slidegeeks is here to make your presentations a breeze with Magnifying Glass Analyzing And Managing Risk In Material Acquisition For Supply Chain Administration Introduction PDF With our easy to use and customizable templates, you can focus on delivering your ideas rather than worrying about formatting. With a variety of designs to choose from, you are sure to find one that suits your needs. And with animations and unique photos, illustrations, and fonts, you can make your presentation pop. So whether you are giving a sales pitch or presenting to the board, make sure to check out Slidegeeks first.
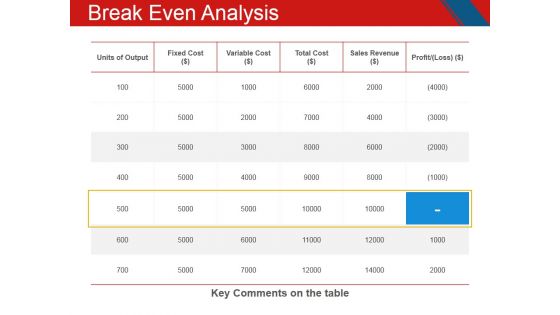
Break Even Analysis Ppt PowerPoint Presentation Inspiration Templates
This is a break even analysis ppt powerpoint presentation inspiration templates. This is a five stage process. The stages in this process are units of output, fixed cost, variable cost, total cost, sales revenue, profit.
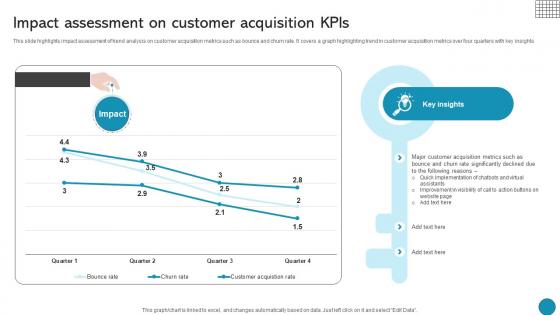
Impact Assessment On Customer Acquisition Kpis Driving Business Success Integrating Product
This slide highlights impact assessment of trend analysis on customer acquisition metrics such as bounce and churn rate. It covers a graph highlighting trend in customer acquisition metrics over four quarters with key insights Are you searching for a Impact Assessment On Customer Acquisition Kpis Driving Business Success Integrating Product that is uncluttered, straightforward, and original Its easy to edit, and you can change the colors to suit your personal or business branding. For a presentation that expresses how much effort you have put in, this template is ideal With all of its features, including tables, diagrams, statistics, and lists, its perfect for a business plan presentation. Make your ideas more appealing with these professional slides. Download Impact Assessment On Customer Acquisition Kpis Driving Business Success Integrating Product from Slidegeeks today.
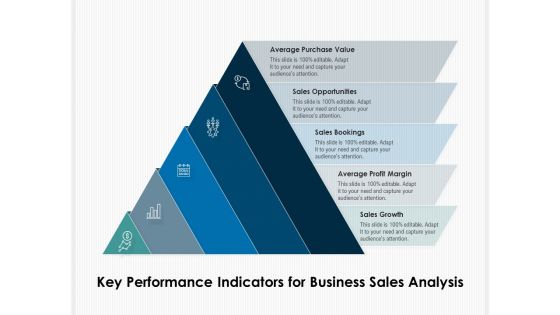
Key Performance Indicators For Business Sales Analysis Ppt PowerPoint Presentation Infographic Template Introduction PDF
Presenting key performance indicators for business sales analysis ppt powerpoint presentation infographic template introduction pdf to dispense important information. This template comprises five stages. It also presents valuable insights into the topics including average purchase value, sales opportunities, sales bookings, average profit margin, sales growth. This is a completely customizable PowerPoint theme that can be put to use immediately. So, download it and address the topic impactfully.
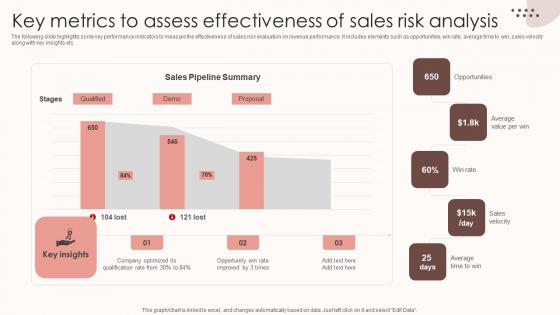
Assessing Sales Risks Key Metrics To Assess Effectiveness Of Sales Risk Analysis Diagrams PDF
The following slide highlights some key performance indicators to measure the effectiveness of sales risk evaluation on revenue performance. It includes elements such as opportunities, win rate, average time to win, sales velocity along with key insights etc. This Assessing Sales Risks Key Metrics To Assess Effectiveness Of Sales Risk Analysis Diagrams PDF is perfect for any presentation, be it in front of clients or colleagues. It is a versatile and stylish solution for organizing your meetings. The Assessing Sales Risks Key Metrics To Assess Effectiveness Of Sales Risk Analysis Diagrams PDF features a modern design for your presentation meetings. The adjustable and customizable slides provide unlimited possibilities for acing up your presentation. Slidegeeks has done all the homework before launching the product for you. So, do not wait, grab the presentation templates today
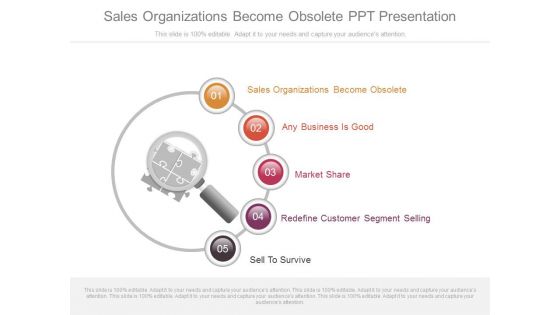
Sales Organizations Become Obsolete Ppt Presentation
This is a sales organizations become obsolete ppt presentation. This is a five stage process. The stages in this process are sales organizations become obsolete, any business is good, market share, redefine customer segment selling, sell to survive.

Funnel Ppt PowerPoint Presentation Guide
This is a funnel ppt powerpoint presentation guide. This is a five stage process. The stages in this process are business, marketing, funnel, process, success.
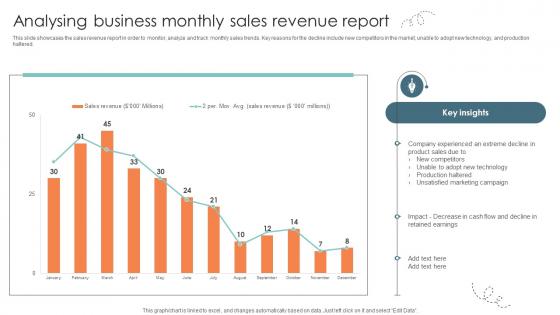
Analysing Business Monthly Sales Revenue Report Strategic Approaches To Corporate Financial
This slide showcases the sales revenue report in order to monitor, analyze and track monthly sales trends. Key reasons for the decline include new competitors in the market, unable to adopt new technology, and production haltered. Boost your pitch with our creative Analysing Business Monthly Sales Revenue Report Strategic Approaches To Corporate Financial. Deliver an awe-inspiring pitch that will mesmerize everyone. Using these presentation templates you will surely catch everyones attention. You can browse the ppts collection on our website. We have researchers who are experts at creating the right content for the templates. So you do not have to invest time in any additional work. Just grab the template now and use them.

Key Performance Indicators Of Ibn Outsourcing Company With Future Targets Ppt Ideas Brochure PDF
The slide shows the key Performance Indicator KPIs which will help the company to track the success rate of implemented strategies. Some of the KPIs are Customer Attrition Rate, Product or Service Adoption Rate, Average Customer Queue Time , Customer Satisfaction Rate etc. Deliver an awe-inspiring pitch with this creative key performance indicators of ibn outsourcing company with future targets ppt ideas brochure pdf. bundle. Topics like key performance indicators, company revenue, customer attrition rate, performance, target can be discussed with this completely editable template. It is available for immediate download depending on the needs and requirements of the user.
Five Key Performance Indicators Of Sales Team With Icons Ppt PowerPoint Presentation Gallery Introduction PDF
Persuade your audience using this five key performance indicators of sales team with icons ppt powerpoint presentation gallery introduction pdf. This PPT design covers five stages, thus making it a great tool to use. It also caters to a variety of topics including sales, win, revenue. Download this PPT design now to present a convincing pitch that not only emphasizes the topic but also showcases your presentation skills.

Crm Customer Satisfaction Ppt PowerPoint Presentation Professional
This is a crm customer satisfaction ppt powerpoint presentation professional. This is a four stage process. The stages in this process are satisfy unstated, customer needs, achieve customer delight, meet basic customer requirements.

Crm Pipeline Management Ppt PowerPoint Presentation Clipart
This is a crm pipeline management ppt powerpoint presentation clipart. This is a seven stage process. The stages in this process are just a name, engaged, prospect, opportunity, customer.

Crowdfunding Escalator Ppt PowerPoint Presentation Infographics Skills
This is a crowdfunding escalator ppt powerpoint presentation infographics skills. This is a five stage process. The stages in this process are donation reward, reward, debt equity, equity debt, institutional.

Measuring Overall Health Of Strategies To Mitigate Customer Churn Portrait Pdf
Mentioned slide outlines different key performance indicators KPIs that will assist corporates to evaluate the success of customer churn prevention strategies. The major metrics covered in the slide are revenue growth rate, monthly active users MAU, net promoter score NPS, customer satisfaction score CSAT, and customer acquisition cost CAC. Are you searching for a Measuring Overall Health Of Strategies To Mitigate Customer Churn Portrait Pdf that is uncluttered, straightforward, and original It is easy to edit, and you can change the colors to suit your personal or business branding. For a presentation that expresses how much effort you have put in, this template is ideal With all of its features, including tables, diagrams, statistics, and lists, it is perfect for a business plan presentation. Make your ideas more appealing with these professional slides. Download Measuring Overall Health Of Strategies To Mitigate Customer Churn Portrait Pdf from Slidegeeks today.
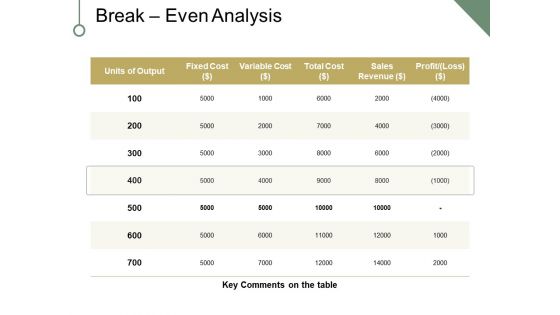
Break Even Analysis Ppt PowerPoint Presentation Portfolio Clipart
This is a break even analysis ppt powerpoint presentation portfolio clipart. This is a five stage process. The stages in this process are fixed cost, variable cost, sales revenue, profit, key comments on the table, units of output.
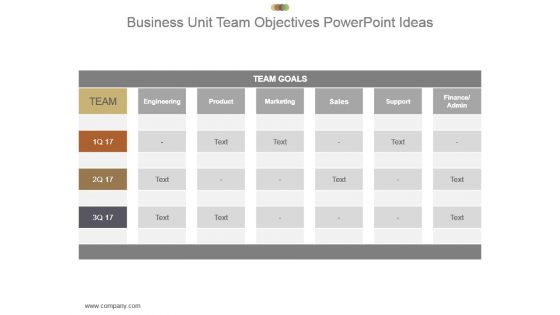
Business Unit Team Objectives Powerpoint Ideas
This is a business unit team objectives powerpoint ideas. This is a four stage process. The stages in this process are team, team goals, engineering, product, marketing, sales, support, finance admin.
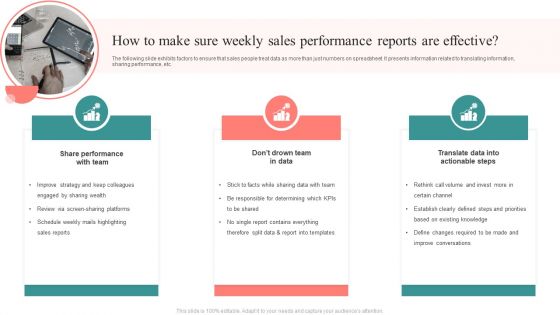
How To Make Sure Weekly Sales Performance Reports Are Effective Ideas PDF
The following slide exhibits factors to ensure that sales people treat data as more than just numbers on spreadsheet. It presents information related to translating information, sharing performance, etc. Presenting How To Make Sure Weekly Sales Performance Reports Are Effective Ideas PDF to dispense important information. This template comprises three stages. It also presents valuable insights into the topics including Share Performance Team, Team Data, Translate Data, Actionable Steps. This is a completely customizable PowerPoint theme that can be put to use immediately. So, download it and address the topic impactfully.
Sales KPIS With Revenue In Last 12 Weeks Ppt PowerPoint Presentation Infographic Template Icons PDF
Presenting this set of slides with name sales kpis with revenue in last 12 weeks ppt powerpoint presentation infographic template icons pdf. The topics discussed in these slides are sales growth, current period, previous period, sales revenue, sales representative, last 12 weeks. This is a completely editable PowerPoint presentation and is available for immediate download. Download now and impress your audience.

 Home
Home