Turnover Dashboard
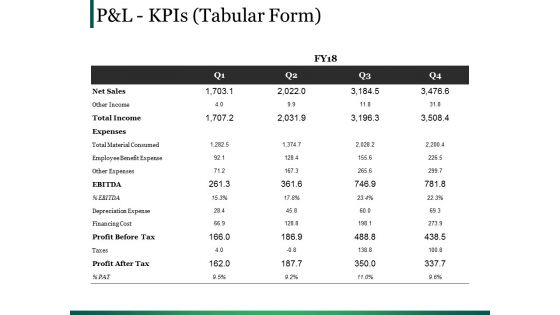
Pandl Kpis Template 1 Ppt PowerPoint Presentation Infographics Tips
This is a pandl kpis template 1 ppt powerpoint presentation infographics tips. This is a four stage process. The stages in this process are ebitda, total income, table, cost, management.
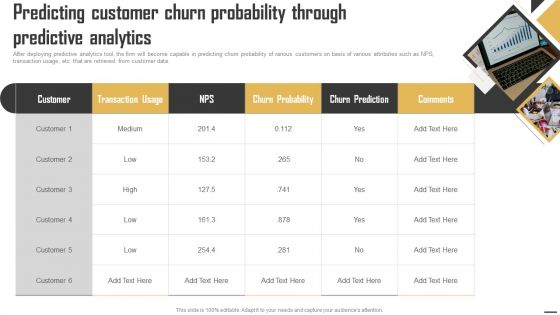
Data Monetization And Management Predicting Customer Churn Probability Through Formats PDF
After deploying predictive analytics tool, the firm will become capable in predicting churn probability of various customers on basis of various attributes such as NPS, transaction usage, etc. that are retrieved from customer data. Are you searching for a Data Monetization And Management Predicting Customer Churn Probability Through Formats PDF that is uncluttered, straightforward, and original Its easy to edit, and you can change the colors to suit your personal or business branding. For a presentation that expresses how much effort youve put in, this template is ideal With all of its features, including tables, diagrams, statistics, and lists, its perfect for a business plan presentation. Make your ideas more appealing with these professional slides. Download Data Monetization And Management Predicting Customer Churn Probability Through Formats PDF from Slidegeeks today.
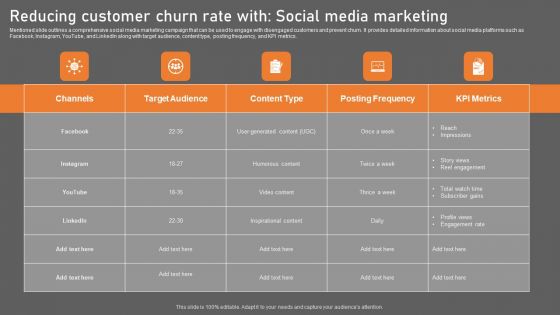
Reducing Customer Churn Rate With Social Media Marketing Infographics PDF
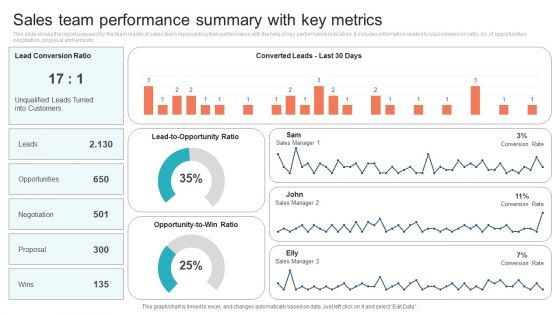
Sales Team Performance Summary With Key Metrics Background PDF
This slide shows the report prepared by the team leader of sales team representing their performance with the help of key performance indicators. It includes information related to lead conversion ratio, no. of opportunities, negotiation, proposal and wins etc. Showcasing this set of slides titled Sales Team Performance Summary With Key Metrics Background PDF. The topics addressed in these templates are Opportunities, Negotiation, Proposal. All the content presented in this PPT design is completely editable. Download it and make adjustments in color, background, font etc. as per your unique business setting.

Data Lineage Methods Features Of Data Lineage Tools Sample PDF
This slide talks about the features of data lineage tools that include visualization, customization and connection, reports, data catalogue, simple installation, and automated documentation. These features make information transparent, reliable, and ready for analysis. Slidegeeks is here to make your presentations a breeze with Data Lineage Methods Features Of Data Lineage Tools Sample PDF With our easy-to-use and customizable templates, you can focus on delivering your ideas rather than worrying about formatting. With a variety of designs to choose from, you are sure to find one that suits your needs. And with animations and unique photos, illustrations, and fonts, you can make your presentation pop. So whether you are giving a sales pitch or presenting to the board, make sure to check out Slidegeeks first
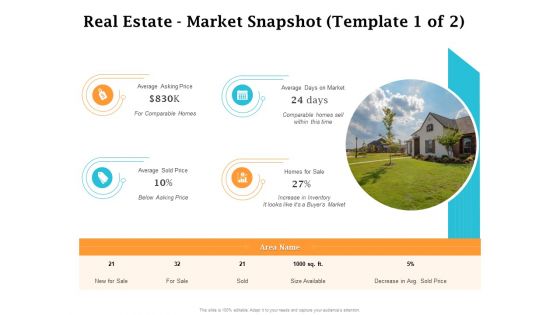
Real Estate Asset Management Real Estate Market Snapshot Average Ppt Slides Aids PDF
Deliver an awe inspiring pitch with this creative real estate asset management real estate market snapshot average ppt slides aids pdf bundle. Topics like sale, market, inventory, price can be discussed with this completely editable template. It is available for immediate download depending on the needs and requirements of the user.
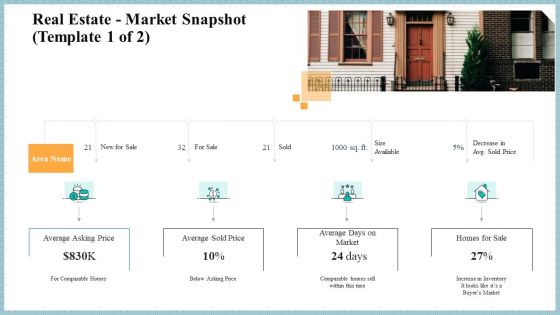
Real Property Strategic Plan Real Estate Market Snapshot Average Ppt Model Graphic Images PDF
Deliver an awe inspiring pitch with this creative real property strategic plan real estate market snapshot average ppt model graphic images pdf bundle. Topics like sale, market, inventory, price can be discussed with this completely editable template. It is available for immediate download depending on the needs and requirements of the user.

Industry Analysis Of Real Estate And Construction Sector Real Estate Market Snapshot Average Demonstration PDF
Deliver an awe inspiring pitch with this creative industry analysis of real estate and construction sector real estate market snapshot average demonstration pdf bundle. Topics like sale, market, inventory, price can be discussed with this completely editable template. It is available for immediate download depending on the needs and requirements of the user.
United States Real Estate Industry Real Estate Market Snapshot Average Ppt Icon Images PDF
Deliver an awe inspiring pitch with this creative united states real estate industry real estate market snapshot average ppt icon images pdf bundle. Topics like sale, market, inventory, price can be discussed with this completely editable template. It is available for immediate download depending on the needs and requirements of the user.

Crm Sales Leads With Marketing Ppt PowerPoint Presentation Picture
This is a crm sales leads with marketing ppt powerpoint presentation picture. This is a five stage process. The stages in this process are inquiry, marketing qualified lead, sales accepted lead, sales qualified lead, close.
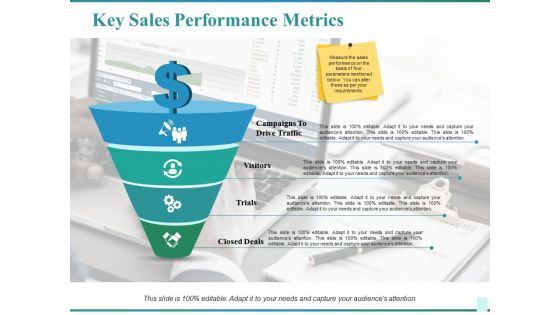
Key Sales Performance Metrics Ppt PowerPoint Presentation Infographics Show
This is a key sales performance metrics ppt powerpoint presentation infographics show. This is a four stage process. The stages in this process are campaigns to drive traffic, visitors, trials, closed deals, business, icons.
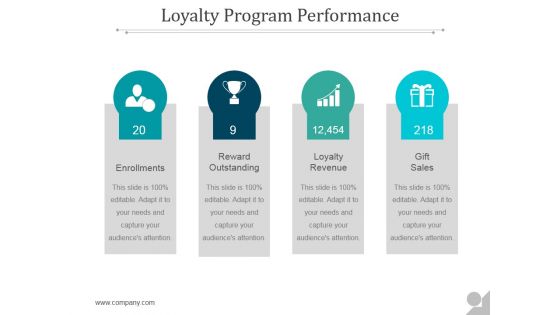
Loyalty Program Performance Ppt PowerPoint Presentation Tips
This is a loyalty program performance ppt powerpoint presentation tips. This is a four stage process. The stages in this process are enrollments, reward outstanding, loyalty revenue, gift sales.
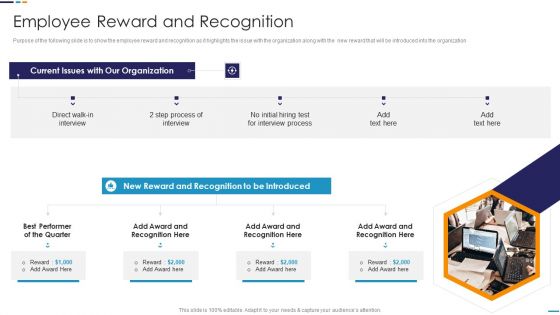
Employee Attrition Rate Management Employee Reward And Recognition Infographics PDF
This is a Employee Attrition Rate Management Employee Reward And Recognition Infographics PDF template with various stages. Focus and dispense information on one stages using this creative set, that comes with editable features. It contains large content boxes to add your information on topics like Direct Walk, Step Process, Interview Process, Award and Recognition, Best Performer Quarter . You can also showcase facts, figures, and other relevant content using this PPT layout. Grab it now.

Three Funnel For Sales Process PowerPoint Templates
This multi colored creative slide has been created by our top designers and is one of the most downloaded slides. The three funnels have appropriate markings to describe the input, output and the steps involved in a process and its flow. The diagram can be effectively used to different kind of advertisements or sales strategies and the expected or received results. The PPT template can be included in the presentation to show a filtration process of some kind. It can be an effective slide in demonstrating the work of different departments as well. The slide can be edited easily to show the raw data that is received by each department, the processing done by that unit and the output produced by that unit.
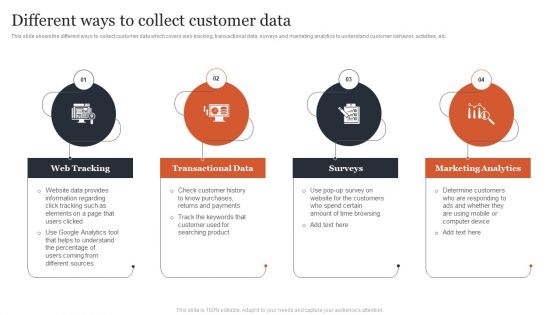
Managing Customer Attrition Different Ways To Collect Customer Data Designs PDF
This slide shows the different ways to collect customer data which covers web tracking, transactional data, surveys and marketing analytics to understand customer behavior, activities, etc. Present like a pro with Managing Customer Attrition Different Ways To Collect Customer Data Designs PDF Create beautiful presentations together with your team, using our easy-to-use presentation slides. Share your ideas in real-time and make changes on the fly by downloading our templates. So whether youre in the office, on the go, or in a remote location, you can stay in sync with your team and present your ideas with confidence. With Slidegeeks presentation got a whole lot easier. Grab these presentations today.
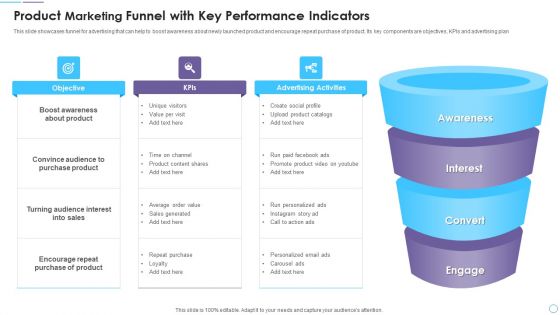
Product Marketing Funnel With Key Performance Indicators Guidelines PDF
This slide showcases funnel for advertising that can help to boost awareness about newly launched product and encourage repeat purchase of product. Its key components are objectives, KPIs and advertising plan. Presenting Product Marketing Funnel With Key Performance Indicators Guidelines PDF to dispense important information. This template comprises four stages. It also presents valuable insights into the topics including Awareness, Interest, Convert, Engage. This is a completely customizable PowerPoint theme that can be put to use immediately. So, download it and address the topic impactfully.

Business Education PowerPoint Templates Business Bar Graph Data Driven Ppt Slides
Business Education PowerPoint Templates Business bar graph data driven PPT Slides-This PowerPoint slide is a data driven Columns Chart. The number of columns depend on the data.-Business Editable PowerPoint Templates Business beveled column chart PPT Slides-This ppt can be used for concepts relating to-chart,, graph, growth, investment, , market, percentage, , presentation report, results, statistics, stock, success and business.
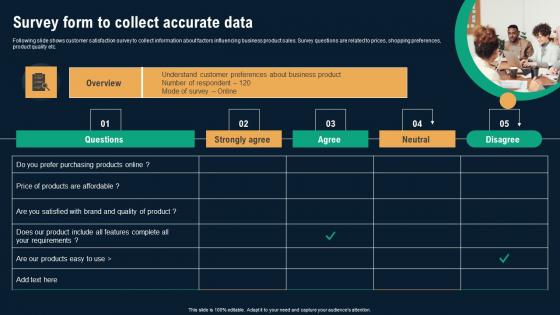
Survey Form To Collect Accurate Data Business Environmental Analysis Microsoft Pdf
Following slide shows customer satisfaction survey to collect information about factors influencing business product sales. Survey questions are related to prices, shopping preferences, product quality etc. Present like a pro with Survey Form To Collect Accurate Data Business Environmental Analysis Microsoft Pdf Create beautiful presentations together with your team, using our easy-to-use presentation slides. Share your ideas in real-time and make changes on the fly by downloading our templates. So whether you are in the office, on the go, or in a remote location, you can stay in sync with your team and present your ideas with confidence. With Slidegeeks presentation got a whole lot easier. Grab these presentations today.
Real Estate Development Real Estate Market Snapshot Price Ppt PowerPoint Presentation Show Icon PDF
Presenting this set of slides with name real estate development real estate market snapshot price ppt powerpoint presentation show icon pdf. This is a four stage process. The stages in this process are average asking price, average sold price, average days market, homes sale, size available. This is a completely editable PowerPoint presentation and is available for immediate download. Download now and impress your audience.

Freehold Property Business Plan Real Estate Market Snapshot Ppt PowerPoint Presentation Show Design Templates PDF
Presenting this set of slides with name freehold property business plan real estate market snapshot ppt powerpoint presentation show design templates pdf. This is a four stage process. The stages in this process are average asking price, average sold price, average days market, homes sale, size available. This is a completely editable PowerPoint presentation and is available for immediate download. Download now and impress your audience.

Selling Home Property Real Estate Market Snapshot Average Ppt Portfolio Good PDF
This is a selling home property real estate market snapshot average ppt portfolio good pdf template with various stages. Focus and dispense information on four stages using this creative set, that comes with editable features. It contains large content boxes to add your information on topics like price, market, sale. You can also showcase facts, figures, and other relevant content using this PPT layout. Grab it now.
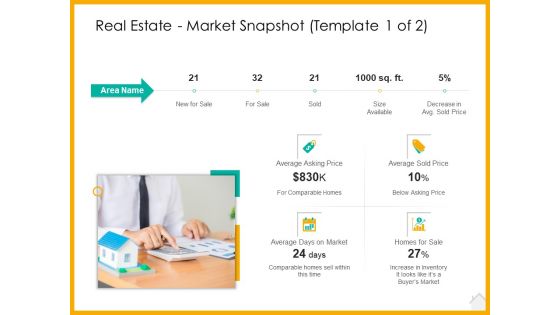
Real Estate Property Management System Real Estate Market Snapshot Average Ppt Infographics Graphics Example PDF
This is a real estate property management system real estate market snapshot average ppt infographics graphics example pdf template with various stages. Focus and dispense information on four stages using this creative set, that comes with editable features. It contains large content boxes to add your information on topics like sale, market, inventory, price. You can also showcase facts, figures, and other relevant content using this PPT layout. Grab it now.

Market Research Analysis Of Housing Sector Real Estate Market Snapshot Average Ppt Outline Example File PDF
Presenting market research analysis of housing sector real estate market snapshot average ppt outline example file pdf to provide visual cues and insights. Share and navigate important information on four stages that need your due attention. This template can be used to pitch topics like sale, market, inventory, price. In addtion, this PPT design contains high resolution images, graphics, etc, that are easily editable and available for immediate download.

Commercial Property Administration And Advancement Real Estate Market Snapshot Average Template PDF
This is a commercial property administration and advancement real estate market snapshot average template pdf template with various stages. Focus and dispense information on four stages using this creative set, that comes with editable features. It contains large content boxes to add your information on topics like sale, market, inventory, price. You can also showcase facts, figures, and other relevant content using this PPT layout. Grab it now.
Data Valuation And Monetization Predicting Customer Churn Probability Through Predictive Analytics Icons PDF
After deploying predictive analytics tool, the firm will become capable in predicting churn probability of various customers on basis of various attributes such as NPS, transaction usage, etc. that are retrieved from customer data.Deliver and pitch your topic in the best possible manner with this Data Valuation And Monetization Predicting Customer Churn Probability Through Predictive Analytics Icons PDF. Use them to share invaluable insights on Transaction, Churn Probability, Comments and impress your audience. This template can be altered and modified as per your expectations. So, grab it now.
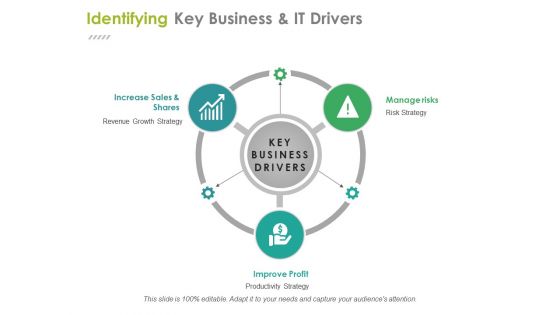
Identifying Key Business And It Drivers Ppt PowerPoint Presentation Ideas Files
This is a identifying key business and it drivers ppt powerpoint presentation ideas files. This is a three stage process. The stages in this process are increase sales and shares, improve profit, manage risks, business, management.
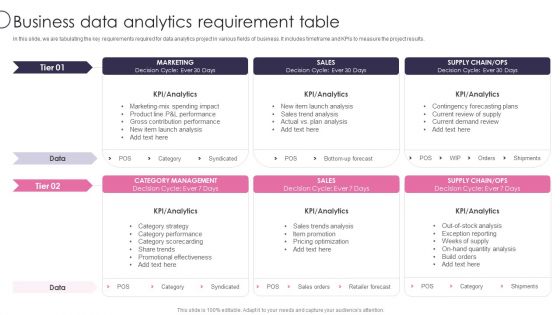
Information Transformation Process Toolkit Business Data Analytics Requirement Table Microsoft PDF
In this slide, we are tabulating the key requirements required for data analytics project in various fields of business. It includes timeframe and KPIs to measure the project results. Deliver an awe inspiring pitch with this creative Information Transformation Process Toolkit Business Data Analytics Requirement Table Microsoft PDF bundle. Topics like Marketing, Sales, Supply Chain can be discussed with this completely editable template. It is available for immediate download depending on the needs and requirements of the user.
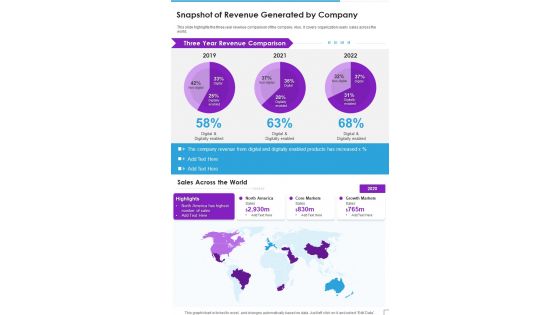
Snapshot Of Revenue Generated By Company Template 348 One Pager Documents
This slide highlights the three year revenue comparison of the company. Also, it covers organization yearly sales across the world. Presenting you a fantastic Snapshot Of Revenue Generated By Company Template 348 One Pager Documents. This piece is crafted on hours of research and professional design efforts to ensure you have the best resource. It is completely editable and its design allow you to rehash its elements to suit your needs. Get this Snapshot Of Revenue Generated By Company Template 348 One Pager Documents A4 One-pager now.

Case Competition Reduction In Existing Customer Of Telecommunication Company Key Performance Indicators Ppt Layouts Graphics Pictures PDF
This is a case competition reduction in existing customer of telecommunication company key performance indicators ppt layouts graphics pictures pdf template with various stages. Focus and dispense information on seven stages using this creative set, that comes with editable features. It contains large content boxes to add your information on topics like key performance indicator, subscribers, technology users, average revenue, customer satisfaction level . You can also showcase facts, figures, and other relevant content using this PPT layout. Grab it now.
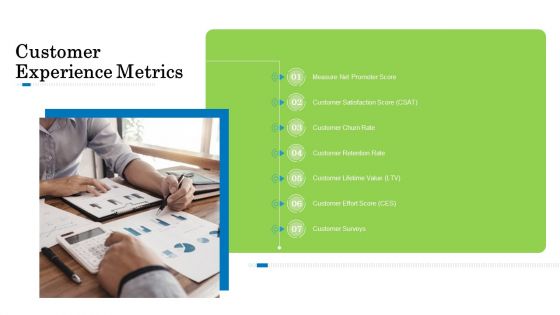
Customer Behavioral Data And Analytics Customer Experience Metrics Topics PDF
Presenting customer behavioral data and analytics customer experience metrics topics pdf to provide visual cues and insights. Share and navigate important information on seven stages that need your due attention. This template can be used to pitch topics like measure net promoter score, customer satisfaction score, customer churn rate, customer retention rate, customer lifetime value. In addtion, this PPT design contains high resolution images, graphics, etc, that are easily editable and available for immediate download.

Comparative Analysis Of Regional Sales Management Software Background Pdf
This slide provides different types of software to manage data of multiple branches automatically and automate transactions between branches. This comparison includes software features such as financial analysis report, resource planning, contact management, etc. Pitch your topic with ease and precision using this Comparative Analysis Of Regional Sales Management Software Background Pdf. This layout presents information on Solutions, Features, Pricing. It is also available for immediate download and adjustment. So, changes can be made in the color, design, graphics or any other component to create a unique layout.
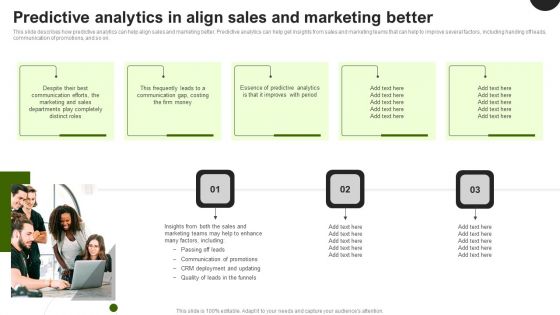
Predictive Analytics In The Age Of Big Data Predictive Analytics In Align Sales And Marketing Better Topics PDF
This slide describes how predictive analytics can help align sales and marketing better. Predictive analytics can help get insights from sales and marketing teams that can help to improve several factors, including handing off leads, communication of promotions, and so on. This modern and well arranged Predictive Analytics In The Age Of Big Data Predictive Analytics In Align Sales And Marketing Better Topics PDF provides lots of creative possibilities. It is very simple to customize and edit with the Powerpoint Software. Just drag and drop your pictures into the shapes. All facets of this template can be edited with Powerpoint no extra software is necessary. Add your own material, put your images in the places assigned for them, adjust the colors, and then you can show your slides to the world, with an animated slide included.
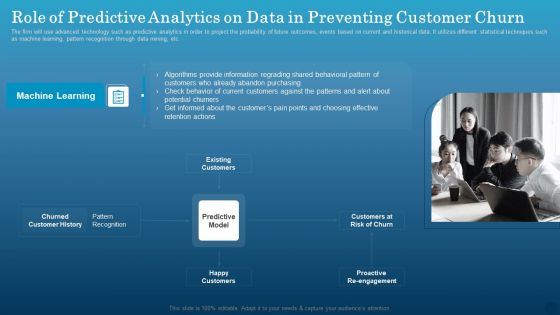
Role Of Predictive Analytics On Data In Preventing Customer Churn Formats PDF
The firm will use advanced technology such as predictive analytics in order to project the probability of future outcomes, events based on current and historical data. It utilizes different statistical techniques such as machine learning, pattern recognition through data mining, etc. Get a simple yet stunning designed Role Of Predictive Analytics On Data In Preventing Customer Churn Formats PDF. It is the best one to establish the tone in your meetings. It is an excellent way to make your presentations highly effective. So, download this PPT today from Slidegeeks and see the positive impacts. Our easy to edit Role Of Predictive Analytics On Data In Preventing Customer Churn Formats PDF can be your go-to option for all upcoming conferences and meetings. So, what are you waiting for Grab this template today.
Data And Analysis Ppt PowerPoint Presentation Icon Diagrams
This is a Data And Analysis Ppt PowerPoint Presentation Icon Diagrams. This is a six stage process. The stages in this process are root cause analysis, opportunity analysis, timeline analysis, force field analysis.
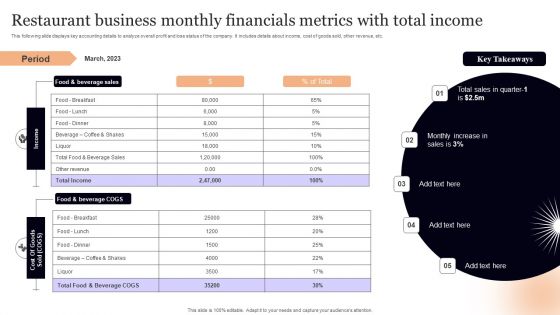
Restaurant Business Monthly Financials Metrics With Total Income Demonstration PDF
This following slide displays key accounting details to analyze overall profit and loss status of the company. It includes details about income, cost of goods sold, other revenue, etc. Pitch your topic with ease and precision using this Restaurant Business Monthly Financials Metrics With Total Income Demonstration PDF. This layout presents information on Period, Key Takeaways, Total Income. It is also available for immediate download and adjustment. So, changes can be made in the color, design, graphics or any other component to create a unique layout.

Sports Marketing Strategies Impact On Major Kpis In Depth Campaigning Guide Infographics PDF
This slide showcases major impact of sports marketing strategies on key performance indicators KPIs. It provides details about sponsored brand sales, return on investment ROI, customer base, merchandise, social media followers, etc. Present like a pro with Sports Marketing Strategies Impact On Major Kpis In Depth Campaigning Guide Infographics PDF Create beautiful presentations together with your team, using our easy-to-use presentation slides. Share your ideas in real-time and make changes on the fly by downloading our templates. So whether you are in the office, on the go, or in a remote location, you can stay in sync with your team and present your ideas with confidence. With Slidegeeks presentation got a whole lot easier. Grab these presentations today.

Route To Market Sales Ppt PowerPoint Presentation Show
This is a route to market sales ppt powerpoint presentation show. This is a five stage process. The stages in this process are business, strategy, marketing, analysis, zig zig, icons.
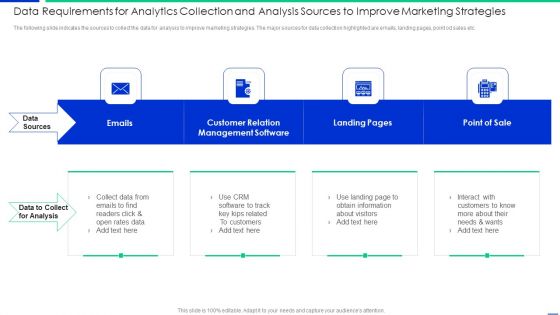
Data Requirements For Analytics Collection And Analysis Sources To Improve Marketing Strategies Download PDF
The following slide indicates the sources to collect the data for analysis to improve marketing strategies. The major sources for data collection highlighted are emails, landing pages, point od sales etc. Persuade your audience using this data requirements for analytics collection and analysis sources to improve marketing strategies download pdf. This PPT design covers four stages, thus making it a great tool to use. It also caters to a variety of topics including emails, management, customers. Download this PPT design now to present a convincing pitch that not only emphasizes the topic but also showcases your presentation skills.

Projected Quarterly Sales Ppt PowerPoint Presentation Outline
This is a projected quarterly sales ppt powerpoint presentation outline. This is a four stage process. The stages in this process are business, strategy, marketing, success, icons.
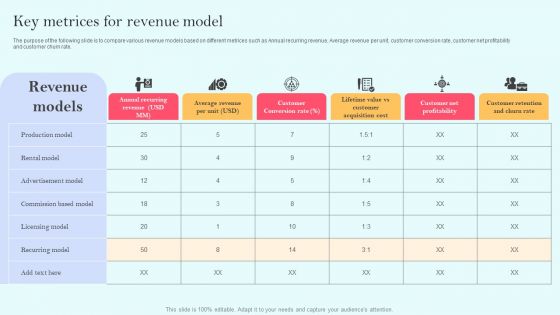
Recurring Income Generation Model Key Metrices For Revenue Model Pictures PDF
The purpose of the following slide is to compare various revenue models based on different metrices such as Annual recurring revenue, Average revenue per unit, customer conversion rate, customer net profitability and customer churn rate. This Recurring Income Generation Model Key Metrices For Revenue Model Pictures PDF is perfect for any presentation, be it in front of clients or colleagues. It is a versatile and stylish solution for organizing your meetings. The Recurring Income Generation Model Key Metrices For Revenue Model Pictures PDF features a modern design for your presentation meetings. The adjustable and customizable slides provide unlimited possibilities for acing up your presentation. Slidegeeks has done all the homework before launching the product for you. So, do not wait, grab the presentation templates today

Big Data Solutions For Enterprises Ppt PowerPoint Presentation Layouts
This is a big data solutions for enterprises ppt powerpoint presentation layouts. This is a four stage process. The stages in this process are media, social, machine, historical.

Saas Continuous Income Generation Model For Software Startup Key Metrices For Forecasting In Recurring Slides PDF
The purpose of the following slide is to display various metrices that can be used to forecast the performance of recurring revenue model. These metrices can be Annual recurring revenue, Customer churn rate, customer lifetime value, account expansion and contraction. Do you have to make sure that everyone on your team knows about any specific topic I yes, then you should give Saas Continuous Income Generation Model For Software Startup Key Metrices For Forecasting In Recurring Slides PDF a try. Our experts have put a lot of knowledge and effort into creating this impeccable Saas Continuous Income Generation Model For Software Startup Key Metrices For Forecasting In Recurring Slides PDF. You can use this template for your upcoming presentations, as the slides are perfect to represent even the tiniest detail. You can download these templates from the Slidegeeks website and these are easy to edit. So grab these today.

Current Analysis Analysing Retail Store Performance DT SS V
This slide help analyse the declining performance of current key performance indicators of retail store. It includes marketing and sales, inventory management, customer relationship, data utilization, employee productivity, and competitive analysis.Whether you have daily or monthly meetings, a brilliant presentation is necessary. Current Analysis Analysing Retail Store Performance DT SS V can be your best option for delivering a presentation. Represent everything in detail using Current Analysis Analysing Retail Store Performance DT SS V and make yourself stand out in meetings. The template is versatile and follows a structure that will cater to your requirements. All the templates prepared by Slidegeeks are easy to download and edit. Our research experts have taken care of the corporate themes as well. So, give it a try and see the results.

Data Chart For Individual Income Analysis Ppt PowerPoint Presentation Layouts Visual Aids
This is a data chart for individual income analysis ppt powerpoint presentation layouts visual aids. This is a five stage process. The stages in this process are financial analysis, quantitative, statistical modelling.

Pyramid Showing Key Performance Indicators For Business Growth Ppt PowerPoint Presentation Layouts Introduction PDF
Persuade your audience using this pyramid showing key performance indicators for business growth ppt powerpoint presentation layouts introduction pdf. This PPT design covers four stages, thus making it a great tool to use. It also caters to a variety of topics including revenue growth, profitability over time, working capital, income sources. Download this PPT design now to present a convincing pitch that not only emphasizes the topic but also showcases your presentation skills.
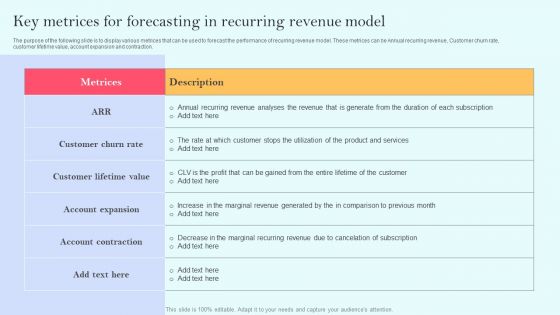
Recurring Income Generation Model Key Metrices For Forecasting In Recurring Revenue Model Summary PDF
The purpose of the following slide is to display various metrices that can be used to forecast the performance of recurring revenue model. These metrices can be Annual recurring revenue, Customer churn rate, customer lifetime value, account expansion and contraction. This modern and well arranged Recurring Income Generation Model Key Metrices For Forecasting In Recurring Revenue Model Summary PDF provides lots of creative possibilities. It is very simple to customize and edit with the Powerpoint Software. Just drag and drop your pictures into the shapes. All facets of this template can be edited with Powerpoint no extra software is necessary. Add your own material, put your images in the places assigned for them, adjust the colors, and then you can show your slides to the world, with an animated slide included.
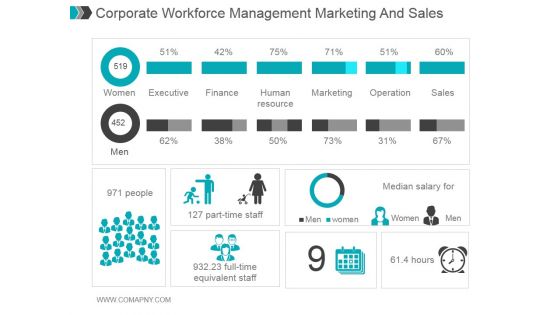
Corporate Workforce Management Marketing And Sales Ppt PowerPoint Presentation Information
This is a corporate workforce management marketing and sales ppt powerpoint presentation information. This is a two stage process. The stages in this process are women, executive, finance, human resource, marketing, operation, sales, median salary for, people, part time staff, full time equivalent staff.
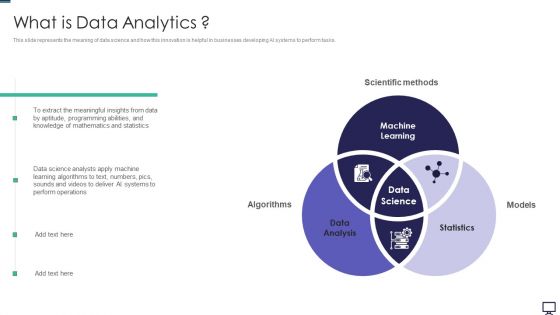
What Is Data Analytics Ppt Professional Slide PDF
This slide represents the meaning of data science and how this innovation is helpful in businesses developing AI systems to perform tasks. Presenting what is data analytics ppt professional slide pdf to provide visual cues and insights. Share and navigate important information on three stages that need your due attention. This template can be used to pitch topics like data analysis, statistics, machine learning. In addtion, this PPT design contains high resolution images, graphics, etc, that are easily editable and available for immediate download.
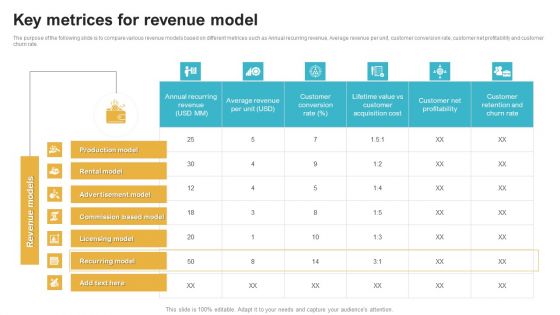
Saas Continuous Income Generation Model For Software Startup Key Metrices For Revenue Model Introduction PDF
The purpose of the following slide is to compare various revenue models based on different metrices such as Annual recurring revenue, Average revenue per unit, customer conversion rate, customer net profitability and customer churn rate. This modern and well arranged Saas Continuous Income Generation Model For Software Startup Key Metrices For Revenue Model Introduction PDF provides lots of creative possibilities. It is very simple to customize and edit with the Powerpoint Software. Just drag and drop your pictures into the shapes. All facets of this template can be edited with Powerpoint no extra software is necessary. Add your own material, put your images in the places assigned for them, adjust the colors, and then you can show your slides to the world, with an animated slide included.
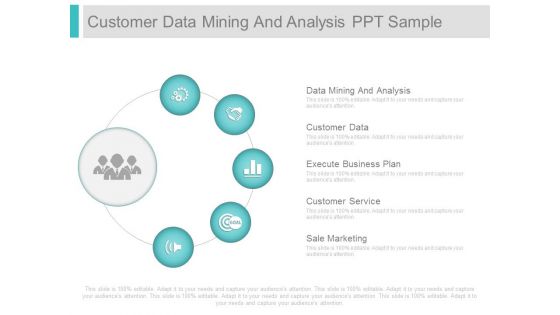
Customer Data Mining And Analysis Ppt Sample
This is a customer data mining and analysis ppt sample. This is a five stage process. The stages in this process are data mining and analysis, customer data, execute business plan, customer service, sale marketing.
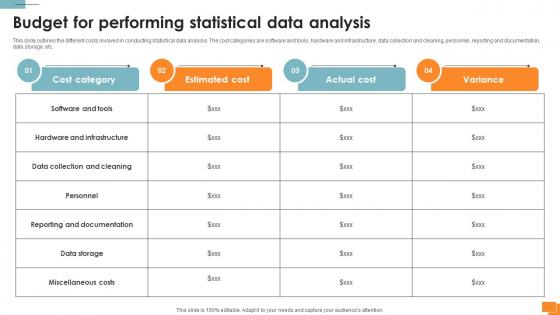
Statistical Tools For Evidence Budget For Performing Statistical Data Analysis
This slide outlines the different costs involved in conducting statistical data analysis. The cost categories are software and tools, hardware and infrastructure, data collection and cleaning, personnel, reporting and documentation, data storage, etc. Slidegeeks is here to make your presentations a breeze with Statistical Tools For Evidence Budget For Performing Statistical Data Analysis With our easy-to-use and customizable templates, you can focus on delivering your ideas rather than worrying about formatting. With a variety of designs to choose from, you are sure to find one that suits your needs. And with animations and unique photos, illustrations, and fonts, you can make your presentation pop. So whether you are giving a sales pitch or presenting to the board, make sure to check out Slidegeeks first

Guide For Marketing Analytics To Improve Decisions Major Challenges And Solutions Of Data Analytics Formats PDF
The following slide illustrates multiple issues in marketing data management along with their solutions to achieve desired goals and results. It includes elements such as real time data collection, visual presentation, data inaccessibility, lack of expertise, automation etc. Make sure to capture your audiences attention in your business displays with our gratis customizable Guide For Marketing Analytics To Improve Decisions Major Challenges And Solutions Of Data Analytics Formats PDF. These are great for business strategies, office conferences, capital raising or task suggestions. If you desire to acquire more customers for your tech business and ensure they stay satisfied, create your own sales presentation with these plain slides.

Our Company Snapshot For Inbound Marketing Business Fundraising Elevator Pitch Deck Clipart PDF
The following slide displays the overview of the company along with the key details such as the date of organizations inception, the name of founder etc. Slidegeeks is here to make your presentations a breeze with Our Company Snapshot For Inbound Marketing Business Fundraising Elevator Pitch Deck Clipart PDF With our easy-to-use and customizable templates, you can focus on delivering your ideas rather than worrying about formatting. With a variety of designs to choose from, youre sure to find one that suits your needs. And with animations and unique photos, illustrations, and fonts, you can make your presentation pop. So whether youre giving a sales pitch or presenting to the board, make sure to check out Slidegeeks first.
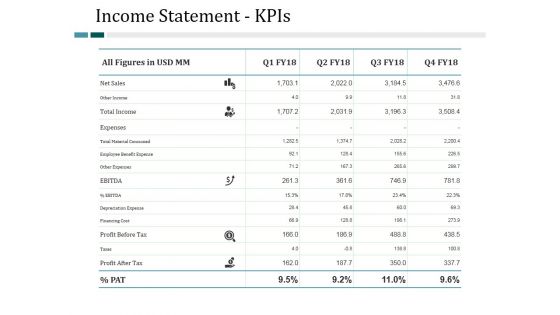
Income Statement Kpis Ppt PowerPoint Presentation Slides Show
This is a income statement kpis ppt powerpoint presentation slides show. This is a four stage process. The stages in this process are business, management, analysis, finance, strategy.
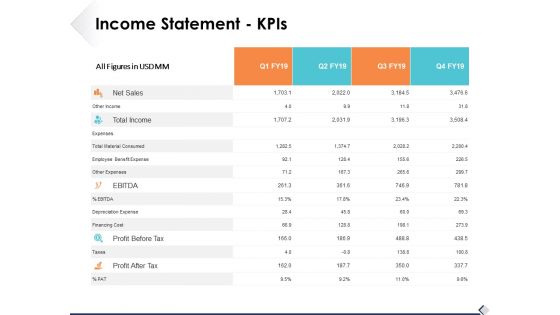
Income Statement Kpis Ppt PowerPoint Presentation Professional Template
This is a income statement kpis ppt powerpoint presentation professional template. This is a four stage process. The stages in this process are business, management, strategy, analysis, icons.

Loss Of Income And Financials Decline In An Automobile Organization Case Study Key Performance Indicators Brochure PDF
The slide shows the key Performance Indicator KPI s which will help the company to track the success rate of implemented strategies. Major KPIs include number of vehicle sold and manufactured, utilization rate, number of visitors, customer satisfaction level etc.Deliver an awe inspiring pitch with this creative loss of income and financials decline in an automobile organization case study key performance indicators brochure pdf bundle. Topics like key performance indicator, utilization rate, customer satisfaction level can be discussed with this completely editable template. It is available for immediate download depending on the needs and requirements of the user
Quarterly Sales Revenue Generation Performance Chart Icon Slides PDF
This graph or chart is linked to excel, and changes automatically based on data. Just left click on it and select edit data. Persuade your audience using this Quarterly Sales Revenue Generation Performance Chart Icon Slides PDF. This PPT design covers four stages, thus making it a great tool to use. It also caters to a variety of topics including Quarterly Sales Revenue, Generation Performance, Chart Icon. Download this PPT design now to present a convincing pitch that not only emphasizes the topic but also showcases your presentation skills.

Gap Analysis Of Actual Vs Desired Sales Performance Enhancement Infographics Pdf
This slide illustrates gap analysis of organizational current and target state to develop action plan for filling performance gaps. It provides information about qualified leads, sales win rates, business profits and customer satisfaction rate. Do you have an important presentation coming up Are you looking for something that will make your presentation stand out from the rest Look no further than Gap Analysis Of Actual Vs Desired Sales Performance Enhancement Infographics Pdf. With our professional designs, you can trust that your presentation will pop and make delivering it a smooth process. And with Slidegeeks, you can trust that your presentation will be unique and memorable. So why wait Grab Gap Analysis Of Actual Vs Desired Sales Performance Enhancement Infographics Pdf today and make your presentation stand out from the rest.
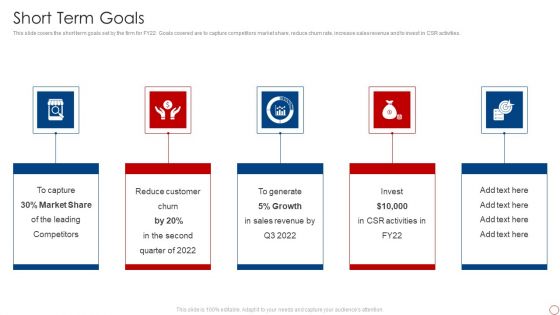
Kpis For Evaluating Business Sustainability Short Term Goals Infographics PDF
This slide covers the short term goals set by the firm for FY22. Goals covered are to capture competitors market share, reduce churn rate, increase sales revenue and to invest in CSR activities. This is a Kpis For Evaluating Business Sustainability Short Term Goals Infographics PDF template with various stages. Focus and dispense information on five stages using this creative set, that comes with editable features. It contains large content boxes to add your information on topics like Market Share, Reduce Customer Churn, Sales Revenue. You can also showcase facts, figures, and other relevant content using this PPT layout. Grab it now.

Business Management Kpis Metrics Income Ppt Example File PDF
This is a business management kpis metrics income ppt example file pdf. template with various stages. Focus and dispense information on six stages using this creative set, that comes with editable features. It contains large content boxes to add your information on topics like budgeted income, received income, accounts receivable. You can also showcase facts, figures, and other relevant content using this PPT layout. Grab it now.

 Home
Home