Survey Infographic
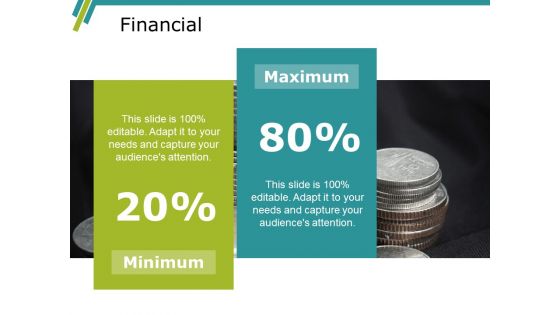
Financial Ppt PowerPoint Presentation Infographics Templates
This is a financial ppt powerpoint presentation infographics templates. This is a two stage process. The stages in this process are minimum, maximum.

Taxation Ppt PowerPoint Presentation Infographics Graphics Example
This is a taxation ppt powerpoint presentation infographics graphics example. This is a one stage process. The stages in this process are finance, marketing, strategy, management, planning.
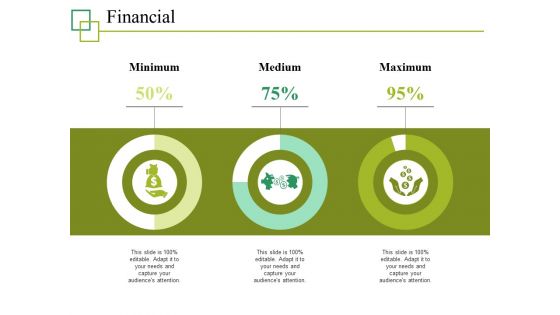
Financial Ppt PowerPoint Presentation Infographics Gallery
This is a financial ppt powerpoint presentation infographics gallery. This is a three stage process. The stages in this process are minimum, medium, maximum.
Financial Ppt PowerPoint Presentation Infographics Clipart
This is a financial ppt powerpoint presentation infographics clipart. This is a two stage process. The stages in this process are dollar, business, finance, marketing.
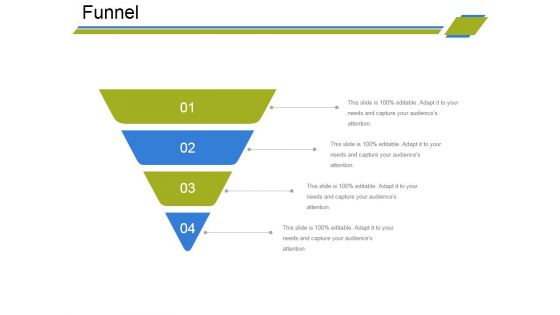
Funnel Ppt PowerPoint Presentation Infographics Guide
This is a funnel ppt powerpoint presentation infographics guide. This is a four stage process. The stages in this process are funnel, marketing, strategy, analysis, sales, business.

Venn Ppt PowerPoint Presentation Infographics Smartart
This is a venn ppt powerpoint presentation infographics smartart. This is a four stage process. The stages in this process are venn, marketing, sale, analysis, business, management.

Silhouettes Ppt PowerPoint Presentation Infographics Microsoft
This is a silhouettes ppt powerpoint presentation infographics microsoft. This is a three stage process. The stages in this process are business, strategy, marketing, analysis, silhouettes.
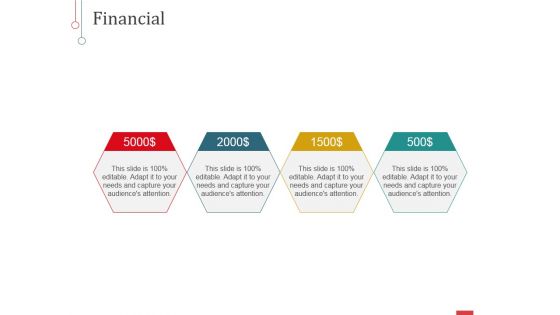
Financial Ppt PowerPoint Presentation Infographics Microsoft
This is a financial ppt powerpoint presentation infographics microsoft. This is a four stage process. The stages in this process are business, finance, marketing, strategy, analysis, investment.
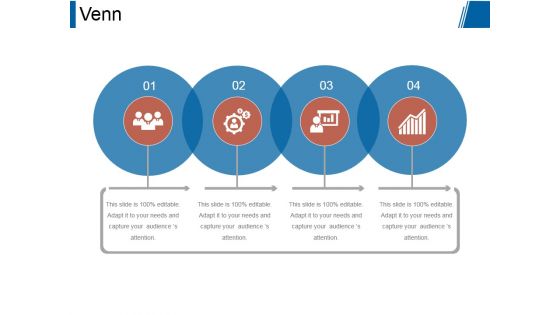
Venn Ppt PowerPoint Presentation Infographics Show
This is a venn ppt powerpoint presentation infographics show. This is a four stage process. The stages in this venn, analysis, business, management, strategy.
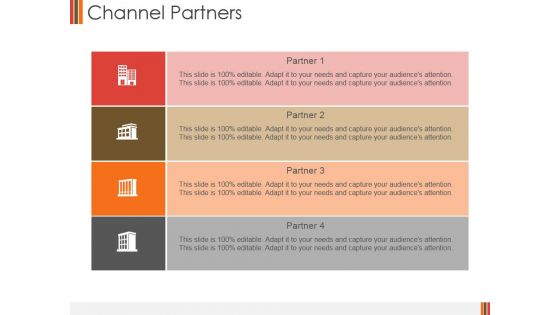
Channel Partners Ppt PowerPoint Presentation Infographics Graphics
This is a channel partners ppt powerpoint presentation infographics graphics. This is a four stage process. The stages in this process are business, icons, management, strategy, analysis, success.
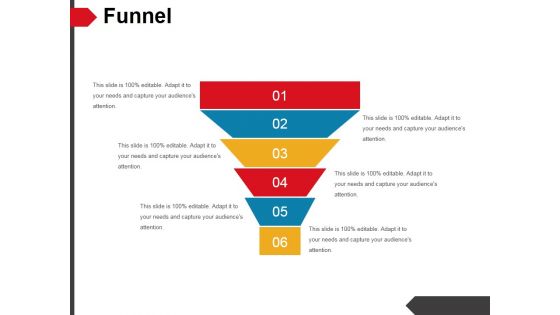
Funnel Ppt PowerPoint Presentation Infographics Templates
This is a funnel ppt powerpoint presentation infographics templates. This is a six stage process. The stages in this process are funnel, marketing, analysis, strategy, business, sales.
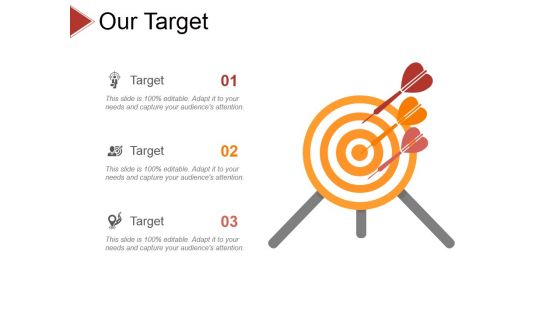
Our Target Ppt PowerPoint Presentation Infographics Summary
This is a our target ppt powerpoint presentation infographics summary. This is a three stage process. The stages in this process are business, strategy, analysis, pretention, target.

Venn Ppt PowerPoint Presentation Infographics Graphics
This is a venn ppt powerpoint presentation infographics graphics. This is a five stage process. The stages in this process are venn, marketing, strategy, analysis, business.

Location Ppt PowerPoint Presentation Infographics Picture
This is a location ppt powerpoint presentation infographics picture. This is a two stage process. The stages in this process are business, strategy, analysis, planning, united states, china.
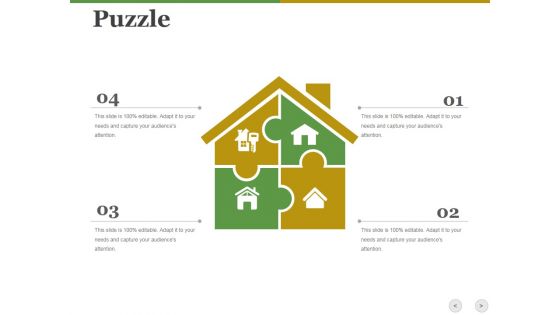
Puzzle Ppt PowerPoint Presentation Infographics Grid
This is a puzzle ppt powerpoint presentation infographics grid. This is a four stage process. The stages in this process are puzzle, marketing, strategy, business, icons, analysis.

Our Team Ppt PowerPoint Presentation Infographics Files
This is a our team ppt powerpoint presentation infographics files. This is a one stage process. The stages in this process are business, marketing, strategy, planning, analysis.

Puzzle Ppt PowerPoint Presentation Infographics Slide Portrait
This is a puzzle ppt powerpoint presentation infographics slide portrait. This is a four stage process. The stages in this process are puzzle, business, management, strategy, analysis.
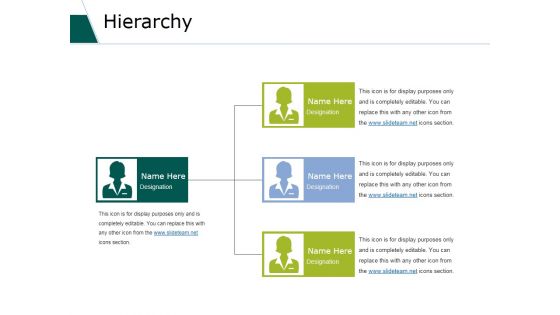
Hierarchy Ppt PowerPoint Presentation Infographics Example
This is a hierarchy ppt powerpoint presentation infographics example. This is a three stage process. The stages in this process are business, marketing, organization, analysis, communication.
Magnifying Glass Ppt PowerPoint Presentation Infographics Templates
This is a magnifying glass ppt powerpoint presentation infographics templates. This is a one stage process. The stages in this process are magnify, technology, marketing, analysis, business.
Results Ppt Powerpoint Presentation Infographics File Formats
This is a results ppt powerpoint presentation infographics file formats. This is a three stage process. The stages in this process are analysis, icon, business, marketing, strategy, finance.
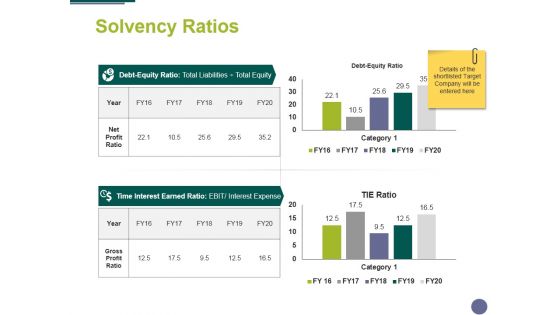
Solvency Ratios Ppt PowerPoint Presentation Infographics Portrait
This is a solvency ratios ppt powerpoint presentation infographics portrait. This is a two stage process. The stages in this process are compere, finance, marketing, analysis, business.
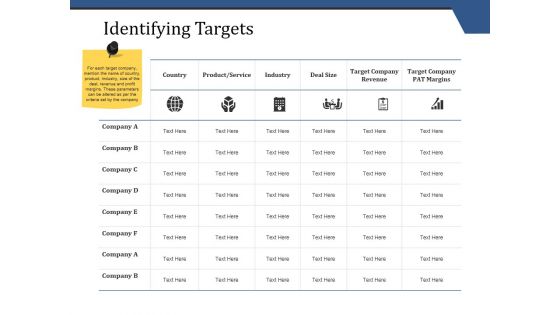
Identifying Targets Ppt PowerPoint Presentation Infographics Maker
This is a identifying targets ppt powerpoint presentation infographics maker. This is a six stage process. The stages in this process are identifying targets, management, analysis, business, success.

Financial Ppt PowerPoint Presentation Infographics Show
This is a financial ppt powerpoint presentation infographics show. This is a one stage process. The stages in this process are finance, strategy, business, marketing, analysis.

Bubble Chart Ppt PowerPoint Presentation Infographics Objects
This is a bubble chart ppt powerpoint presentation infographics objects. This is a two stage process. The stages in this process are finance, business, analysis, marketing, bubble chart.
Mind Map Ppt PowerPoint Presentation Infographics Influencers
This is a mind map ppt powerpoint presentation infographics influencers. This is a five stage process. The stages in this process are mind map, strategy, planning, management, analysis.
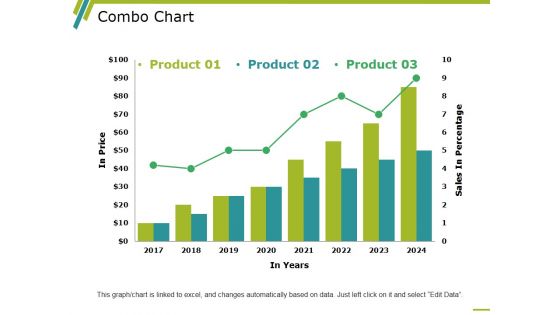
Combo Chart Ppt PowerPoint Presentation Infographics Good
This is a combo chart ppt powerpoint presentation infographics good. This is a three stage process. The stages in this process are combo chart, finance, analysis, business, marketing.
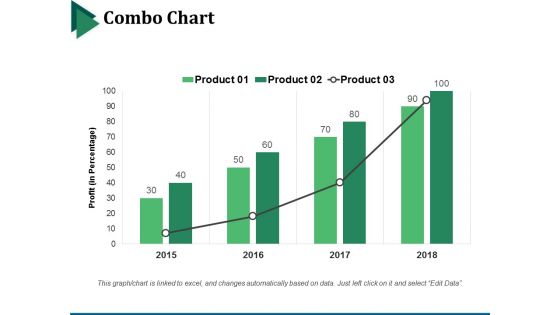
Combo Chart Ppt PowerPoint Presentation Infographics Ideas
This is a combo chart ppt powerpoint presentation infographics ideas. This is a four stage process. The stages in this process are bar graph, marketing, strategy, finance, analysis.

Target Ppt PowerPoint Presentation Infographics Slides
This is a target ppt powerpoint presentation infographics slides. This is a four stage process. The stages in this process are business, marketing, strategy, our goal, analysis.
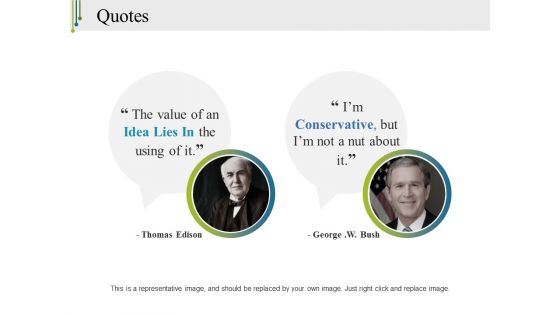
Quotes Ppt PowerPoint Presentation Infographics Visual Aids
This is a quotes ppt powerpoint presentation infographics visual aids. This is a one stage process. The stages in this process are quotes, communication, planning, business, analysis.

Lego Ppt PowerPoint Presentation Infographics Background Images
This is a lego ppt powerpoint presentation infographics background images. This is a four stage process. The stages in this process are lego, game, management, analysis, business.

Clustered Column Ppt PowerPoint Presentation Infographics Picture
This is a clustered column ppt powerpoint presentation infographics picture. This is a two stage process. The stages in this process are finance, marketing, management, investment, analysis.
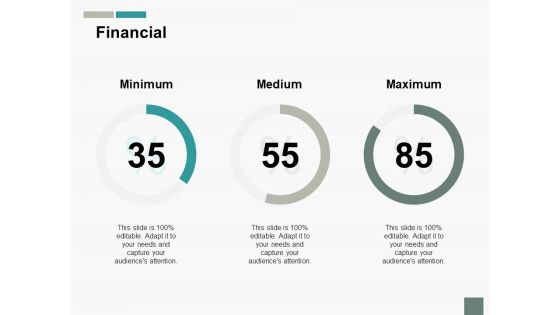
Financial Ppt PowerPoint Presentation Infographics Topics
This is a financial ppt powerpoint presentation infographics topics. This is a three stage process. The stages in this process are finance, marketing, management, investment, analysis.
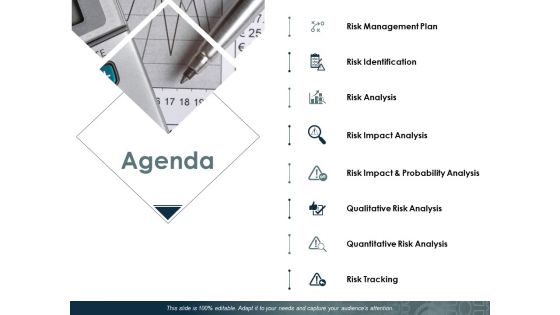
Agenda Ppt PowerPoint Presentation Infographics Designs Download
This is a agenda ppt powerpoint presentation infographics designs download. This is a eight stage process. The stages in this process are risk identification, risk analysis, risk tracking.
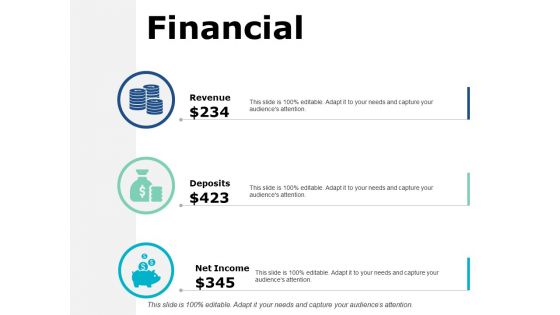
Financial Marketing Ppt PowerPoint Presentation Infographics Pictures
This is a financial marketing ppt powerpoint presentation infographics pictures. This is a three stage process. The stages in this process are finance, analysis, business, investment, marketing.

Agenda For Cobots Global Statistics Infographics PDF
Find a pre designed and impeccable Agenda For Cobots Global Statistics Infographics PDF. The templates can ace your presentation without additional effort. You can download these easy to edit presentation templates to make your presentation stand out from others. So, what are you waiting for Download the template from Slidegeeks today and give a unique touch to your presentation.
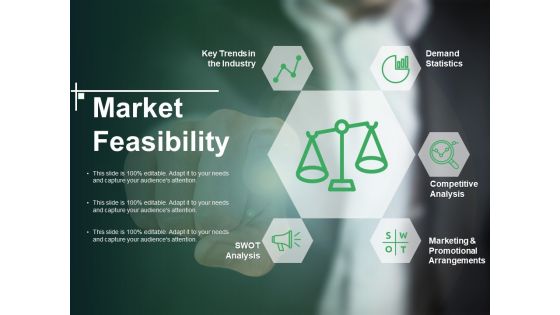
Market Feasibility Ppt PowerPoint Presentation Infographics Brochure
This is a market feasibility ppt powerpoint presentation infographics brochure. This is a six stage process. The stages in this process are demand statistics, competitive analysis, swot analysis, key trends in the industry.
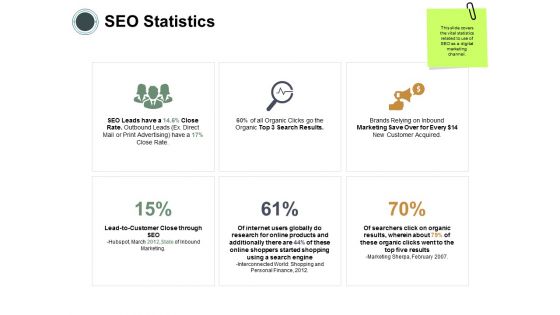
SEO Statistics Ppt PowerPoint Presentation Infographics Skills
Presenting this set of slides with name seo statistics ppt powerpoint presentation infographics skills. This is a six stage process. The stages in this process are business, management, planning, strategy, marketing. This is a completely editable PowerPoint presentation and is available for immediate download. Download now and impress your audience.
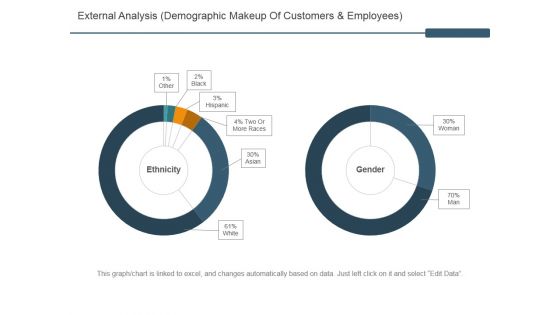
External Analysis Ppt PowerPoint Presentation Infographics Information
This is a external analysis ppt powerpoint presentation infographics information. This is a seven stage process. The stages in this process are education, police, hm forces, local government, civil service.

Opportunity Analysis Ppt PowerPoint Presentation Infographics Skills
This is a opportunity analysis ppt powerpoint presentation infographics skills. This is a six stage process. The stages in this process are importance, ability to complete, low, medium, goals.

Six Years Financial Business Forecast Infographics PDF
This slide shows business financial plan with six years for further planning and budgeting. It include revenue and expenditure from royalty fees, commission, rent, etc. Showcasing this set of slides titled Six Years Financial Business Forecast Infographics PDF. The topics addressed in these templates are Six Years Financial, Business Forecast. All the content presented in this PPT design is completely editable. Download it and make adjustments in color, background, font etc. as per your unique business setting.

Stacked Bar Ppt PowerPoint Presentation Infographics Graphics
This is a stacked bar ppt powerpoint presentation infographics graphics. This is a four stage process. The stages in this process are business, strategy, marketing, success, unit count, in percentage.
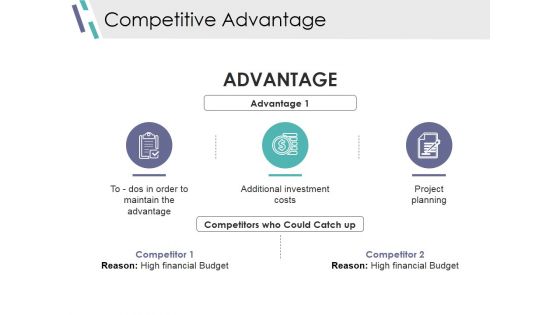
Competitive Advantage Ppt PowerPoint Presentation Infographics Deck
This is a competitive advantage ppt powerpoint presentation infographics deck. This is a three stage process. The stages in this process are maintain the advantage, additional investment costs, project planning, high financial budget.

Campaign Report Ppt PowerPoint Presentation Infographics Diagrams
This is a campaign report ppt powerpoint presentation infographics diagrams. This is a nine stage process. The stages in this process are email name, send date, recipients, delivered, spam, transactions.

Merger Partner Attractiveness Assessment Checklist Infographics PDF
This slide provides information regarding checklist to analyze merger partner attractiveness for further business expansion. The partner attractiveness is assessed through several parameters such as organization size, financial status, long term sustainability, etc. Do you have an important presentation coming up Are you looking for something that will make your presentation stand out from the rest Look no further than Merger Partner Attractiveness Assessment Checklist Infographics PDF. With our professional designs, you can trust that your presentation will pop and make delivering it a smooth process. And with Slidegeeks, you can trust that your presentation will be unique and memorable. So why wait Grab Merger Partner Attractiveness Assessment Checklist Infographics PDF today and make your presentation stand out from the rest.
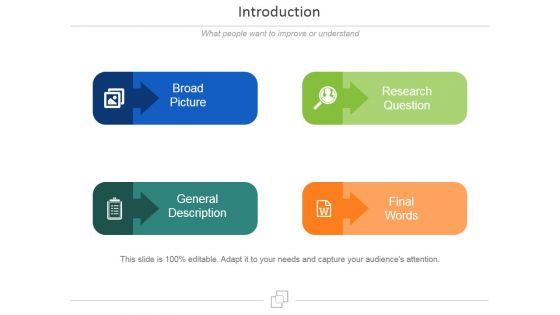
Introduction Ppt PowerPoint Presentation Infographics Design Ideas
This is a introduction ppt powerpoint presentation infographics design ideas. This is a four stage process. The stages in this process are broad picture, research question, general description, final words.

Crowdfunding Escalator Ppt PowerPoint Presentation Infographics Skills
This is a crowdfunding escalator ppt powerpoint presentation infographics skills. This is a five stage process. The stages in this process are donation reward, reward, debt equity, equity debt, institutional.

Mind Map Ppt PowerPoint Presentation Infographics Model
This is a mind map ppt powerpoint presentation infographics model. This is a one stage process. The stages in this process are business, strategy, marketing, success, mind map, finance.

Evaluating Scores Ppt PowerPoint Presentation Infographics Rules
This is a evaluating scores ppt powerpoint presentation infographics rules. This is a seven stage process. The stages in this process are strategic, product advantage, market attractiveness, leverage competencies, financial feasibility, operational feasibility.
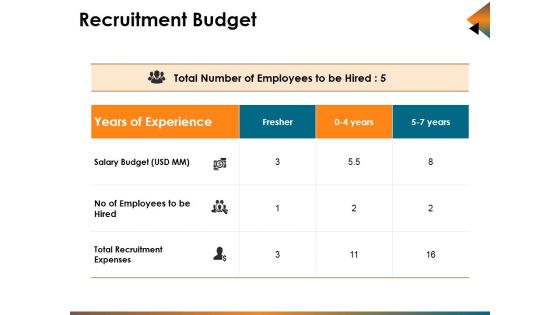
Recruitment Budget Ppt PowerPoint Presentation Infographics Guide
This is a recruitment budget ppt powerpoint presentation infographics guide. This is a three stage process. The stages in this process are years of experience, salary budget, no of employees to be hired, total recruitment expenses.

Traction Ppt PowerPoint Presentation Infographics Templates
This is a traction ppt powerpoint presentation infographics templates. This is a three stage process. The stages in this process are a growing pipeline that will generate, any coverage in articles news.

Competitor Positioning Ppt PowerPoint Presentation Infographics Gridlines
This is a competitor positioning ppt powerpoint presentation infographics gridlines. This is a two stage process. The stages in this process are competitor positioning, company, growth, market growth, business, marketing.
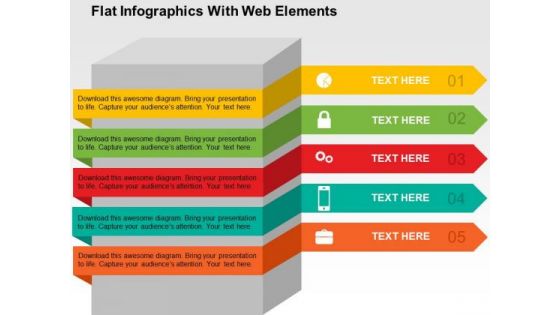
Flat Infographics With Web Elements PowerPoint Templates
Use this diagram of flat Infographics to illustrate business processes. This web elements diagram may also be used to display flow of business steps. This slide is designed to attract the attention of your audience towards business process analysis.
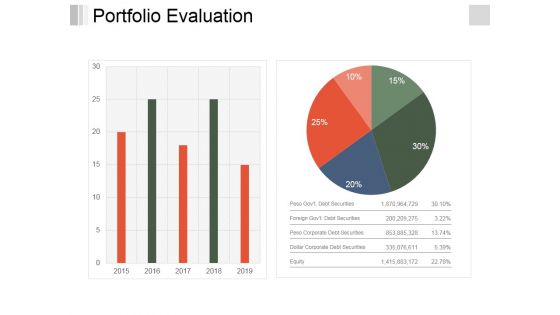
Portfolio Evaluation Ppt PowerPoint Presentation Infographics Objects
This is a portfolio evaluation ppt powerpoint presentation infographics objects. This is a two stage process. The stages in this process are business, finance, bar graph, pie chart, marketing, analysis, investment.

Target Ppt PowerPoint Presentation Infographics Visual Aids
This is a target ppt powerpoint presentation infographics visual aids. This is a four stage process. The stages in this process are business, our goal, target, competition, strategy, analysis.

Combo Chart Ppt PowerPoint Presentation Infographics Sample
This is a combo chart ppt powerpoint presentation infographics sample. This is a three stage process. The stages in this process are combo chart, finance, analysis, marketing, strategy, business.
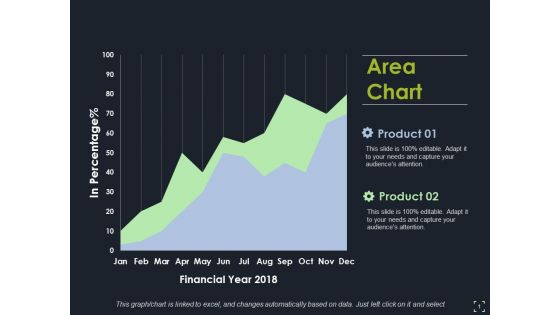
Area Chart Ppt PowerPoint Presentation Infographics Images
This is a area chart ppt powerpoint presentation infographics images. This is a two stage process. The stages in this process are area chart, finance, marketing, analysis, strategy, business.
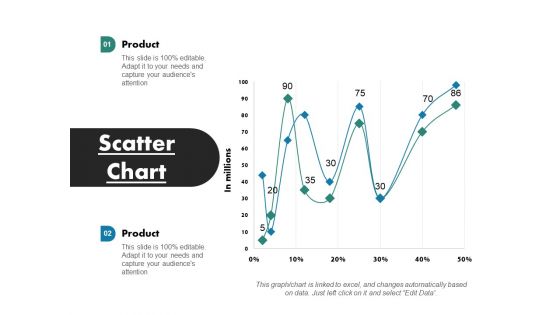
Scatter Chart Ppt PowerPoint Presentation Infographics Designs
This is a scatter chart ppt powerpoint presentation infographics designs. This is a two stage process. The stages in this process are scatter chart, finance, marketing, management, investment, analysis.
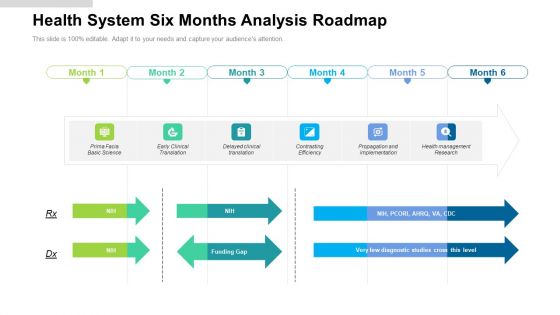
Health System Six Months Analysis Roadmap Infographics
We present our health system six months analysis roadmap infographics. This PowerPoint layout is easy to edit so you can change the font size, font type, color, and shape conveniently. In addition to this, the PowerPoint layout is Google Slides compatible, so you can share it with your audience and give them access to edit it. Therefore, download and save this well researched health system six months analysis roadmap infographics in different formats like PDF, PNG, and JPG to smoothly execute your business plan.
Strategic Performance Analysis Scale Icon Infographics PDF
Showcasing this set of slides titled Strategic Performance Analysis Scale Icon Infographics PDF. The topics addressed in these templates are Strategic Performance, Analysis Scale Icon. All the content presented in this PPT design is completely editable. Download it and make adjustments in color, background, font etc. as per your unique business setting.
Service Price Components Analysis Icon Infographics PDF
Presenting Service Price Components Analysis Icon Infographics PDF to dispense important information. This template comprises three stages. It also presents valuable insights into the topics including Service Price Components, Analysis Icon. This is a completely customizable PowerPoint theme that can be put to use immediately. So, download it and address the topic impactfully.

 Home
Home