Success Metrics

Defining Key Metrics To Analyse Current Sales Performance Rules PDF
The following slide showcases some metrics to evaluate existing sales performance due to execute effective risk management strategies. It includes elements such as opportunities, win rate, average time to win, average value per win, sales velocity etc. Do you know about Slidesgeeks Defining Key Metrics To Analyse Current Sales Performance Rules PDF These are perfect for delivering any kind od presentation. Using it, create PowerPoint presentations that communicate your ideas and engage audiences. Save time and effort by using our pre designed presentation templates that are perfect for a wide range of topic. Our vast selection of designs covers a range of styles, from creative to business, and are all highly customizable and easy to edit. Download as a PowerPoint template or use them as Google Slides themes.
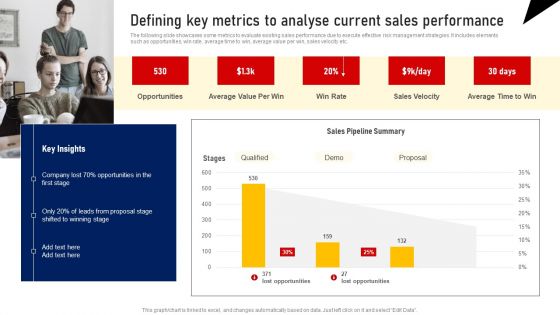
Defining Key Metrics To Analyse Current Sales Performance Summary PDF
The following slide showcases some metrics to evaluate existing sales performance due to execute effective risk management strategies. It includes elements such as opportunities, win rate, average time to win, average value per win, sales velocity etc. Do you know about Slidesgeeks Defining Key Metrics To Analyse Current Sales Performance Summary PDF These are perfect for delivering any kind od presentation. Using it, create PowerPoint presentations that communicate your ideas and engage audiences. Save time and effort by using our pre designed presentation templates that are perfect for a wide range of topic. Our vast selection of designs covers a range of styles, from creative to business, and are all highly customizable and easy to edit. Download as a PowerPoint template or use them as Google Slides themes.
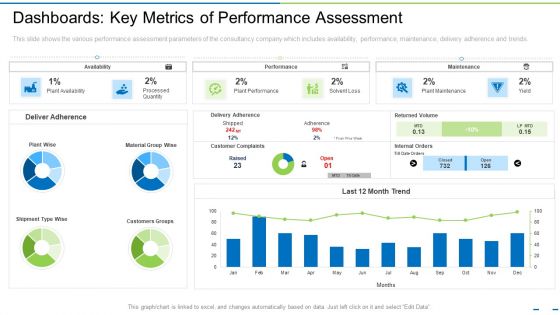
Dashboards Key Metrics Of Performance Assessment Ppt Model Skills PDF
This slide shows the various performance assessment parameters of the consultancy company which includes availability, performance, maintenance, delivery adherence and trends. Deliver and pitch your topic in the best possible manner with this dashboards key metrics of performance assessment ppt model skills pdf. Use them to share invaluable insights on customers groups, performance, customer complaints and impress your audience. This template can be altered and modified as per your expectations. So, grab it now.
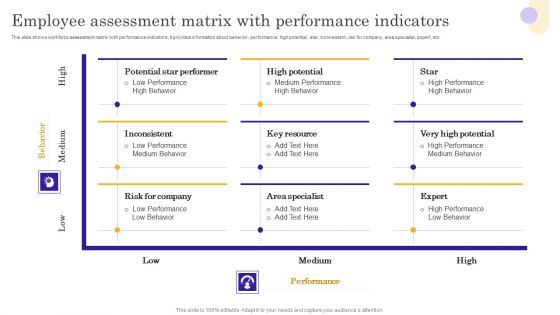
Vendor Performance Assessment Matrix With Scoring Metrics Infographics PDF
This slide shows workforce assessment matrix with performance indicators. It provides information about behavior, performance, high potential, star, inconsistent, risk for company, area specialist, expert, etc. Showcasing this set of slides titled Vendor Performance Assessment Matrix With Scoring Metrics Infographics PDF. The topics addressed in these templates are Potential Star Performer, High Potential, Inconsistent. All the content presented in this PPT design is completely editable. Download it and make adjustments in color, background, font etc. as per your unique business setting.
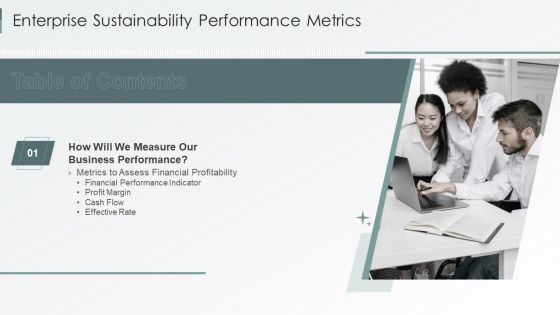
Table Of Contents Enterprise Sustainability Performance Metrics Rules Pictures PDF
This is a Table Of Contents Enterprise Sustainability Performance Metrics Rules Pictures PDF template with various stages. Focus and dispense information on one stage using this creative set, that comes with editable features. It contains large content boxes to add your information on topics like Business Performance, Assess Financial, Performance Indicator. You can also showcase facts, figures, and other relevant content using this PPT layout. Grab it now.
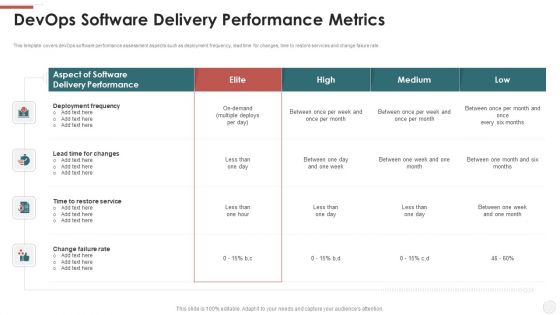
Devops Software Delivery Performance Metrics Ppt Inspiration Background PDF
This template covers devOps software performance assessment aspects such as deployment frequency, lead time for changes, time to restore services and change failure rate. Deliver and pitch your topic in the best possible manner with this devops software delivery performance metrics ppt inspiration background pdf. Use them to share invaluable insights on rate, service, deployment, software and impress your audience. This template can be altered and modified as per your expectations. So, grab it now.

Finance Metrics Dashboard Indicating Portfolio Performance Microsoft PDF
This graph or chart is linked to excel, and changes automatically based on data. Just left click on it and select edit data. Pitch your topic with ease and precision using this Finance Metrics Dashboard Indicating Portfolio Performance Microsoft PDF. This layout presents information on Portfolio Performance Portfolio, Asset Management Manager, Top 10 Assets. It is also available for immediate download and adjustment. So, changes can be made in the color, design, graphics or any other component to create a unique layout.

Project Performance Metrics Our Mission Ppt File Clipart Images PDF
This is a project performance metrics our mission ppt file clipart images pdf template with various stages. Focus and dispense information on three stages using this creative set, that comes with editable features. It contains large content boxes to add your information on topics like vision, mission, goal. You can also showcase facts, figures, and other relevant content using this PPT layout. Grab it now.

Project Performance Metrics Planned Value PV Ppt Show Backgrounds PDF
This is a project performance metrics planned value pv ppt show backgrounds pdf template with various stages. Focus and dispense information on two stages using this creative set, that comes with editable features. It contains large content boxes to add your information on topics like the hours left scheduled on the project, project workers hourly rate, planned percent of tasks left to complete, project budget. You can also showcase facts, figures, and other relevant content using this PPT layout. Grab it now.
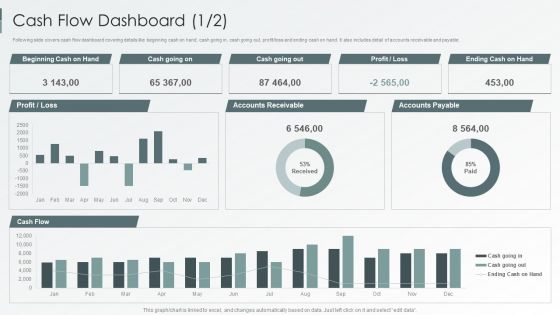
Enterprise Sustainability Performance Metrics Cash Flow Dashboard Inspiration PDF
Following slide covers cash flow dashboard covering details like beginning cash on hand, cash going in, cash going out, profit loss and ending cash on hand. It also includes detail of accounts receivable and payable.Deliver an awe inspiring pitch with this creative Enterprise Sustainability Performance Metrics Cash Flow Dashboard Inspiration PDF bundle. Topics like Accounts Receivable, Accounts Payable, Profit Loss can be discussed with this completely editable template. It is available for immediate download depending on the needs and requirements of the user.
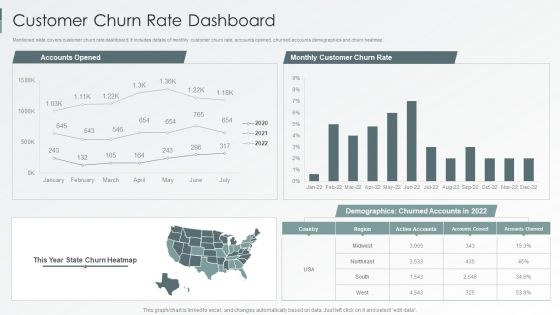
Enterprise Sustainability Performance Metrics Customer Churn Rate Dashboard Summary PDF
Mentioned slide covers customer churn rate dashboard. It includes details of monthly customer churn rate, accounts opened, churned accounts demographics and churn heatmap.Deliver an awe inspiring pitch with this creative Enterprise Sustainability Performance Metrics Customer Churn Rate Dashboard Summary PDF bundle. Topics like Accounts Opened, Demographics Churned, Monthly Customer can be discussed with this completely editable template. It is available for immediate download depending on the needs and requirements of the user.

Enterprise Sustainability Performance Metrics Customer Lifetime Value Dashboard Graphics PDF
This slide covers customer lifetime value dashboard. It covers details of average customer lifetime and average lifetime value in a 12 months format.Deliver and pitch your topic in the best possible manner with this Enterprise Sustainability Performance Metrics Customer Lifetime Value Dashboard Graphics PDF. Use them to share invaluable insights on Average Customer, Lifetime Value, Customer Lifetime and impress your audience. This template can be altered and modified as per your expectations. So, grab it now.

Enterprise Sustainability Performance Metrics Customer Satisfaction Dashboard Designs PDF
Mentioned slide covers customer satisfaction dashboard with a 12-month format. It includes customer satisfaction details by region and by district. Deliver an awe inspiring pitch with this creative Enterprise Sustainability Performance Metrics Customer Satisfaction Dashboard Designs PDF bundle. Topics like Best Demonstrated, Worst Demonstrated, Variance Target can be discussed with this completely editable template. It is available for immediate download depending on the needs and requirements of the user.
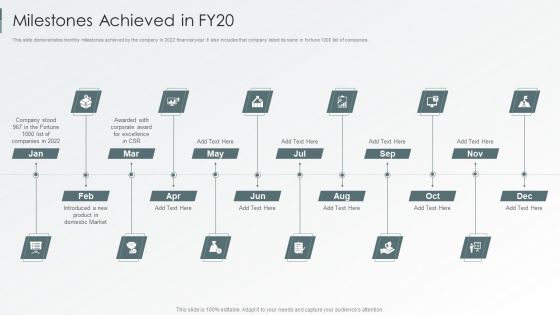
Enterprise Sustainability Performance Metrics Milestones Achieved In FY20 Inspiration PDF
This slide demonstrates monthly milestones achieved by the company in 2022 financial year. It also includes that company listed its name in fortune 1000 list of companies. Deliver an awe inspiring pitch with this creative Enterprise Sustainability Performance Metrics Milestones Achieved In FY20 Inspiration PDF bundle. Topics like Corporate Award, Domestic Market, Award Excellence can be discussed with this completely editable template. It is available for immediate download depending on the needs and requirements of the user.

Enterprise Sustainability Performance Metrics Profit Margin Dashboard Brochure PDF
Following slide illustrates profit margin dashboard with a 12 months format. It also includes gross profit margin, operating profit margin and net profit margin.Deliver an awe inspiring pitch with this creative Enterprise Sustainability Performance Metrics Profit Margin Dashboard Brochure PDF bundle. Topics like Gross Profit, Margin Operating, Profit Margin can be discussed with this completely editable template. It is available for immediate download depending on the needs and requirements of the user.

Quarterly Business Review With Performance Metrics And Results Ideas PDF
This slide shows budgeted v or s actual business projection results. It includes forecast based on growth in sales, target customers and average expenses incurred to attract target audience. Showcasing this set of slides titled Quarterly Business Review With Performance Metrics And Results Ideas PDF. The topics addressed in these templates are Sale, Customer, Average Spent. All the content presented in this PPT design is completely editable. Download it and make adjustments in color, background, font etc. as per your unique business setting.
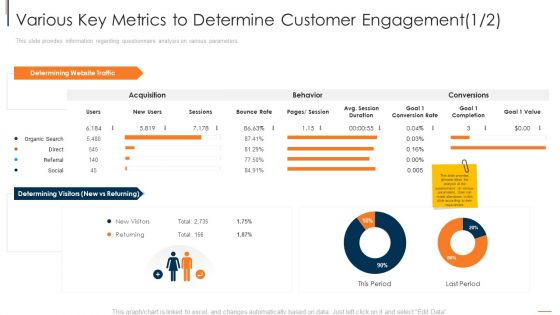
Various Key Metrics To Determine Customer Engagement Users Structure PDF
This slide provides information regarding questionnaire analysis on various parameters. Deliver an awe inspiring pitch with this creative various key metrics to determine customer engagement users structure pdf bundle. Topics like requirement, analysis, determining can be discussed with this completely editable template. It is available for immediate download depending on the needs and requirements of the user.

Business Development Metrics And Scorecard Ppt Powerpoint Slides
This is a business development metrics and scorecard ppt powerpoint slides. This is a four stage process. The stages in this process are business development strategy formulation, assessment of business development strategy, continuous improvement and review strategy, business development, change plan and improvement in strategy.
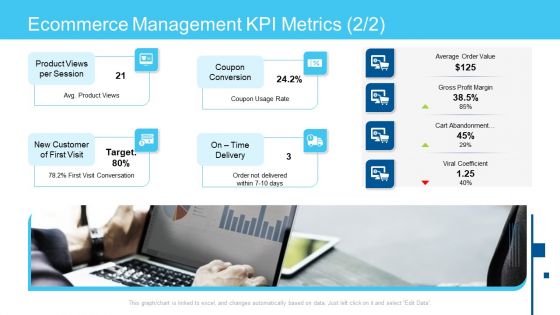
Online Business Framework Ecommerce Management Kpi Metrics Profit Introduction PDF
Presenting online business framework ecommerce management kpi metrics profit introduction pdf to provide visual cues and insights. Share and navigate important information on one stages that need your due attention. This template can be used to pitch topics like customer, product, target. In addtion, this PPT design contains high resolution images, graphics, etc, that are easily editable and available for immediate download.
Transformation KPI Dashboard With Key Metrics And Status Icons PDF
Pitch your topic with ease and precision using this Transformation KPI Dashboard With Key Metrics And Status Icons PDF. This layout presents information on Measure, System Implemented, Innovation. It is also available for immediate download and adjustment. So, changes can be made in the color, design, graphics or any other component to create a unique layout.
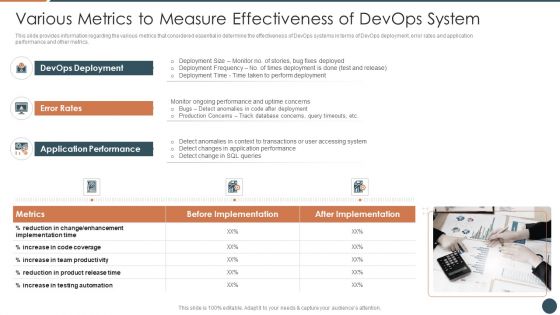
Various Metrics To Measure Effectiveness Of Devops System Introduction PDF
This is a various metrics to measure effectiveness of devops system introduction pdf template with various stages. Focus and dispense information on three stages using this creative set, that comes with editable features. It contains large content boxes to add your information on topics like devops deployment, application performance, error rates . You can also showcase facts, figures, and other relevant content using this PPT layout. Grab it now.

Hiring Metrics With Candidate Experience Ppt PowerPoint Presentation Slides Aids
Presenting this set of slides with name hiring metrics with candidate experience ppt powerpoint presentation slides aids. This is a four stage process. The stages in this process are attrition rate, candidate experience, hiring diversity, conversion rate. This is a completely editable PowerPoint presentation and is available for immediate download. Download now and impress your audience.
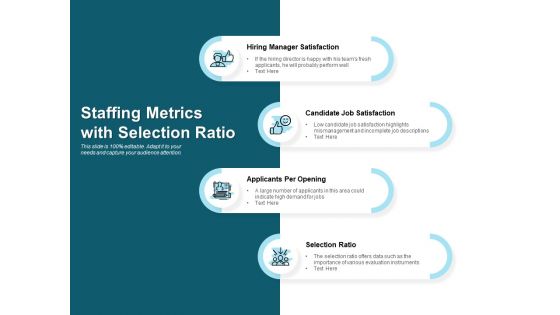
Staffing Metrics With Selection Ratio Ppt PowerPoint Presentation Picture
Presenting this set of slides with name staffing metrics with selection ratio ppt powerpoint presentation picture. This is a four stage process. The stages in this process are hiring manager satisfaction, candidate job satisfaction, applicants per opening, selection ratio. This is a completely editable PowerPoint presentation and is available for immediate download. Download now and impress your audience.
Supply Chain Management Operational Metrics Introduction Guidelines PDF
This is a supply chain management operational metrics introduction guidelines pdf. template with various stages. Focus and dispense information on five stages using this creative set, that comes with editable features. It contains large content boxes to add your information on topics like product, finances, supplier, manufacturer. You can also showcase facts, figures, and other relevant content using this PPT layout. Grab it now.

Agile Service Delivery Model Agile Delivery Metrics Quality Summary PDF
Deliver and pitch your topic in the best possible manner with this agile service delivery model agile delivery metrics quality summary pdf. Use them to share invaluable insights on data warehouse, mobile development, package implementation, time to market, stakeholder satisfactionand impress your audience. This template can be altered and modified as per your expectations. So, grab it now.

Customer Service Metrics Dashboard With Average Response Time Formats PDF
This slide showcases KPI dashboard for customer service that can help to evaluate the performance of call center agents and identify issues arising from different channels. Its key components are number of issues in last 1 day, average time to closes, first call resolution, daily average response time, average time to close by channel and top performing call agents. Pitch your topic with ease and precision using this Customer Service Metrics Dashboard With Average Response Time Formats PDF. This layout presents information on Customer Service, Metrics Dashboard, Average Response Time. It is also available for immediate download and adjustment. So, changes can be made in the color, design, graphics or any other component to create a unique layout.
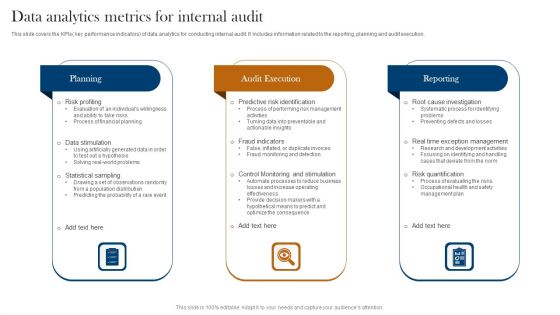
Data Analytics Metrics For Internal Audit Ppt Model Outfit PDF
This slide covers the KPIs key performance indicators of data analytics for conducting internal audit. It includes information related to the reporting, planning and audit execution. Presenting Data Analytics Metrics For Internal Audit Ppt Model Outfit PDF to dispense important information. This template comprises three stages. It also presents valuable insights into the topics including Planning, Audit Execution, Reporting. This is a completely customizable PowerPoint theme that can be put to use immediately. So, download it and address the topic impactfully.
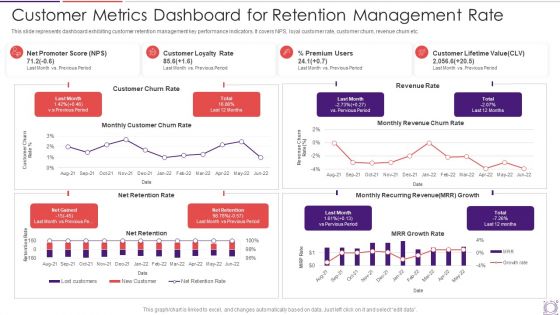
Customer Metrics Dashboard For Retention Management Rate Information PDF
This slide represents dashboard exhibiting customer retention management key performance indicators. It covers NPS, loyal customer rate, customer churn, revenue churn etc. Showcasing this set of slides titled customer metrics dashboard for retention management rate information pdf. The topics addressed in these templates are customer, premium users. All the content presented in this PPT design is completely editable. Download it and make adjustments in color, background, font etc. as per your unique business setting.
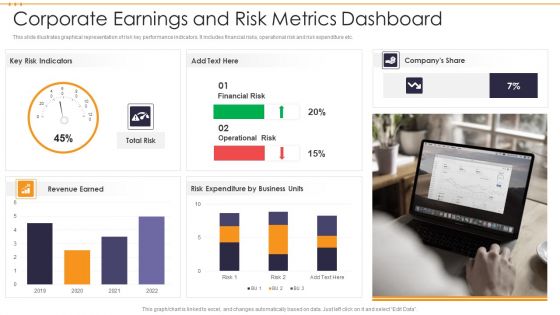
Corporate Earnings And Risk Metrics Dashboard Guidelines PDF
This slide illustrates graphical representation of risk key performance indicators. It includes financial risks, operational risk and risk expenditure etc. Pitch your topic with ease and precision using this Corporate Earnings And Risk Metrics Dashboard Guidelines PDF. This layout presents information on Financial Risk, Operational Risk Expenditure. It is also available for immediate download and adjustment. So, changes can be made in the color, design, graphics or any other component to create a unique layout.
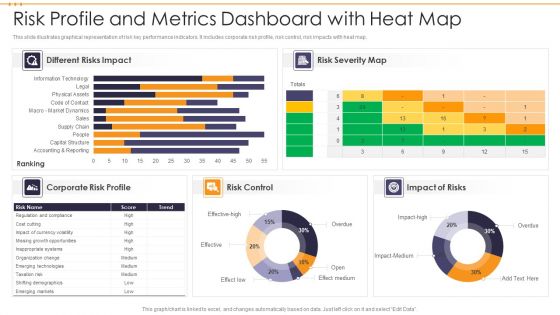
Risk Profile And Metrics Dashboard With Heat Map Brochure PDF
This slide illustrates graphical representation of risk key performance indicators. It includes corporate risk profile, risk control, risk impacts with heat map. Showcasing this set of slides titled Risk Profile And Metrics Dashboard With Heat Map Brochure PDF. The topics addressed in these templates are Risk Control, Impact Of Risks, Risk Severity Map. All the content presented in this PPT design is completely editable. Download it and make adjustments in color, background, font etc. as per your unique business setting.
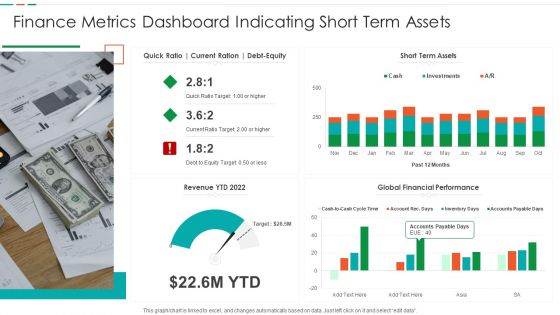
Finance Metrics Dashboard Indicating Short Term Assets Download PDF
This graph or chart is linked to excel, and changes automatically based on data. Just left click on it and select edit data. Pitch your topic with ease and precision using this Finance Metrics Dashboard Indicating Short Term Assets Download PDF. This layout presents information on Short Term Assets, Global Financial Performance, Revenue YTD 2022. It is also available for immediate download and adjustment. So, changes can be made in the color, design, graphics or any other component to create a unique layout.

Net Income Generated Through Campaign Metrics Summary PDF
This slide covers campaign key performance indicators with net income generated which includes delighted net promoter score, net income as compared to projection by each sales representatives. Pitch your topic with ease and precision using this Net Income Generated Through Campaign Metrics Summary PDF. This layout presents information on Standard Customers, Growth Rate, Net Income. It is also available for immediate download and adjustment. So, changes can be made in the color, design, graphics or any other component to create a unique layout.
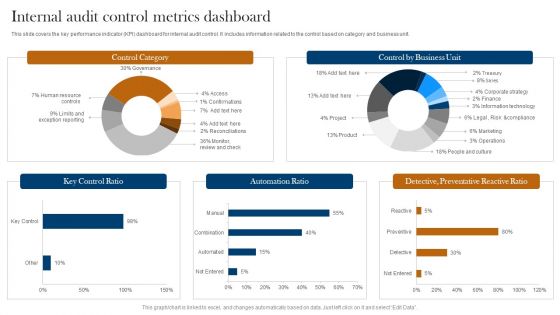
Internal Audit Control Metrics Dashboard Ppt Professional Design Templates PDF
This slide covers the key performance indicator KPI dashboard for internal audit control. It includes information related to the control based on category and business unit. Showcasing this set of slides titled Internal Audit Control Metrics Dashboard Ppt Professional Design Templates PDF. The topics addressed in these templates are Control Category, Key Control Ratio, Automation Ratio. All the content presented in this PPT design is completely editable. Download it and make adjustments in color, background, font etc. as per your unique business setting.
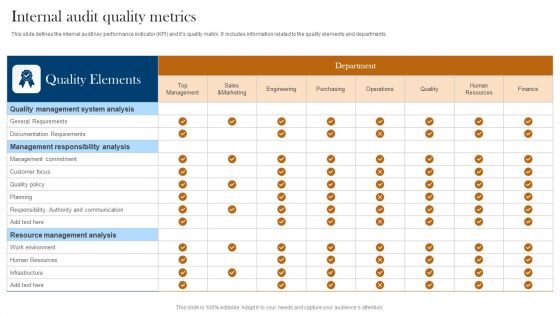
Internal Audit Quality Metrics Ppt Pictures Clipart Images PDF
This slide defines the internal audit key performance indicator KPI and its quality matrix. It includes information related to the quality elements and departments. Showcasing this set of slides titled Internal Audit Quality Metrics Ppt Pictures Clipart Images PDF. The topics addressed in these templates are Quality Elements, Department, Management Responsibility Analysis. All the content presented in this PPT design is completely editable. Download it and make adjustments in color, background, font etc. as per your unique business setting.

Data Driven Marketing Campaigns Key Metrics Dashboard Microsoft PDF
This slide represents the KPI dashboard to track and monitor performance of data driven marketing campaigns launched by the marketing team. It includes details related to conversions by google ads, Facebook and Instagram etc. There are so many reasons you need a Data Driven Marketing Campaigns Key Metrics Dashboard Microsoft PDF. The first reason is you can not spend time making everything from scratch, Thus, Slidegeeks has made presentation templates for you too. You can easily download these templates from our website easily.
Project Metrics Dashboard With Revenues And Expenses Icons PDF
This slide shows the project management dashboard which covers the name, priorities, indicators and status which includes strategic priorities, research and development, administration, performance management, etc. With purchases in last 30 days and tasks. Showcasing this set of slides titled Project Metrics Dashboard With Revenues And Expenses Icons PDF. The topics addressed in these templates are Performance Management, Research And Development, Strategic Priorities. All the content presented in this PPT design is completely editable. Download it and make adjustments in color, background, font etc. as per your unique business setting.
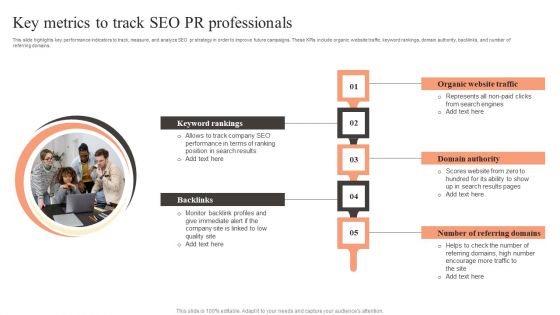
Key Metrics To Track SEO PR Professionals Guidelines PDF
This slide highlights key performance indicators to track, measure, and analyze SEO pr strategy in order to improve future campaigns. These KPIs include organic website traffic, keyword rankings, domain authority, backlinks, and number of referring domains. Introducing Key Metrics To Track SEO PR Professionals Guidelines PDF. to increase your presentation threshold. Encompassed with five stages, this template is a great option to educate and entice your audience. Dispence information on Keyword Rankings, Backlinks, Domain Authority, using this template. Grab it now to reap its full benefits.
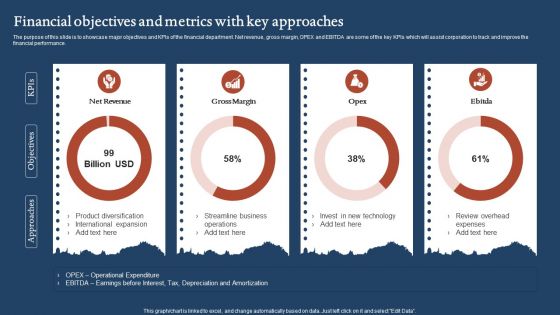
Financial Objectives And Metrics With Key Approaches Portrait PDF
The purpose of this slide is to showcase major objectives and KPIs of the financial department. Net revenue, gross margin, OPEX and EBITDA are some of the key KPIs which will assist corporation to track and improve the financial performance. Showcasing this set of slides titled Financial Objectives And Metrics With Key Approaches Portrait PDF. The topics addressed in these templates are Net Revenue, Gross Margin, Streamline Business. All the content presented in this PPT design is completely editable. Download it and make adjustments in color, background, font etc. as per your unique business setting.

Performance Metrics Ppt PowerPoint Presentation Complete Deck With Slides
If designing a presentation takes a lot of your time and resources and you are looking for a better alternative, then this performance metrics ppt powerpoint presentation complete deck with slides is the right fit for you. This is a prefabricated set that can help you deliver a great presentation on the topic. All the fourteen slides included in this sample template can be used to present a birds-eye view of the topic. These slides are also fully editable, giving you enough freedom to add specific details to make this layout more suited to your business setting. Apart from the content, all other elements like color, design, theme are also replaceable and editable. This helps in designing a variety of presentations with a single layout. Not only this, you can use this PPT design in formats like PDF, PNG, and JPG once downloaded. Therefore, without any further ado, download and utilize this sample presentation as per your liking.
Booting Brand Image By Tracking KPI Metrics Diagrams PDF
This slide consists of key performance indicators to be used by mangers to track the brand awareness . Key metrices covered are content reach, brand mention, blog shares, search volume data, repeat purchase and organic traffic. Showcasing this set of slides titled Booting Brand Image By Tracking KPI Metrics Diagrams PDF. The topics addressed in these templates are Content Reach, Brand Mentions, Blog Shares. All the content presented in this PPT design is completely editable. Download it and make adjustments in color, background, font etc. as per your unique business setting.

Performance Metrics Dashboard Of Procurement Department Download PDF
This slide provides an overview of the various KPIs tracked by the procurement department to determine the status. Major performance indicators covered are total, contracted and unlisted suppliers, rate of contract compliance, cycle time, total spending and savings. Slidegeeks has constructed Performance Metrics Dashboard Of Procurement Department Download PDF after conducting extensive research and examination. These presentation templates are constantly being generated and modified based on user preferences and critiques from editors. Here, you will find the most attractive templates for a range of purposes while taking into account ratings and remarks from users regarding the content. This is an excellent jumping off point to explore our content and will give new users an insight into our top notch PowerPoint Templates.
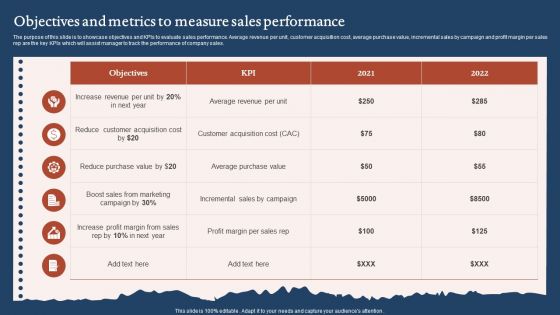
Objectives And Metrics To Measure Sales Performance Sample PDF
The purpose of this slide is to showcase objectives and KPIs to evaluate sales performance. Average revenue per unit, customer acquisition cost, average purchase value, incremental sales by campaign and profit margin per sales rep are the key KPIs which will assist manager to track the performance of company sales. Showcasing this set of slides titled Objectives And Metrics To Measure Sales Performance Sample PDF. The topics addressed in these templates are Reduce Purchase Value, Increase Profit Margin, Customer Acquisition Cost. All the content presented in this PPT design is completely editable. Download it and make adjustments in color, background, font etc. as per your unique business setting.
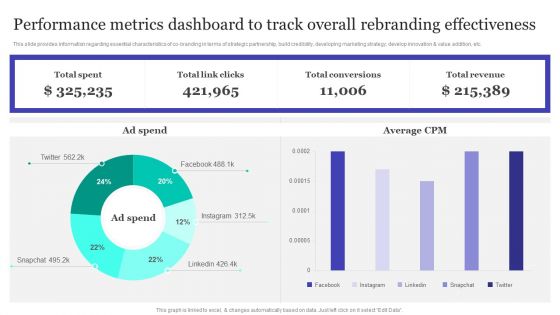
Performance Metrics Dashboard To Track Overall Rebranding Effectiveness Information PDF
This slide provides information regarding essential characteristics of co-branding in terms of strategic partnership, build credibility, developing marketing strategy, develop innovation and value addition, etc. This Performance Metrics Dashboard To Track Overall Rebranding Effectiveness Information PDF from Slidegeeks makes it easy to present information on your topic with precision. It provides customization options, so you can make changes to the colors, design, graphics, or any other component to create a unique layout. It is also available for immediate download, so you can begin using it right away. Slidegeeks has done good research to ensure that you have everything you need to make your presentation stand out. Make a name out there for a brilliant performance.
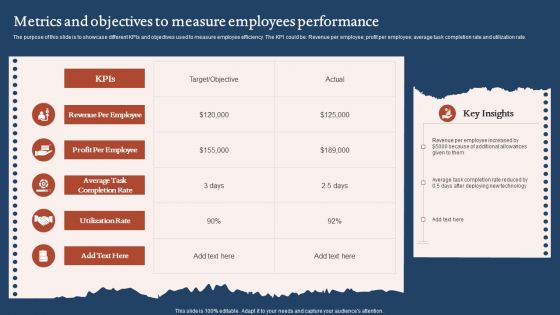
Metrics And Objectives To Measure Employees Performance Clipart PDF
The purpose of this slide is to showcase different KPIs and objectives used to measure employee efficiency. The KPI could be Revenue per employee profit per employee average task completion rate and utilization rate. Showcasing this set of slides titled Metrics And Objectives To Measure Employees Performance Clipart PDF. The topics addressed in these templates are Utilization Rate, Profit Per Employee, Revenue Per Employee. All the content presented in this PPT design is completely editable. Download it and make adjustments in color, background, font etc. as per your unique business setting.

Competitive Analysis Of The Product With Performance Metrics Designs PDF
This slide provides competitive analysis of the product with respect to the competitors based on certain paraments like Customer experience, target audience, Competitive Advantage, Support and Delivery etc.Deliver and pitch your topic in the best possible manner with this competitive analysis of the product with performance metrics designs pdf. Use them to share invaluable insights on organic product materials, competitive advantage, online delivery and retail partners and impress your audience. This template can be altered and modified as per your expectations. So, grab it now.
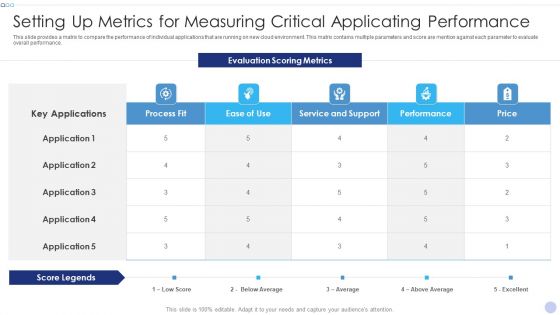
Setting Up Metrics For Measuring Critical Applicating Performance Information PDF
This slide provides a matrix to compare the performance of individual applications that are running on new cloud environment. This matrix contains multiple parameters and score are mention against each parameter to evaluate overall performance.Deliver and pitch your topic in the best possible manner with this Setting Up Metrics For Measuring Critical Applicating Performance Information PDF. Use them to share invaluable insights on Service And Support, Performance, Score Legends and impress your audience. This template can be altered and modified as per your expectations. So, grab it now.

Metrics To Measure Business Performance Cash Flow Dashboard Rules PDF
Following slide covers cash flow dashboard covering details like beginning cash on hand, cash going in, cash going out, profit or loss and ending cash on hand. It also includes detail of accounts receivable and payable. Deliver an awe inspiring pitch with this creative Metrics To Measure Business Performance Cash Flow Dashboard Rules PDF bundle. Topics like Beginning Cash Hand, Cash Going Out, Accounts Payable, Accounts Receivable can be discussed with this completely editable template. It is available for immediate download depending on the needs and requirements of the user.
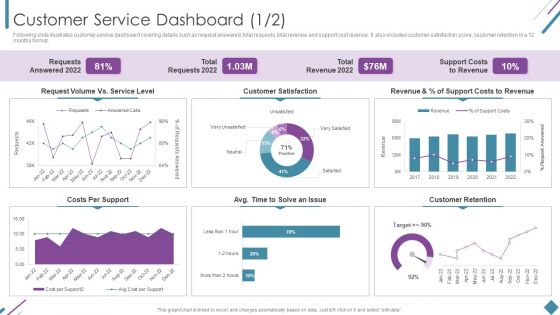
Metrics To Measure Business Performance Customer Service Dashboard Sample PDF
Following slide illustrates customer service dashboard covering details such as request answered, total requests, total revenue and support cost revenue. It also includes customer satisfaction score, customer retention in a 12 months format. Deliver and pitch your topic in the best possible manner with this Metrics To Measure Business Performance Customer Service Dashboard Sample PDF. Use them to share invaluable insights on Requests Answered 2022, Total Requests 2022, Total Revenue 2022 and impress your audience. This template can be altered and modified as per your expectations. So, grab it now.

Human Resource Metrics For Organizational Performance Diagrams PDF
This slide showcases KPIs of human resource that can ensure employee retention and workplace productivity in organization. Its key factors are human capital output, human capital capability and health, culture and attitudes and employee lifecycle. Showcasing this set of slides titled Human Resource Metrics For Organizational Performance Diagrams PDF. The topics addressed in these templates are Human Capital Output, Human Capital Capability Health, Culture Attitudes. All the content presented in this PPT design is completely editable. Download it and make adjustments in color, background, font etc. as per your unique business setting.
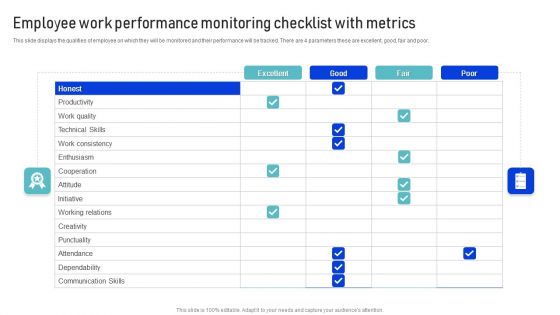
Employee Work Performance Monitoring Checklist With Metrics Infographics PDF
This slide displays the qualities of employee on which they will be monitored and their performance will be tracked. There are 4 parameters these are excellent, good, fair and poor. Showcasing this set of slides titled Employee Work Performance Monitoring Checklist With Metrics Infographics PDF. The topics addressed in these templates are Work Quality, Productivity, Communication Skills. All the content presented in this PPT design is completely editable. Download it and make adjustments in color, background, font etc. as per your unique business setting.

Business Key Performance Metrics Review Dashboard Portrait PDF
The following slide shows a dashboard of sales strategy review of firm that can be used by marketing, product, finance managers for reviewing the business. It further includes KPI that are revenue, new customer, gross profit purchaser satisfaction, income comparison, sales categories and profitability. Showcasing this set of slides titled Business Key Performance Metrics Review Dashboard Portrait PDF. The topics addressed in these templates are Sales, Revenue Comparison, Profitability. All the content presented in this PPT design is completely editable. Download it and make adjustments in color, background, font etc. as per your unique business setting.

Organizations Performance Management Pyramid With Key Metrics Professional PDF
This slide represents the pyramid showcasing the overall performance of the organization. It includes details related to the vision, strategy, objectives, csfs, kpis and actions taken by the organization to increase its performance. Presenting Organizations Performance Management Pyramid With Key Metrics Professional PDF to dispense important information. This template comprises six stages. It also presents valuable insights into the topics including Strategy, Vision, Objectives. This is a completely customizable PowerPoint theme that can be put to use immediately. So, download it and address the topic impactfully.

Target Sales Target Metrics For Sales Representatives Performance Ideas PDF
This slide presents multiple KPIs that can be used to evaluate performance of sales representatives performance in achieving targets. It includes monthly sales growth, sales targets, sales per rep, sales by contact method, sales closing ratio and sales by region or location. Persuade your audience using this Target Sales Target Metrics For Sales Representatives Performance Ideas PDF. This PPT design covers six stages, thus making it a great tool to use. It also caters to a variety of topics including Monthly Sales Growth, Sales Closing Ratio, Region Or Location. Download this PPT design now to present a convincing pitch that not only emphasizes the topic but also showcases your presentation skills.

Performance Metrics With Key Business Objectives Guidelines PDF
The purpose of this slide is to showcase various objectives and KPIs which can be used to evaluate the business performance. The key objectives are awareness, engagement, lead generation, demand generation, customer support and advocacy. Pitch your topic with ease and precision using this Performance Metrics With Key Business Objectives Guidelines PDF. This layout presents information on Social Community Growth, Cost Per Acquisition, Customer Support. It is also available for immediate download and adjustment. So, changes can be made in the color, design, graphics or any other component to create a unique layout.

Performance Metrics Dashboard Highlighting Retail Objectives Sample PDF
The purpose of this slide is to showcase an effective KPI dashboard which can assist store manager to evaluate retail business objectives. The KPIs are sales per square foot, average transaction value, sales per employee, and inventory shrinkage. Pitch your topic with ease and precision using this Performance Metrics Dashboard Highlighting Retail Objectives Sample PDF. This layout presents information on Average Transaction Value, Sales Per Employee. It is also available for immediate download and adjustment. So, changes can be made in the color, design, graphics or any other component to create a unique layout.
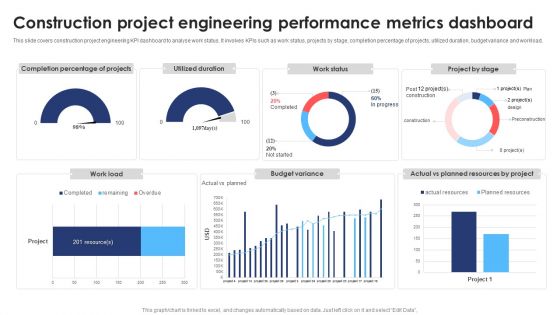
Construction Project Engineering Performance Metrics Dashboard Ideas PDF
This slide covers construction project engineering KPI dashboard to analyse work status. It involves KPIs such as work status, projects by stage, completion percentage of projects, utilized duration, budget variance and workload. Showcasing this set of slides titled Construction Project Engineering Performance Metrics Dashboard Ideas PDF. The topics addressed in these templates are Budget Variance, Resource, Project. All the content presented in this PPT design is completely editable. Download it and make adjustments in color, background, font etc. as per your unique business setting.
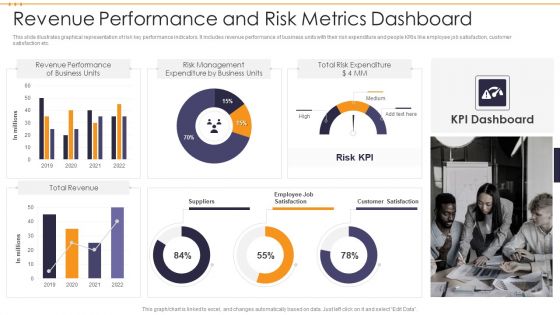
Revenue Performance And Risk Metrics Dashboard Demonstration PDF
This slide illustrates graphical representation of risk key performance indicators. It includes revenue performance of business units with their risk expenditure and people KRIs like employee job satisfaction, customer satisfaction etc. Showcasing this set of slides titled Revenue Performance And Risk Metrics Dashboard Demonstration PDF. The topics addressed in these templates are Total Risk Expenditure, Risk Management, Revenue Performance . All the content presented in this PPT design is completely editable. Download it and make adjustments in color, background, font etc. as per your unique business setting.
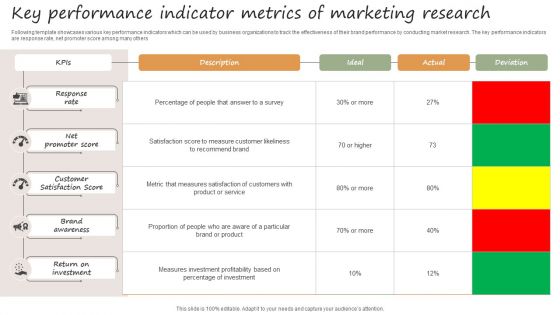
Key Performance Indicator Metrics Of Marketing Research Guidelines PDF
Following template showcases various key performance indicators which can be used by business organizations to track the effectiveness of their brand performance by conducting market research. The key performance indicators are response rate, net promoter score among many others. Showcasing this set of slides titled Key Performance Indicator Metrics Of Marketing Research Guidelines PDF. The topics addressed in these templates are Response Rate, Net Promoter Score, Customer Satisfaction Score . All the content presented in this PPT design is completely editable. Download it and make adjustments in color, background, font etc. as per your unique business setting.
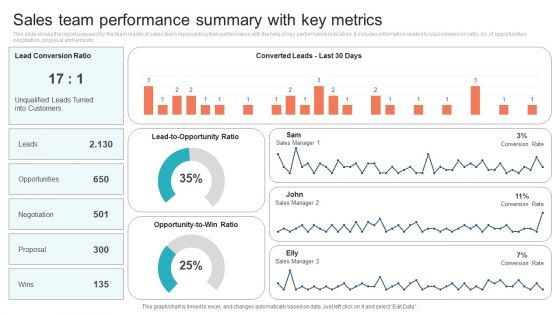
Sales Team Performance Summary With Key Metrics Background PDF
This slide shows the report prepared by the team leader of sales team representing their performance with the help of key performance indicators. It includes information related to lead conversion ratio, no. of opportunities, negotiation, proposal and wins etc. Showcasing this set of slides titled Sales Team Performance Summary With Key Metrics Background PDF. The topics addressed in these templates are Opportunities, Negotiation, Proposal. All the content presented in this PPT design is completely editable. Download it and make adjustments in color, background, font etc. as per your unique business setting.

Marketing Project Metrics Dashboard With Campaign Performance Topics PDF
This slide focuses on marketing project management dashboard which includes total spending, clicks, number of conversions, devices break down, top performing campaigns by cost per conversion such as online data analyzer, gaining insights, best features, etc. Showcasing this set of slides titled Marketing Project Metrics Dashboard With Campaign Performance Topics PDF. The topics addressed in these templates are Average, Cost, Analyzing Data. All the content presented in this PPT design is completely editable. Download it and make adjustments in color, background, font etc. as per your unique business setting.

 Home
Home